
 Open Access Article
 This Open Access Article is licensed under a
 Creative Commons Attribution 3.0 Unported Licence
An integrated platform for metamaterial-based sensing and surface acoustic wave-based acoustofluidics utilising circular interdigital transducers
Shahrzad
Zahertar
a,
Hamdi
Torun
 *a,
Ran
Tao
ba,
Pep
Canyelles-Pericas
ca,
Jingting
Luo
ba,
Qiang
Wu
a and
Yong-Qing
Fu
*a
*a,
Ran
Tao
ba,
Pep
Canyelles-Pericas
ca,
Jingting
Luo
ba,
Qiang
Wu
a and
Yong-Qing
Fu
*a
aFaculty of Engineering & Environment, University of Northumbria, Newcastle upon Tyne, NE1 8ST, UK. E-mail: hamdi.torun@northumbria.ac.uk; richard.fu@northumbria.ac.uk
bShenzhen Key Laboratory of Advanced Thin Films and Applications, College of Physics and Optoelectronic Engineering, Shenzhen University, 518060, China
cDepartment of Integrated Devices and Systems, MESA+ Institute, University of Twente, Enschede, 7522 NB, The Netherlands
First published on 31st January 2022
Abstract
A key challenge in developing lab-on-a-chip devices is integrating various functionalities such as liquid manipulation and sensing on a single platform, which conventionally requires different technologies to be separately optimized. In this paper, we design circular or ring-shape interdigitated structures on a piezoelectric substrate that can be used for both sensing and liquid manipulation for point-of-care applications. We present acoustofluidic functionalities including streaming, jetting and nebulisation using the circular surface acoustic wave device to demonstrate the acoustofluidic manipulation capabilities of the actuator. We then optimise the design inspired by the double split-ring resonator geometry so that the device geometry can be used as a high performance wireless and electromagnetic sensor. We present the wireless-sensing capabilities of the device with case studies in monitoring glucose concentration and the fermentation process of yeast cells.
Introduction
Wearable and integrated devices for tracking physical parameters such as pedometers and heart rate monitors have reached a certain level of maturity with their successful markets.1–5 However, bringing these devices to the market for diagnostics with capabilities of biosampling and liquid analysis remains a challenge. Effective and clinically validated wearables can be used for continuous health monitoring that is especially important for an ageing population. In addition, these devices can be used in point-of-care (PoC) settings where remote health monitoring is sought after.6,7 Lab-on-a-chip (LoC) technology has a high potential to address these needs. There has been significant interest in the development of advanced LoC devices in recent years.8–10 However, achieving a market-ready device still requires crucial improvements of its performance. The objective in developing a LoC device, as its name suggests, is to implement the whole process of a laboratory onto a small chip, and therefore, requires integration of multiple technologies/platforms that are capable of liquid preparation, separation and sensing, simultaneously.11–14Wireless sensing is desirable for LoC devices especially when they are used in wearable configurations where the active sensors and sensor arrays can be located away from a readout unit.15,16 Among different technologies for wireless sensing, electromagnetic metamaterials with their exceptional high-quality factors have been demonstrated effectively.17,18 Metamaterials are artificially engineered structures that possess properties that are not readily available in nature, for example, those designed materials having negative values of permittivity and permeability at the same time. Split-ring resonators (SRRs) are among the basic building blocks of metamaterials.19–21 When exposed to electromagnetic radiation, these structures can resonate due to their interaction with radiation. Their fundamental resonant frequency depends on their geometry and the composition of the materials around them.22 Altering any of these parameters will result in a change in the resonant frequency, and this mechanism has been utilized for various sensing applications including biomedical,23–26 chemical,27–30 and environmental sensors,31,32 as well as in food industry.33,34 Metamaterials have been demonstrated for different bands in the electromagnetic spectrum from microwaves to terahertz frequencies.35,36 Metamaterial-based resonators can be integrated into LoC devices due to their sensing capabilities. However, they are incapable of liquid manipulation; therefore, they cannot form an LoC device on their own.
On the other hand, surface acoustic wave (SAW) actuators have been extensively studied for the manipulation of liquids particularly with volumes of microlitres or even smaller.37–39 SAW devices are commonly composed of interdigitated electrodes that are patterned on a piezoelectric substrate. They have been widely used in acoustofluidics to manipulate droplets for sample preparation, sorting, patterning, mixing, pumping, jetting, and nebulisation.40,41 In addition, SAW devices have been successfully demonstrated as biomolecular and environmental sensors.42–47 However, numerous environmental factors and variations in material characteristics such as conductivity, pressure, mass loading, temperature, humidity and viscosity can influence the SAW sensing mechanism41 making the specificity of these devices complicated. Also, achieving high sensitivity levels in molecular sensing requires scaling down the size of the device, which is challenging due to the complexity attributed to the miniaturization and fabrication process.48
Recently, we proposed a concept of combining electromagnetic metamaterial-inspired sensors and surface acoustic wave (SAW) actuators on a single platform for LoC applications,49,50 and we demonstrated that the electromagnetic sensing capabilities of metamaterials and the liquid droplet manipulation capabilities of SAW devices can be combined in a single structure. Combining liquid manipulation and sensing capabilities in a single structure can make it possible to realise integrated LoC platforms with advance functionalities. For example, the devices can be used to analyse liquid samples dynamically while they are mixed with a different liquid on the spot. In addition, these devices can be operated in an array formation where each device will be a single analyser unit. Such an architecture can be used as a multiple target analyser if each unit is functionalised with different agents.
In this paper, we propose a new device based on circular interdigitated transducers (IDTs) that are configured in a split-ring resonator (SRR) geometry. The circular design of IDTs focuses traveling SAWs in a focal point and acoustic energy from various directions are accumulated in this point, which can be beneficial for effective mixing/streaming of particles/cells and efficient jetting and nebulisation of droplets.49,51,52 We verify this by utilising a standard circular IDT design and by experimenting various acoustofluidic functions such as streaming, jetting and nebulisation. In the next step, we have optimised our design for performing metamaterial-based sensing. Our optimised design includes an additional set of IDTs compared to our standard design and is inspired by a double split ring resonator (DSRR) geometry. DSRRs in the concept of metamaterials include two individual SRRs with gaps positioned on the opposite direction from each other and are implemented to increase the effective capacitance of the resonator. The new design incorporating circular DSSR-inspired IDTs can be advantageous in several domains including (1) lowering the resonant frequency in a specific frequency band, to be employed as multi-band sensors; (2) controlling the frequency by altering the position of the gap on one of the resonators, and (3) designing a more compact device at a target frequency.53,54 In this paper, we demonstrate the metamaterial-based sensing capabilities of the DSRR-inspired device based on different experiments where we measured glucose concentration of droplets, characterised various dielectric materials, and monitored the yeast fermentation process over time.
Methods
Device fabrication
We have fabricated standard circular IDTs consisting of 15 finger pairs with a wavelength of λ = 400 μm and the smallest ring has an inner radius of 5 mm. We have also fabricated another device with the DSRR geometry, for the optimisation of metamaterial-based sensing. In the optimised design, each set of rings consists of 15 pairs of IDTs with a wavelength of λ = 200 μm. The smaller ring has an inner radius of 4.4 mm, and an outer radius of 11 mm. The larger ring has an inner radius of 11 mm and an outer radius of 13.95 mm. The gap of each split is 1.2 mm (as shown in the inset of Fig. 2(b)). All the devices were fabricated through standard photolithography and lift-off processes. Cr/Au with thicknesses of 20/100 nm were selected as the materials for electrodes and were deposited by thermal evaporation (EDWARDS AUTO306) on a 128° Y-cut lithium niobate (LiNbO3) substrate of 500 μm thick.Experimental setup
For acoustic characterisation, the fabricated standard device was placed on a holder and an SMA connector was used to connect the IDT electrode pads to one port of a vector network analyser (Keysight N9913A). For microfluidic actuation experiments, the standard circular IDT design was utilised, and three sets of experiments were performed. In all the experiments, a signal generator (Aim TTi, TG5011A) was used to set the signal to the intended frequency and the output of the signal generator was fed to an amplifier (Amplifier Research, model 75A250) to amplify the signal. The electrode pads on the device under the tests were connected to the amplifier through an SMA connector to generate surface acoustic waves. The value of the input power was measured using an RF power meter (RACAL Equipment, 9104).In the first set of acoustofluidic experiments, a thin glass slide of 100 μm thick was placed on top of the device with a thin layer of water in between, to form a superstrate design. A 5 μl deionised (DI) water droplet consisting of polystyrene microbeads (with a diameter of 10 μm) was placed on top of the glass slide to monitor the streaming inside the droplet at a power within the range of 1.1–8.4 W and a frequency of 9.8 MHz. For the nebulisation experiment, a 2 μl water droplet was placed on the substrate and the power and frequency were set to 15 W and 9.8 MHz, respectively. In the second set of acoustofluidic tests, a 1 μl water droplet was placed in the centre of the IDTs, and a power of 4.6 W at 9.8 MHz was applied to achieve atomisation. In the third set of acoustofluidic experiments, the central region on the surface of the standard circular IDT device was treated with 1% CYTOP solution (L-809A) by drop-coating and the surface was heated to 150 °C for ∼5 minutes. A 2 μl water droplet was placed in the centre of the IDTs and a power in the range of 0.5–5 W at 9.8 MHz was applied to achieve streaming and jetting. All these acoustofluidic experiments were captured by utilising a standard video camera.
For electromagnetic characterisation, a copper loop antenna with a perimeter of 8.8 cm was connected to one port of a vector network analyser (Agilent Technologies, N5230A) and was utilised to excite the device-under-test electromagnetically. The S11 response of the antenna was captured to characterise the device. Different sensing experiments were performed using the DSRR-inspired circular IDTs. In the first sensing experiment, different glucose concentrations (0–250 mg dl−1) were prepared and a 30 μl droplet of each concentration was placed in the central region of the IDTs. Next, the S11 spectra were obtained for each concentration sequentially and the experiment for each concentration was repeated at least five times to ensure the repeatability and reliability of the device. In the second sensing experiment, small glass containers with a capacity of 2 ml were utilised and filled with different materials including glucose powder, glucose solution, and dried yeast powder. The containers were placed on the gap region of the inner circles, and the S11 spectra were recorded for each bottle sequentially and each experiment was repeated at least five times. In the third sensing experiment, dried yeast powders were added to a solution of glucose and the fermentation process was monitored by observing the frequency response of the device for an hour. For the control experiment, 1 ml of DI water was added to the dried yeast inside the container and the same procedure was applied.
Simulations
We used commercially available electromagnetic simulation software (CST Studio Suite, Darmstadt, Germany) to model the structure and to obtain the scattering parameters and current density patterns at a specific resonant frequency. We used 3D Simulation, High Frequency settings with the time-domain solver of the simulator. The 3D geometry of the device was drawn using the built-in tools and the material properties were assigned using the built-in material library of the simulator. Planar waveguides were defined to excite the device and the boundary conditions in the simulation model were set so that the magnetic field was along the x-axis, the electric field was along the y-axis and the propagation vector was perpendicular to the plane of the device. A rectangular prism that includes the 3D geometry of the device was drawn to define the simulation boundaries. The ports determining the propagation vectors were defined on this prism. The scattering parameters were obtained based on these ports. We ran the simulations in a frequency range between 3 and 9 GHz, and analysed the results using the 1D and 2D/3D Results functionality of the simulator. The directions of the electric and magnetic fields used in the simulation are illustrated in the inset of Fig. 3 with respect to the device.Results and discussion
Acoustofluidic performance
We characterized the fabricated standard device by measuring the reflection signal (S11) obtained from the network analyser within the range of 0–14 MHz and the obtained result is shown in Fig. 1(a). Multiple peaks are observed in the S11 spectra of the device within the range from 8–13 MHz, which is attributed to the crystalline structure of lithium niobate. In lithium niobate substrates, due to the different crystal orientations, the speed of the acoustic wave is non-identical along various axes, thus leading to the generation of multiple peaks and modes of the acoustic resonance, which have been reported in our previously published paper.55 In addition, non-uniformities in the IDTs due to fabrication imperfections result in excitation of waves with resonant frequencies neighbouring the desired one.47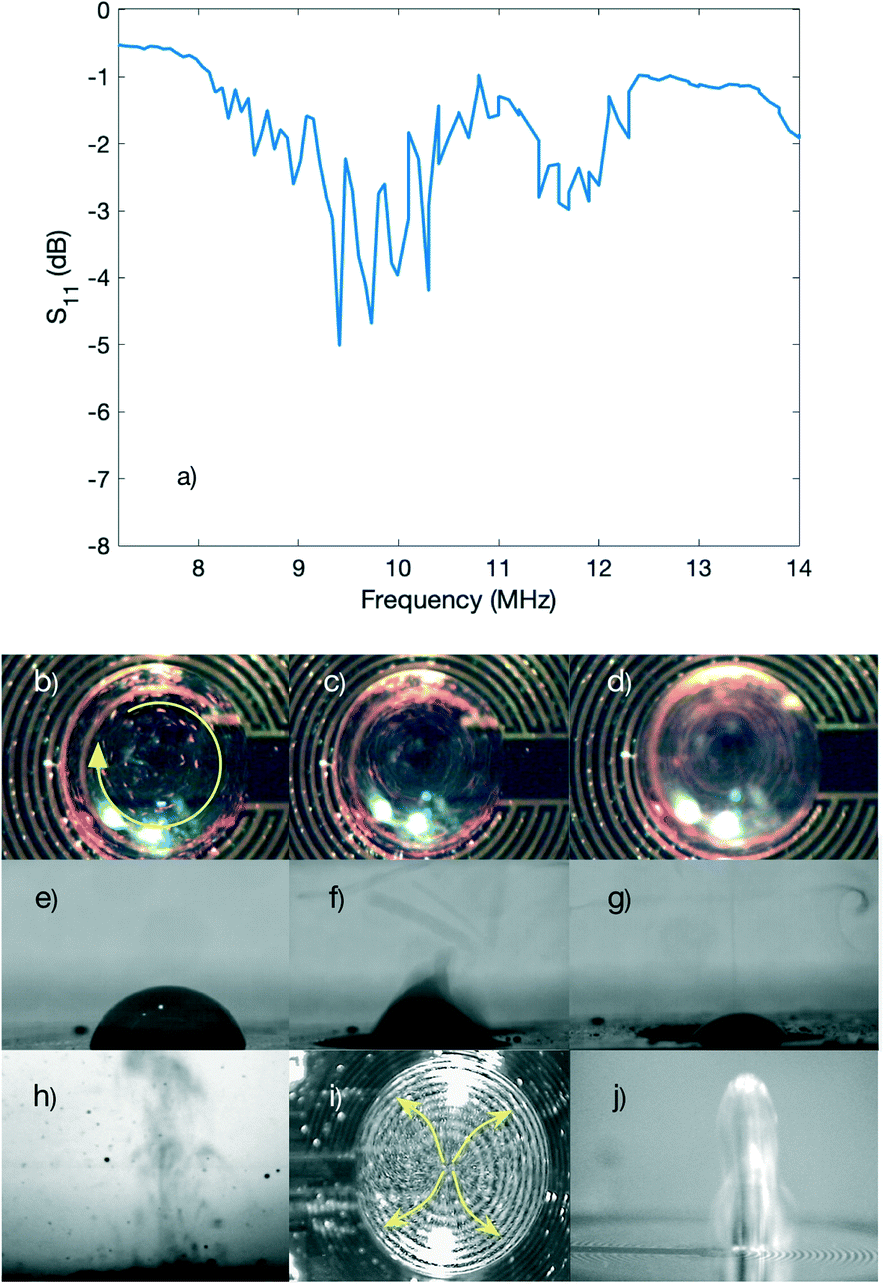 | ||
| Fig. 1 (a) S11 spectrum of the standard device with the circular IDT. Actuation capabilities of the standard device: (b–d) streaming of polystyrene particles inside of a DI water droplet for powers at 1.1–8.4 W, respectively, and under a superstrate condition. (e–g) Nebulisation of a DI water microdroplet with the applied power of 15 W and under a superstrate condition. (h) Atomisation of the DI water droplet on the untreated surface of the lithium niobate substrate at 7.2 W (i) streaming of polystyrene particles inside of a DI water droplet with the applied power of 0.5 W and (j) jetting of a DI water droplet at 5 W when the surface of the lithium niobate substrate is hydrophobic. | ||
By applying RF power to the electrodes of the fabricated device at its resonant frequencies, propagating SAWs along the surface can be generated. When these waves encounter a droplet along their path, some of the energy of the wave is leaked inside the droplet, and depending on the power applied, different phenomena can happen. In the experiments, we used a superstrate glass; therefore, the Lamb waves are generated and then they propagate through the glass slide through superstrate conditioning, thus leading to streaming inside of the droplet and nebulisation of the droplet at different powers. Fig. 1(b) to (d) show the streaming performance of the device by increasing the applied power from 1.1 W to 8.4 W, respectively, when a microdroplet consisting of polystyrene microbeads (5 μm in diameter) was placed on the surface of the glass. The achieved streaming was more pronounced when the applied power was higher as it can be seen by comparing Fig. 1(b) to (d).
When the applied power was further increased, the nebulisation of the water droplet was achieved when a power of 15 W was applied to the IDT electrode pads. The nebulisation process over time is shown in Fig. 1(e) to (g), respectively. Fig. 1(h) shows the higher magnification nebulisation behaviour of a 1 μl water droplet driven by an RF power of ∼7.2 W. We can clearly see that when the SAW energy is dissipated into the droplet, acoustic wave pressure drives the liquid droplet, thus resulting in the droplet vibration and strong capillary waves on the parent droplet surface. When the power is high, the amplitudes of the capillary waves increase significantly, and the capillary wave quickly becomes unstable, resulting in whipping, pinch-off and jetting of satellite droplets of about tens to hundreds of microns and formation of mist and satellite droplets as shown in Fig. 1(h).
Then, we treated the central region of the IDTs by drop-coating a hydrophobic layer of CYTOP to demonstrate the jetting effect. A 2 μl DI water droplet was placed at the centre of the IDTs and the applied power was set to 0.5 W and then to 5 W at 9.8 MHz. Streaming (Fig. 1(i)) and jetting (Fig. 1(j)) of the droplet were achieved at these powers, respectively, as the Rayleigh waves were leaked into the droplet.
Metamaterial-based characterisation and sensing
Depending on the excitation conditions and the directions of the electric and magnetic fields, the resonator behaves differently,56 and the nature of each excited resonant frequency in the device can be electric, magnetic, or a combination of electric and magnetic resonances. If a circulating current path is induced inside the device, the device exhibits a magnetic resonance and the resonant frequency is called a magnetic resonant frequency. The quality factor, Q, of the resonance in a structure can be calculated using a basic lumped resistor–inductor–capacitor (RLC) model, as reported in ref. 18, 22, 57.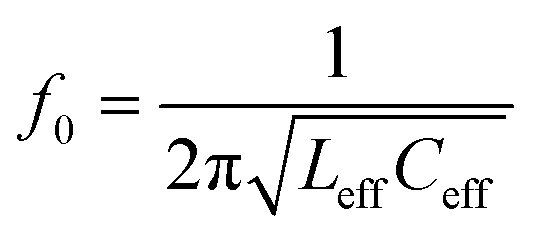 | (1) |
| Ceff = Csurface + Cgap | (2) |
 | (3) |
The CST simulation results of the standard circular IDTs compared to DSRR-based circular IDTs are depicted in Fig. 2. The boundary conditions that were applied in the modelling are explained in the Methods section and the schematic of the device relative to the directions of the electric and magnetic fields is illustrated in the inset of Fig. 2. The results show that although only one pair of IDTs would be enough for generating acoustic waves on the surface of the device, an additional set of IDTs lowers the fundamental magnetic resonance of the device for sensing applications as expected without the need of increasing the diameter of the rings. The fundamental resonant frequency of the standard circular IDT design is at ∼8.1 GHz, whereas the fundamental resonant frequency of the DSRR-based design is ∼3.8 GHz.
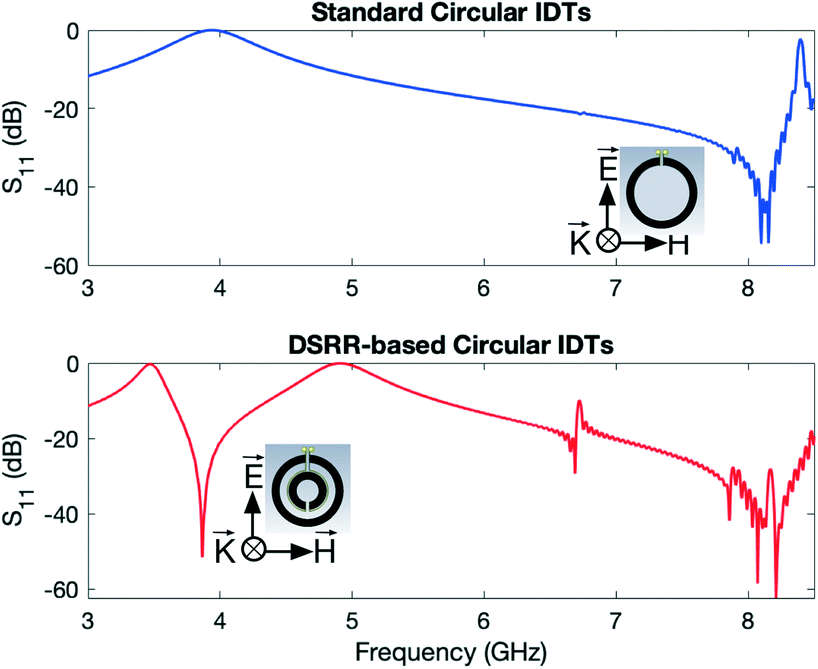 | ||
| Fig. 2 Simulation results of the standard circular IDTs and DSRR-inspired geometry. | ||
The simulation results presented in Fig. 2 confirm that the DSRR-inspired geometry is used to set the magnetic resonant frequency of the device below 4 GHz so that it can be measured effectively using a simpler setup. A more conventional alternative would be increasing the diameter of the device at the expense of increased footprint that exposes the device more to the environmental factors. Also, when used for molecular sensing applications, increasing the size of the device usually decreases its sensitivity since the ratio of the molecular interaction area to the overall device area decreases. For these reasons, we have selected the DSRR-shape design to perform the electromagnetic characterisation and the sensing experiments. The results are reported in the next section.
Fig. 3 shows the electromagnetic properties of the DSRR-inspired design obtained through simulations and experiments under the same boundary conditions. The directions of the electric and magnetic fields used in the simulations are illustrated in the inset of Fig. 3(a) with respect to the device. In this case, the electric field polarizes the device in the y-direction and supports two circulating current paths on the right and left sides of the ring with respect to the contact pads depicted in the figure inset, resulting in a resonant frequency of 3.68 GHz. In the next step, we placed a cone-shape structure to model a droplet inside the inner circle of the device with varying electric permittivity to investigate the effects of changing the dielectric constant of the medium in the vicinity of the device. In one setting, the relative permittivity was set (εr = 1) to mimic a vacuum, and in the other setting, the permittivity was set to εr = 80 to model the water droplet. The reflection scattering parameters for both cases are presented in Fig. 3(a). For a higher dielectric constant (εr = 80) of the material of the droplet, the resonant frequency is shifted 11 MHz towards higher frequencies. This shift is due to the presence of additional dielectric load that alters the distribution of the circulating current along the surface of the device. We also extracted the current density patterns that are induced in the device in both cases for a better understanding of the behaviour of the device. The results are depicted in Fig. 3(c and d). The intensity of the circulating current is higher around the inner loop in the case of εr = 80, leading to an electrically smaller path. Thus, the electrical parameters are smaller, and the resonant frequency is larger. This phenomenon explains a lower magnetic resonant frequency of vacuum compared to the case where a water droplet is present in the centre of the structure.
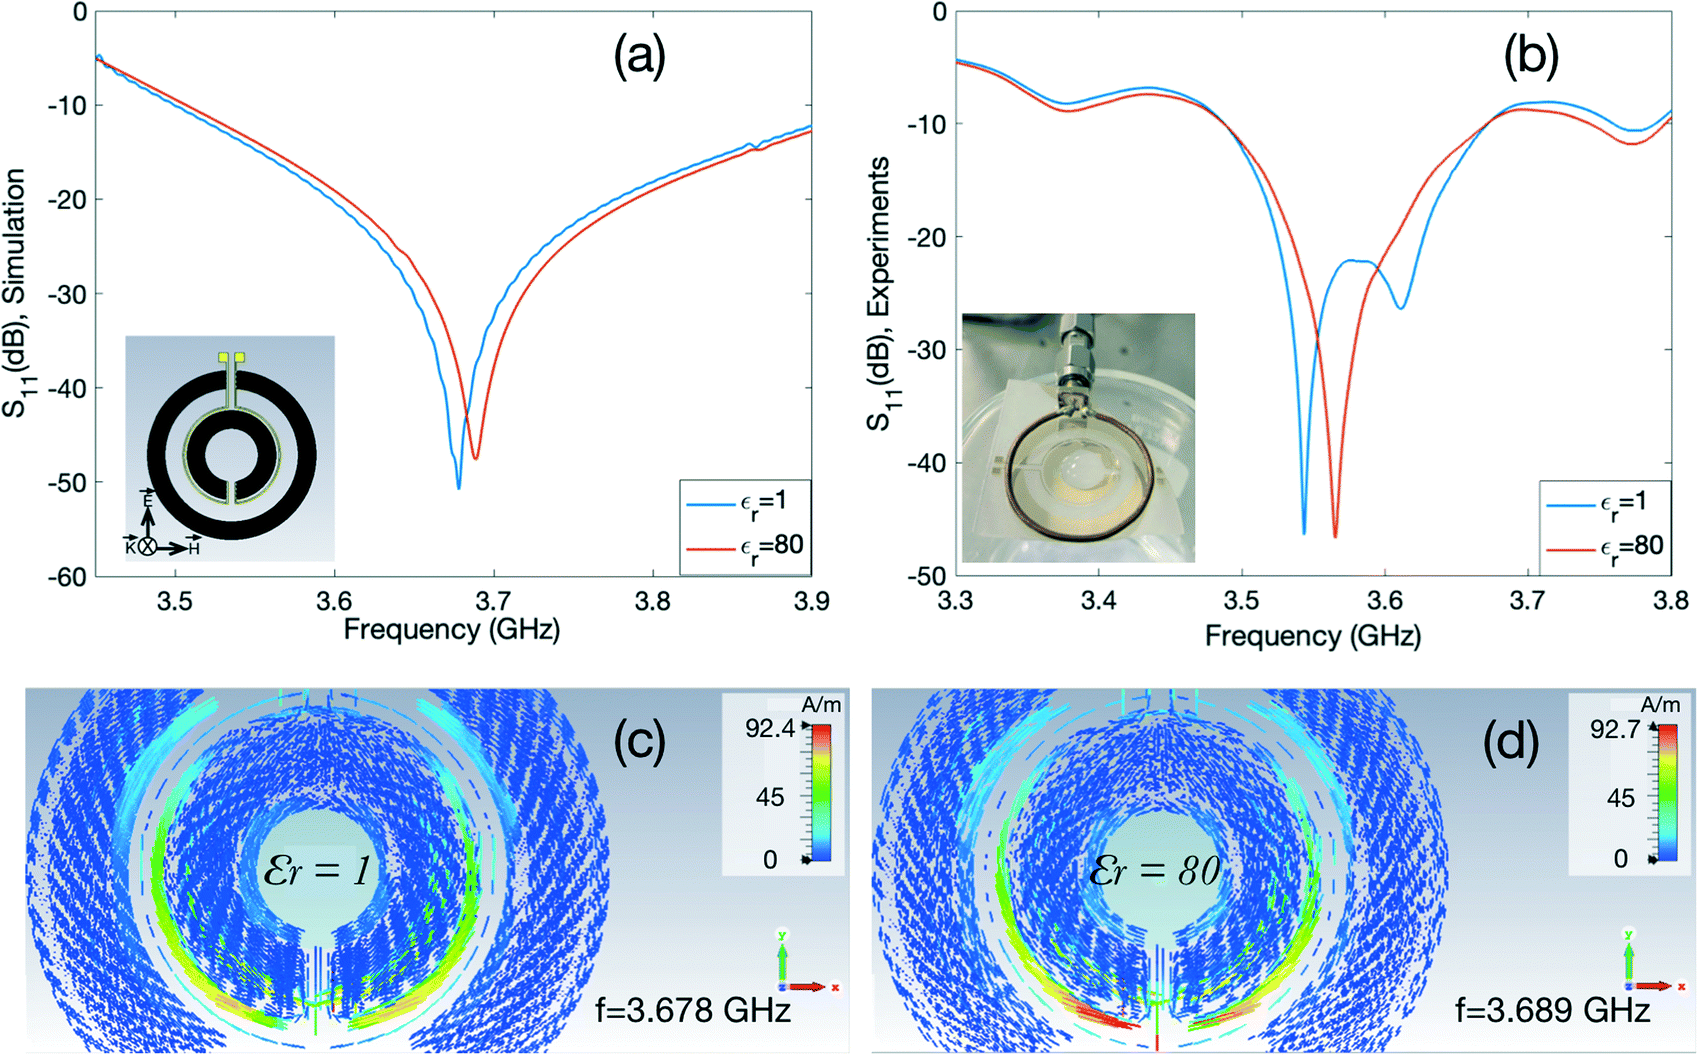 | ||
| Fig. 3 Simulation and experimental characterisation of the fabricated DSRR-inspired device. (a) Simulated reflection (S11) spectra of the device where the magnetic field is along the x-axis, the electric field is along the y-axis and the propagation vector is perpendicular to the plane of the device when a water droplet is defined inside the inner circle with εr = 1 (blue), and with εr = 80 (red). (b) Measured S11 spectra of the device in the absence (εr = 1) and presence (εr = 80) of 30 μl of DI droplet. The simulated current density patterns are shown (c) at 3.678 GHz for εr = 1 and (d) at 3.689 GHz for εr = 80. | ||
We performed experiments to confirm our simulation results in the next phase. We used a copper loop antenna and connected it to one port of the VNA. The electromagnetic wave is fluctuated around the antenna and the direction and strength of the electric and magnetic fields vary spatially and temporally with respect to the antenna position. The direction of the electric and magnetic fields can excite the device differently, thus leading to a distinct resonant behaviour.56,58
We placed the fabricated resonator underneath the loop antenna to couple with each other as shown in the inset of Fig. 3(b). After measuring the reflection parameters of the coupled system, we added a water droplet at the centre of the inner circle and measured the S11 spectrum again. The experimental characterisation results are summarised in Fig. 3(b). The resonant frequency of the device shifts towards higher frequencies (∼21 MHz) with the presence of a DI water droplet as predicted by the simulations. The slight discrepancies between simulations and experiments are attributed to several factors. One of them being the use of the loop antenna in the experimental setup, whereas planar boundaries were used in simulations to excite the resonator. Also, in simulations, the ideal environment is considered for ease of use. In addition, there may be slight differences between the material properties loaded from the simulator library and the actual experimental setting.
Glucose sensing
We investigated the sensing capability of the fabricated DSSR-inspired device by only altering the dielectric constant of the medium. For this purpose, we selected the inner circle area of the resonator for the location of the droplets with different permittivity values, the same as in the experimental characterisation measurements. Furthermore, we placed a PDMS chamber that holds a 30 μl droplet to precisely control the location of the droplet on the device as shown in Fig. 4(a). As a case study, we prepared various glucose concentrations ranging from 0 to 250 mg dl−1. We first captured the frequency of the device (f0) without the presence of any droplet. In the next step, we added a 30 μl droplet of each concentration (fconcentration) into the PDMS chamber on the sensing area and recorded the resonant frequency of the system. We then calculated the difference in the resonant frequency (Δf = fconcentration − f0) for each case per concentration and cleaned the PDMS chamber in between the subsequent measurements to prevent contamination. Increasing the glucose concentration decreases the relative permittivity,59 and therefore, reduces the effective capacitance. This translates to a higher resonant frequency of the device for the liquids with a higher concentration. Our measurements verify this as shown in Fig. 4(b).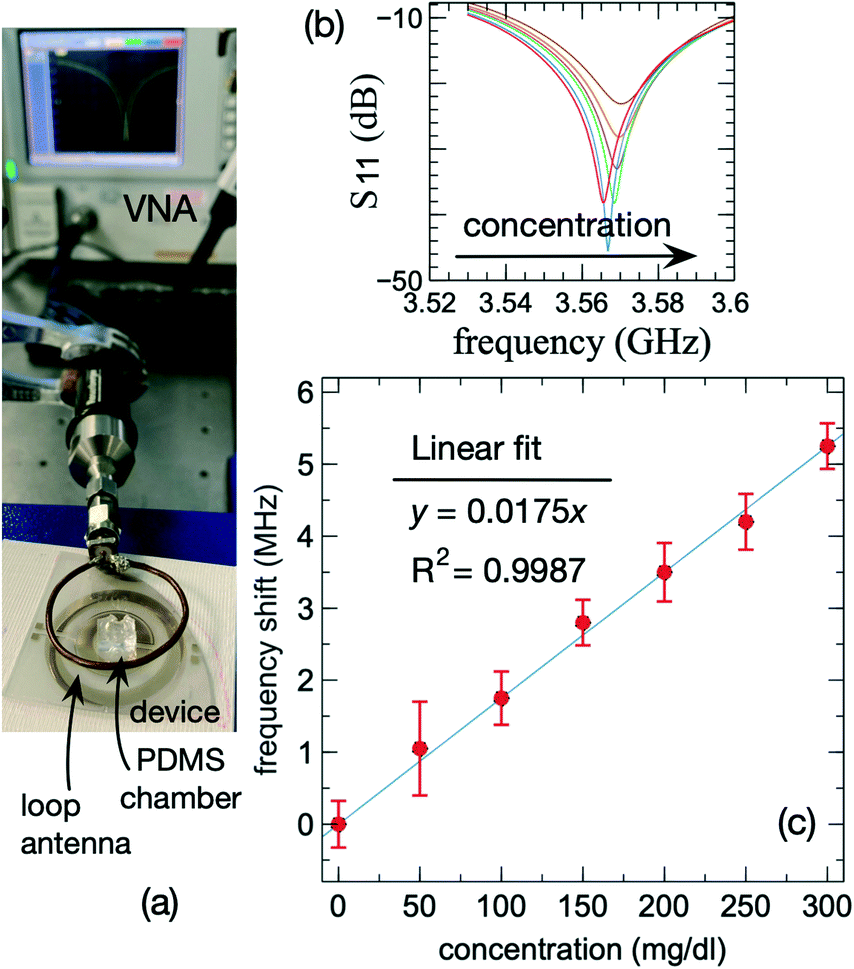 | ||
| Fig. 4 (a) Experimental setup for the measurement for glucose sensing; (b) the resonant frequency increases with concentration; (c) the shift in resonant frequency can be detected linearly within the measurement range. | ||
The average Δf values versus different concentrations of glucose are plotted in Fig. 4(c), and the error bars represent the standard deviation of the shift in frequency based on ten different measurements for each concentration. The resonant frequency of the device increases linearly within the measurement range with a sensitivity of 17.5 kHz mg−1 dl−1, which is the slope of the fitted line to the data. Based on the presented experimental data and considering the standard deviation of the obtained results, the device can detect the changes in the glucose concentration with a resolution of 23 mg dl−1 or 1.28 mmol l−1. The device exhibits excellent linearity at least to a concentration of 300 mg dl−1.
Dielectric material characterisation
In these experiments, we investigated the influence of various materials on the operating frequency of the resonator. We started the experiment by fixing the position of the device with regards to the loop antenna, where there is an apparent magnetic frequency with a high-quality factor and then we recorded the data. As the simulation results can be a guide towards selecting the most sensitive location of the electromagnetic frequency of the device, we referred to the simulation results to decide the most suitable location on the device for this round of experiments. As can be seen from the simulation results in Fig. 3(c and d), the current density is more prominent around the outer edges of the gap of the inner circular IDTs. Therefore, to investigate the effects of different substances on the resonant frequency of the device, we chose a container with a capacity of 2 ml, which covered the area around the gap when it was placed properly on the device.We first obtained the S11 spectra of the device when the container was empty. For the next steps, we used identical containers that were filled with 0.1 g of dried yeast, 0.1 g of glucose powder, glucose solution with a concentration of 0.1 g ml−1, and 1 ml of water. We repeated the experiment by placing each specific container on the exact position on the gap of the inner circular IDTs and recorded the data. The obtained results are plotted in Fig. 5(a). The dielectric properties of the measured materials are summarised in Table 1.
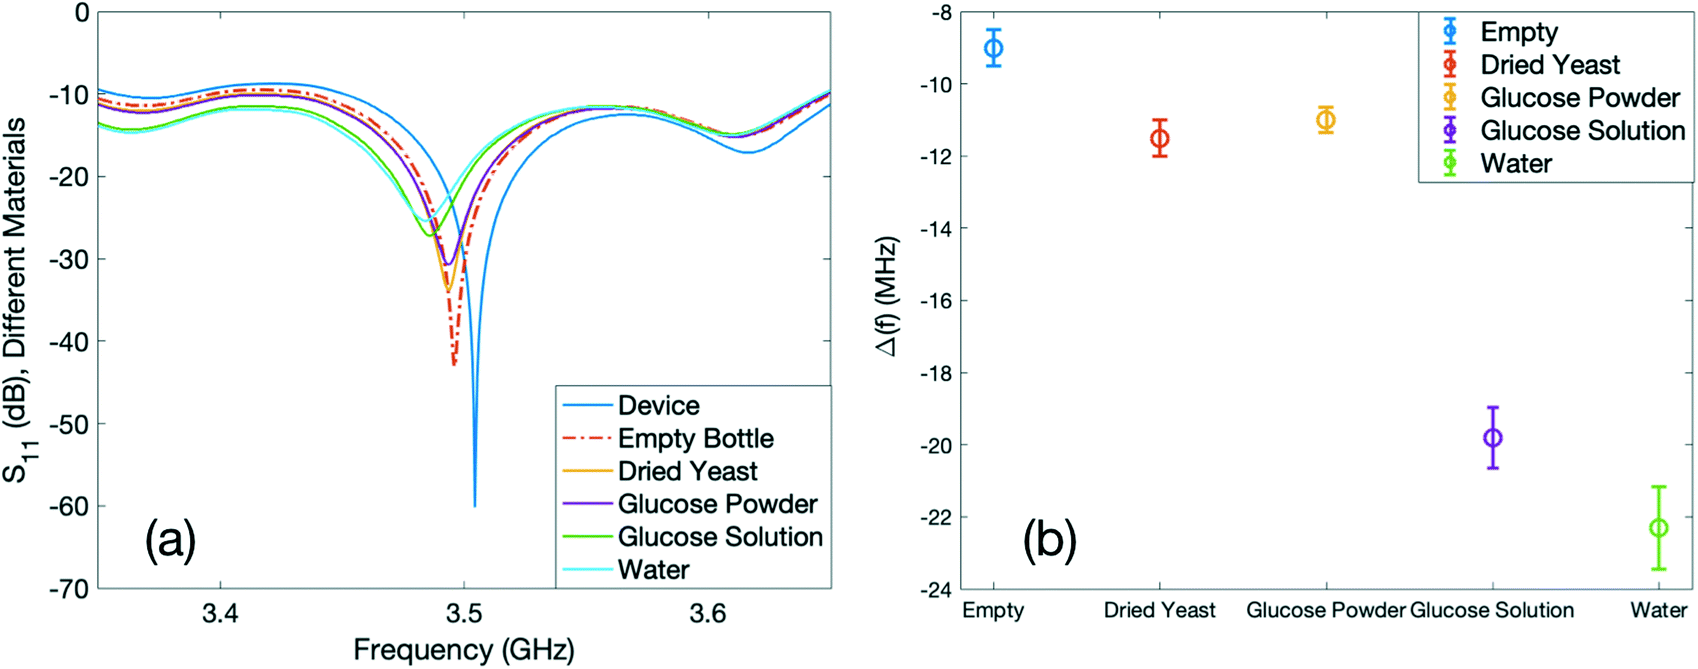 | ||
| Fig. 5 Effects of different materials inside the container on the frequency of the device. (a) S11 spectra of the materials that were used in the experiment. (b) Measured shifts in the resonant frequency with and without the container for different materials. | ||
| Material | Relative permittivity | Average resonant frequency shift (MHz) | Standard deviation (MHz) |
|---|---|---|---|
| Water | 80 | −22.31 | 1.15 |
| Glucose solution | 76 | −19.81 | 0.84 |
| Glucose powder | 3–4 | −11 | 0.35 |
| Dried yeast | 2 | −11.5 | 0.5 |
| Air | 1 | −9 | 0.5 |
The frequency of the device (f0), when there is no container placed on top of it, is 3.5 GHz. By utilising the glass container together with different materials, the dielectric constant of the area around the resonator is altered and increased compared to the case when there is no container. This results in a change in the effective capacitance of the sensor. Increasing the dielectric constant results in the increased effective capacitance, and therefore, the decreased resonant frequency. Among the materials inside the container, air (empty glass container) has the lowest relative permittivity (εr = 1) and water has the highest value (εr = 80). The relative permittivity of the dried yeast powder and glucose powder are 2 and 3–4 (ref. 60), respectively, and the relative permittivity of the glucose solution is ∼76,59 which is slightly lower than that of the DI water. Hence, it is expected that among these materials, water would have the lowest frequency, whereas the empty bottle would exhibit the highest frequency. The shift in resonant frequency (Δf) with each container with respect to the resonance of the device (f0) was calculated and the results are summarised in Fig. 5(b). The points in Fig. 5(b) represent the average shift in the resonant frequency of the device in the presence of an external substance for all the repeated experiments for each container. The error bars represent the standard deviations of the obtained shift in the frequency for each set of experiments per container repeated at least five times. The average shifts of the resonance per container for the empty bottle, dried yeast, glucose powder, glucose solution and water with respect to the operating frequency of the device are 9, 11.5, 11, 19.81, and 22.31 MHz, respectively, towards lower frequencies.
Monitoring of the yeast fermentation process
In the final experiments, we monitored the fermentation process of the yeast, and the results are shown in Fig. 6. Fermentation is a natural process in which a microorganism consumes carbohydrates such as glucose and produces alcohol or acid. The fermentation process of the yeast can be written as below:61| C6H12O6 (glucose) → 2C2H5OH (ethanol) + 2CO2 (carbon dioxide) |
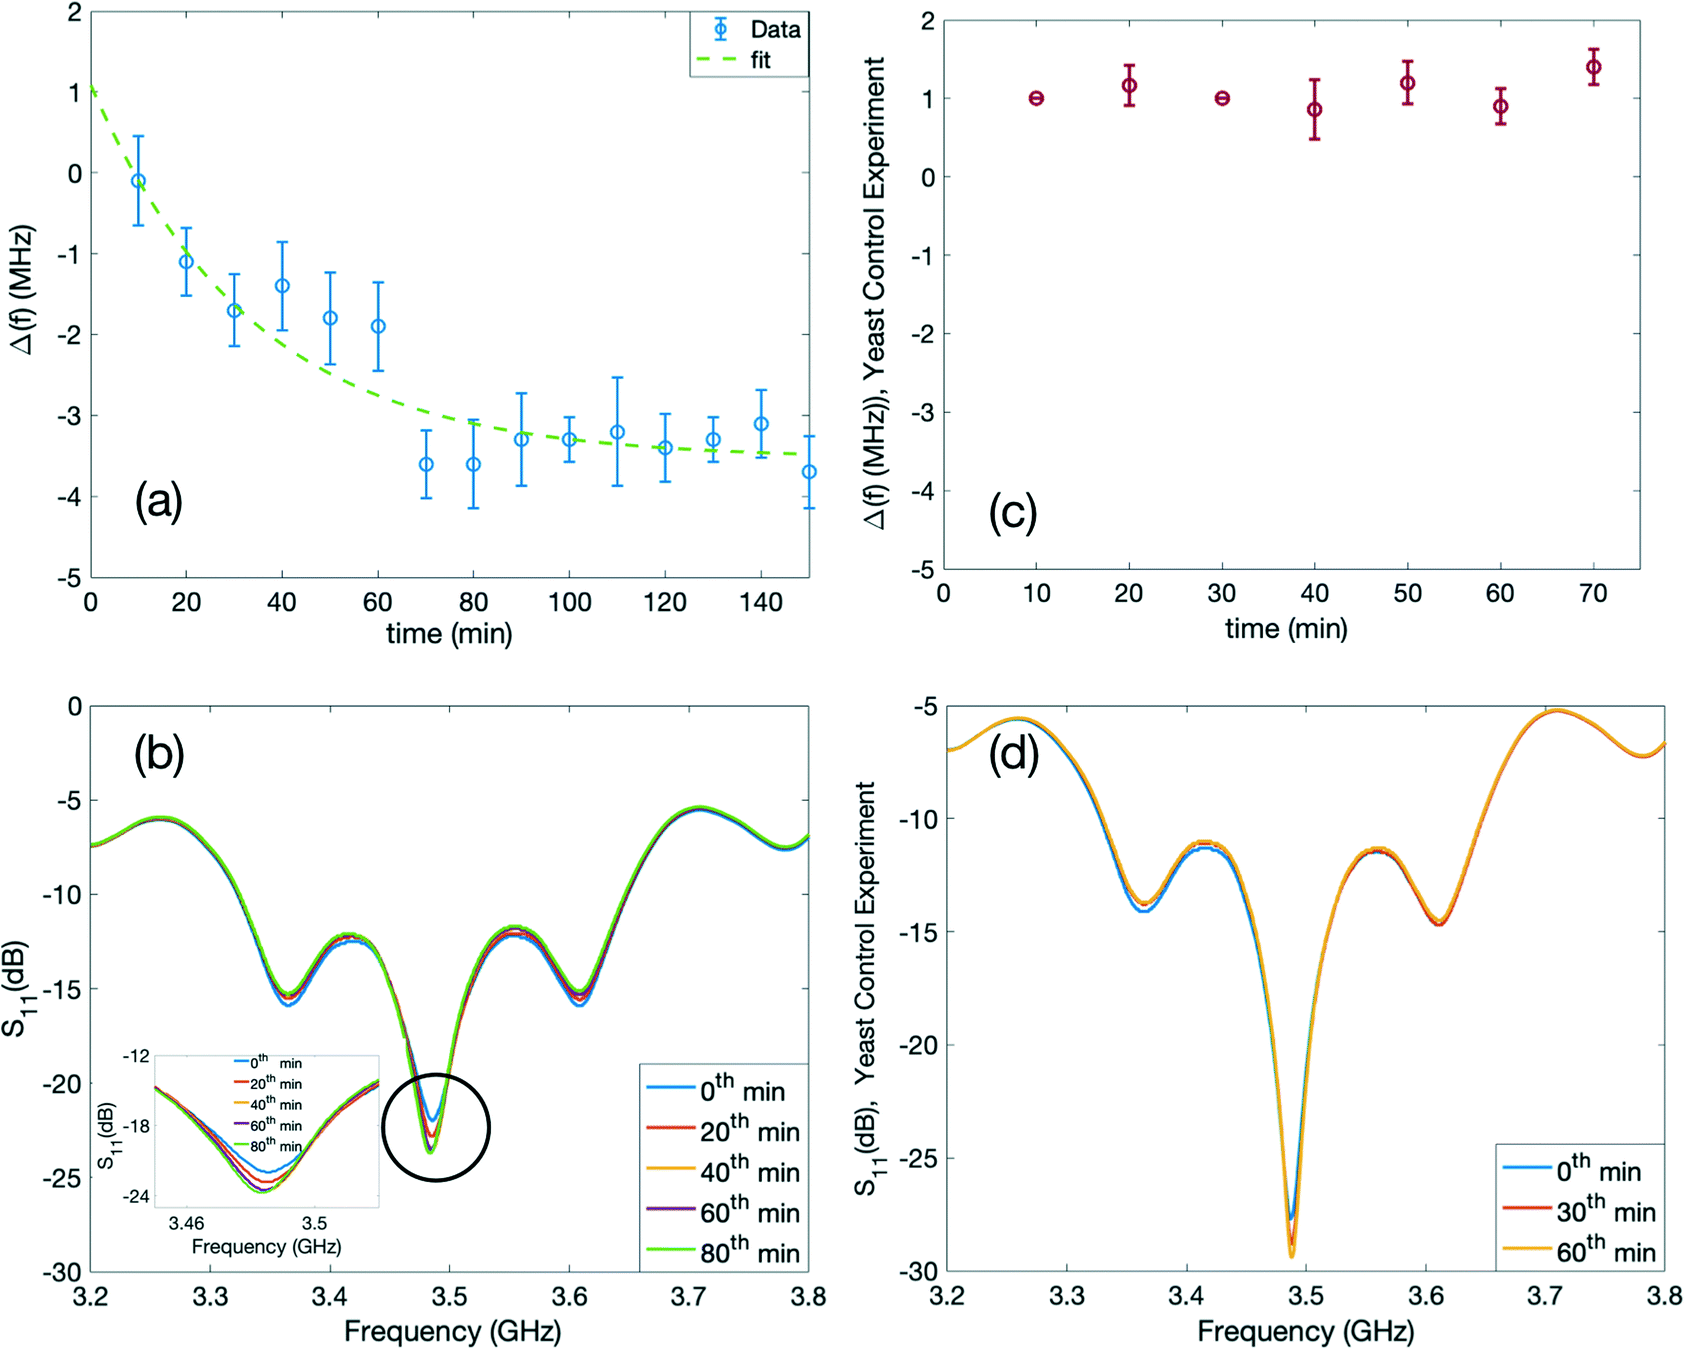 | ||
| Fig. 6 Yeast fermentation process and yeast control experiment. (a) Measured shift in the resonant frequency of the system over time. (b) S11 spectra of various intervals of time in the fermentation process, including an inset representing a narrower range of frequency in the reflection spectra of the system. (c) Measured shift in the resonant frequency of the control experiment and (d) reflection spectra of different intervals of time for the control experiment. | ||
For our experiment, we prepared a solution of glucose with a concentration of 0.1 g ml−1. In the next step, we added 0.1 g of dried yeast on top of this solution. Afterwards, we placed the container to the specified location in the previous experiment, covering the gap of the inner circular IDTs of the resonator for a duration of 140 minutes, and the S11 spectra were recorded every 10 minutes. The S11 spectra are presented in Fig. 6(b). A narrower range in the x-axis of the S11 spectra is also selected to illustrate the shift more clearly and is presented as an inset in Fig. 6(b). After positioning the container, we noted the initial resonant frequency before the process as the reference frequency of the system. We observed that during this experiment, the resonant frequency shifted towards lower frequencies and stabilized after about an hour. The results of the shift in frequency over time are plotted in Fig. 6(a). During the monitoring duration, the glucose concentration in the solution decreases; therefore, the relative permittivity increases around the sensor. At the same time, ethanol is produced which has higher relative permittivity compared to air and the same principle applies.27,62 The fermentation reaction leads to an increase in the effective capacitance of the device and as a result, to a lower resonant frequency. Also, by the accumulation of ethanol over time, the fermentation will be ceased, thus leading to the stabilization of the resonant frequency change, Δf, following an exponential decay in time, t:
| Δf = 4.618 × e−0.02965t − 3.533 | (4) |
Conclusions
In this paper, we investigated a new idea for the integrated acoustofluidics and metamaterial sensing capabilities of circular IDT designs. We reported multiple acoustofluidic functionalities, e.g., streaming, mixing, and nebulisation, through a superstrate and direct conditions utilising a standard circular IDT design fabricated on a LiNbO3 substrate. We further optimised our design, inspired by a double split-ring resonator geometry to employ it for electromagnetic metamaterial-based sensing. The optimised design allows the electromagnetic resonance to be tailored to the desired frequency range while keeping the footprint of the actuator device small. This method can be used to design resonators with specific resonant frequencies. We demonstrated our design in various sensing experiments i.e., glucose concentration sensing in a physiological range by placing microdroplets in the centre region of the fabricated device and dielectric material characterisation inside a glass container placed on the gap region of the inner circular IDTs. As a case study, we monitored the fermentation process of yeast cells inside a glass container. The introduced design enables wireless sensing capability without a need for an electrical connection to the device. Moreover, an array of devices can be used simultaneously for multiple target detection. These sensing capabilities together with the actuation capability demonstrate that the structure has potential to be employed and integrated in LoC and PoC systems as an integrated sensing and actuation platform. The device architecture can be used in different configurations of actuation, sensing or both.Author contributions
HT and YQF conceptualised and supervised this project and also provided funding acquisition. SZ, RT, PCP and HT performed the experimental work. SZ performed the simulations. JL and QW contributed to the investigation and development of the methodology. The original manuscript was prepared by SZ, HT and YQF. All the authors reviewed and edited the manuscript.Conflicts of interest
There are no conflicts to declare.Acknowledgements
This work was financially supported by the UK Engineering and Physical Sciences Research Council (EPSRC) grants EP/P018998/1, the Special Interests Group of Acoustofluidics under the EPSRC-funded UK Fluidic Network (EP/N032861/1), and the EPSRC NetworkPlus in Digitalised Surface Manufacturing EP/S036180/1.References
- G. Aroganam, N. Manivannan and D. Harrison, Sensors, 2019, 19, 1983 CrossRef PubMed.
- G. Gresham, A. E. Hendifar, B. Spiegel, E. Neeman, R. Tuli, B. J. Rimel, R. A. Figlin, C. L. Meinert, S. Piantadosi and A. M. Shinde, NPJ Digit. Med., 2018, 1, 1–8 CrossRef PubMed.
- K. Bayoumy, M. Gaber, A. Elshafeey, O. Mhaimeed, E. H. Dineen, F. A. Marvel, S. S. Martin, E. D. Muse, M. P. Turakhia and K. G. Tarakji, Nat. Rev. Cardiol., 2021, 1–19 Search PubMed.
- G. Shin, M. H. Jarrahi, Y. Fei, A. Karami, N. Gafinowitz, A. Byun and X. Lu, J. Biomed. Inf., 2019, 93, 103153 CrossRef PubMed.
- K. R. Evenson, M. M. Goto and R. D. Furberg, Int. J. Behav. Nutr. Phys. Act., 2015, 12, 1–22 CrossRef PubMed.
- D. C. Christodouleas, B. Kaur and P. Chorti, ACS Cent. Sci., 2018, 4, 1600–1616 CrossRef CAS PubMed.
- M. Al-Khafajiy, T. Baker, C. Chalmers, M. Asim, H. Kolivand, M. Fahim and A. Waraich, Multimed. Tools. Appl., 2019, 78, 24681–24706 CrossRef.
- Y. Ai, F. Zhang, C. Wang, R. Xie and Q. Liang, TrAC, Trends Anal. Chem., 2019, 117, 215–230 CrossRef CAS.
- S. Beverung, J. Wu and R. Steward, Micromachines, 2020, 11, 898 CrossRef PubMed.
- P. Giménez-Gómez, R. Rodríguez-Rodríguez, J. M. Ríos, M. Pérez-Montero, E. González, M. Gutiérrez-Capitán, J. A. Plaza, X. Muñoz-Berbel and C. Jiménez-Jorquera, Lab Chip, 2020, 20, 823–833 RSC.
- S. K. Vashist, P. B. Luppa, L. Y. Yeo, A. Ozcan and J. H. T. Luong, Trends Biotechnol., 2015, 33, 692–705 CrossRef CAS PubMed.
- N. Khalid, I. Kobayashi and M. Nakajima, Wiley Interdiscip. Rev. Syst. Biol. Med., 2017, 9, e1381 Search PubMed.
- L. R. Volpatti and A. K. Yetisen, Trends Biotechnol., 2014, 32, 347–350 CrossRef CAS PubMed.
- S. Mukherji and D. Mondal, in Medical Biosensors for Point of Care (POC) Applications, ed. R. J. Narayan, Woodhead Publishing, 2017, pp. 99–131 Search PubMed.
- G. Xu, Q. Zhang, Y. Lu, L. Liu, D. Ji, S. Li and Q. Liu, Sens. Actuators, B, 2017, 246, 748–755 CrossRef CAS.
- Y. Song, J. Min, Y. Yu, H. Wang, Y. Yang, H. Zhang and W. Gao, Sci. Adv., 2020, 6, eaay9842 CrossRef CAS PubMed.
- W. Withayachumnankul, K. Jaruwongrungsee, A. Tuantranont, C. Fumeaux and D. Abbott, Sens. Actuators, A, 2013, 189, 233–237 CrossRef CAS.
- H. Torun, F. Cagri Top, G. Dundar and A. D. Yalcinkaya, J. Appl. Phys., 2014, 116, 124701 CrossRef.
- A. Pusovnik, J. Aplinc and M. Ravnik, Sci. Rep., 2019, 9, 7025 CrossRef PubMed.
- K. Fan and W. J. Padilla, Mater. Today, 2015, 18, 39–50 CrossRef CAS.
- N. I. Zheludev and E. Plum, Nat. Nanotechnol., 2016, 11, 16 CrossRef CAS PubMed.
- O. Sydoruk, E. Tatartschuk, E. Shamonina and L. Solymar, J. Appl. Phys., 2009, 105, 014903 CrossRef.
- K. Jaruwongrungsee, U. Waiwijit, W. Withayachumnankul, T. Maturos, D. Phokaratkul, A. Tuantranont, W. Wlodarski, A. Martucci and A. Wisitsoraat, Procedia Eng., 2015, 120, 163–166 CrossRef CAS.
- G. Ekinci, A. D. Yalcinkaya, G. Dundar and H. Torun, in Journal of Physics: Conference Series, IOP Publishing, 2016, vol. 757, p. 012019 Search PubMed.
- H.-J. Lee and J.-G. Yook, Appl. Phys. Lett., 2008, 92, 254103 CrossRef.
- H.-J. Lee, J.-H. Lee, H.-S. Moon, I.-S. Jang, J.-S. Choi, J.-G. Yook and H.-I. Jung, Sens. Actuators, B, 2012, 169, 26–31 CrossRef CAS.
- S. Zahertar, E. Laurin, L. E. Dodd and H. Torun, IEEE Sens. J., 2020, 20, 2434–2439 CAS.
- A. Salim and S. Lim, Sensors, 2016, 16, 1802 CrossRef PubMed.
- A. Salim, S. Ghosh and S. Lim, Sensors, 2018, 18, 3049 CrossRef PubMed.
- A. Vivek, K. Shambavi and Z. C. Alex, Sens. Rev., 2019, 39, 417–432 CrossRef.
- M. H. Zarifi, M. Rahimi, M. Daneshmand and T. Thundat, Sens. Actuators, B, 2016, 224, 632–639 CrossRef CAS.
- H. Kairm, D. Delfin, M. A. I. Shuvo, L. A. Chavez, C. R. Garcia, J. H. Barton, S. M. Gaytan, M. A. Cadena, R. C. Rumpf and R. B. Wicker, IEEE Sens. J., 2014, 15, 1445–1452 Search PubMed.
- R. A. Alahnomi, Z. Zakaria, E. Ruslan, A. A. Mohd Bahar and S. R. Ab Rashid, Microw. Opt. Technol. Lett., 2016, 58, 2106–2110 CrossRef.
- H. Tao, M. A. Brenckle, M. Yang, J. Zhang, M. Liu, S. M. Siebert, R. D. Averitt, M. S. Mannoor, M. C. McAlpine and J. A. Rogers, Adv. Mater., 2012, 24, 1067–1072 CrossRef CAS PubMed.
- S. Xiao, T. Wang, T. Liu, X. Yan, Z. Li and C. Xu, Carbon, 2018, 126, 271–278 CrossRef CAS.
- W. Tang, L. Wang, X. Chen, C. Liu, A. Yu and W. Lu, Nanoscale, 2016, 8, 15196–15204 RSC.
- N. Zhang, J. P. Zuniga-Hertz, E. Y. Zhang, T. Gopesh, M. J. Fannon, J. Wang, Y. Wen, H. H. Patel and J. Friend, Lab Chip, 2021, 21, 904–915 RSC.
- J. Zhou, X. Tao, J. Luo, Y. Li, H. Jin, S. Dong, J. Luo, H. Duan and Y. Fu, Surf. Coat. Technol., 2019, 367, 127–134 CrossRef CAS.
- H. Ahmed, J. Park, G. Destgeer, M. Afzal and H. J. Sung, Appl. Phys. Lett., 2019, 114, 043702 CrossRef.
- M. Baudoin, P. Brunet, O. Bou Matar and E. Herth, Appl. Phys. Lett., 2012, 100, 154102 CrossRef.
- Y. Q. Fu, J. K. Luo, N. T. Nguyen, A. J. Walton, A. J. Flewitt, X. T. Zu, Y. Li, G. McHale, A. Matthews, E. Iborra, H. Du and W. I. Milne, Prog. Mater. Sci., 2017, 89, 31–91 CrossRef CAS.
- Y. Tang, W. Wu, B. Wang, X. Dai, W. Xie, Y. Yang, R. Zhang, X. Shi, H. Zhu and J. Luo, Sens. Actuators, B, 2020, 325, 128742 CrossRef CAS.
- Y. J. Guo, G. D. Long, Y. L. Tang, J. L. Wang, Q. B. Tang, X. T. Zu, J. Y. Ma, B. Du, H. Torun and Y. Q. Fu, Smart Mater. Struct., 2020, 29, 095003 CrossRef CAS.
- J. L. Wang, Y. J. Guo, G. D. Long, Y. L. Tang, Q. B. Tang, X.-T. Zu, J. Y. Ma, B. Du, H. Torun and Y. Q. Fu, J. Hazard. Mater., 2020, 388, 121743 CrossRef CAS PubMed.
- Y. Tang, X. Xu, S. Han, C. Cai, H. Du, H. Zhu, X. Zu and Y. Fu, Sens. Actuators, B, 2020, 304, 127395 CrossRef CAS.
- Q. B. Tang, Y. J. Guo, Y. L. Tang, G. D. Long, J. L. Wang, D. J. Li, X.-T. Zu, J. Y. Ma, L. Wang, H. Torun and Y. Q. Fu, J. Mater. Sci., 2019, 54, 11925–11935 CrossRef CAS.
- W. Li, Y. J. Guo, Q. B. Tang, X. T. Zu, J. Y. Ma, L. Wang, K. Tao, H. Torun and Y. Q. Fu, Surf. Coat. Technol., 2019, 363, 419–425 CrossRef CAS.
- X. Ding, P. Li, S.-C. S. Lin, Z. S. Stratton, N. Nama, F. Guo, D. Slotcavage, X. Mao, J. Shi and F. Costanzo, Lab Chip, 2013, 13, 3626–3649 RSC.
- S. Zahertar, Y. Wang, R. Tao, J. Xie, Y. Q. Fu and H. Torun, J. Phys. D: Appl. Phys., 2019, 52, 485004 CrossRef CAS.
- R. Tao, S. Zahertar, H. Torun, Y. R. Liu, M. Wang, Y. Lu, J. T. Luo, J. Vernon, R. Binns, Y. He, K. Tao, Q. Wu, H. L. Chang and Y. Q. Fu, ACS Sens., 2020, 5, 2563–2569 CrossRef CAS PubMed.
- M. K. Tan, J. R. Friend and L. Y. Yeo, Phys. Rev. Lett., 2009, 103, 024501 CrossRef PubMed.
- R. Shilton, M. K. Tan, L. Y. Yeo and J. R. Friend, J. Appl. Phys., 2008, 104, 014910 CrossRef.
- H. Zhang, Y.-Q. Li, X. Chen, Y.-Q. Fu and N.-C. Yuan, IEEE Trans. Antennas Propag., 2009, 57, 3352–3355 Search PubMed.
- B. Sauviac, C. R. Simovski and S. A. Tretyakov, Electromagnetics, 2004, 24, 317–338 CrossRef.
- M. Jangi, J. T. Luo, R. Tao, J. Reboud, R. Wilson, J. M. Cooper, D. Gibson and Y. Q. Fu, Int. J. Multiphase Flow, 2019, 114, 1–8 CrossRef CAS.
- S. Zahertar, A. D. Yalcinkaya and H. Torun, AIP Adv., 2015, 5, 117220 CrossRef.
- R. C. Dorf, The Electrical Engineering Handbook-Six Volume Set, CRC press, 2018 Search PubMed.
- S. Zahertar, J. Wu, G. Chatzipirpiridis, O. Ergeneman, P. Canyelles-Pericas, R. Tao, Y. Q. Fu and H. Torun, in 2020 IEEE International Conference on Flexible and Printable Sensors and Systems (FLEPS), IEEE, 2020, pp. 1–4 Search PubMed.
- V. Turgul and I. Kale, in 2016 IEEE International Instrumentation and Measurement Technology Conference Proceedings, IEEE, 2016, pp. 1–5 Search PubMed.
- Yamaden, Table of dielectric constants of substances | Level meters and level switches by Yamaden, http://www.ydic.co.jp/english/technology/table_E.html, (accessed 16 January 2021).
- S. Maicas, Microorganisms, 2020, 8, 1142 CrossRef CAS PubMed.
- I. Smallwood, Handbook of organic solvent properties, Butterworth-Heinemann, 2012 Search PubMed.
| This journal is © The Royal Society of Chemistry 2022 |