 Open Access Article
A domino-like localized cascade toehold assembly amplification-based DNA nanowire for microRNA imaging in living cells†
Zizhong
Yang
a,
Birong
Liu
a,
Ting
Huang
a,
Mengxu
Sun
a,
Tong li
a,
Wen-Jun
Duan
 a,
Min-Min
Li
c,
Jin-Xiang
Chen
*a,
Zong
Dai
 b and
Jun
Chen
 *a
*a
aNMPA Key Laboratory for Research and Evaluation of Drug Metabolism, Guangdong Provincial Key Laboratory of New Drug Screening, School of Pharmaceutical Sciences, Southern Medical University, Guangzhou, 510515, P. R. China. E-mail: chenj258@smu.edu.cn
bGuangdong Provincial Key Laboratory of Sensing Technology and Biomedical Instrument, School of Biomedical Engineering, Sun Yat-Sen University, Shenzhen 518107, P. R. China
cCenter of Clinical Laboratory, The First Affiliated Hospital of Jinan University, Guangzhou 510632, P.R. China
First published on 23rd November 2022
Abstract
High sensitivity and specificity imaging of miRNA in living cells plays an important role in understanding miRNA-related regulation and pathological research. Localized DNA circuits have shown good performance in reaction rate and sensitivity and have been proposed for sensitive imaging of miRNA in living cells. However, most reported localized DNA circuits have a high risk of derailment or a limited loading rate capacity, which hinder their further application. To solve these issues, we herein developed a domino-like localized cascade toehold assembly (LCTA) amplification-based DNA nanowire to achieve highly sensitive and highly specific imaging of miRNAs in living cells by using DNA nanowires as reactant delivery vehicles and confining both reactant probes in a compact space. The LCTA is constructed by interval hybridization of DNA double-stranded probe pairs to a DNA nanowire with multiplex footholds generated by alternating chain hybridization. Due to the localized effect, the LCTA showed high reaction kinetics and sensitivity, and the method could detect miRNAs as low as 51 pM. The LCTA was proven to be able to accurately distinguish the miRNA expression difference between normal cells and cancer cells. In particular, the developed LCTA could be used to construct an OR logic gate to simultaneously image the total amount of multiple miRNAs in living cells. We believe that the developed LCTA can be an effective intracellular nucleic acid imaging tool and can promote the development of nucleic acid-related clinical disease diagnosis and DNA logical sensors.
Introduction
MicroRNAs (miRNAs) are short non-coding RNA molecules (approximately 19–24 nucleotides) that play an important role in cell proliferation, migration, and apoptosis.1–3 A large number of studies have shown that the abnormal expression of specific miRNA is closely related to the occurrence and development of different cancers or many other pathological conditions.4,5 Therefore, miRNA is considered to be an effective biomarker for disease diagnosis, treatment and prognosis, and the development of highly sensitive miRNA detection strategies is of great significance, particularly in situ imaging to analyze it in living cells. RT-qPCR is the gold standard method for miRNA detection, but the method involves complex sample pretreatment and can only obtain the average expression level of miRNA.6–8In situ detection of miRNA in living cells can obtain information on the dynamic expression and distribution of miRNAs, which has attracted widespread attention.9,10 Thus, imaging miRNAs in live cells would be highly desirable. However, it is arduous to accurately image intracellular miRNAs owing to their low abundance and heterogeneous expression at different times and locations.Recently, a large number of nucleic acid signal amplification methods have been developed for miRNA imaging.10 These amplification methods can be divided into protein-based amplification and enzyme-free amplification.11,12 Although protein-based amplification strategies, such as exponential amplification reaction (EXPAR),13 rolling circle amplification (RCA)14 and strand displacement assay (SDA),15 have been used for intracellular miRNA imaging in fixed cells with high sensitivity, they are not suitable for miRNA imaging in living cell because exogenous protein enzymes are difficult to transfect into live cells and may change the expression of intracellular miRNA.16,17 Robust enzyme-free amplification methods, including hybridization chain reaction (HCR),18,19 DNAzyme based strategy,20 entropy-driven catalysis,17 and catalyzed hairpin assembly (CHA),21,22 have been developed for amplification detection of targets of interest and also imaging of miRNA in living cells. Despite remarkable successes, at least two issues still need to be solved. First, those strategies have low reaction efficiencies and slow reaction kinetics in live cells because of the random collision of free diffusible reactants.23,24 Second, dissociative DNA probes need to be efficiently transfected into cells. Dissociative DNA probes are updated into cells by transfection or nanocarriers, and the complex biological environment (especially the presence of nuclease) inside the cell would degrade dissociative DNA probes and their reaction products, resulting in signal instability and even false positives.
Recently, some enzyme-free localized DNA circuits where successive reactants are confined in a compact space represent a potential tool to address the above issues.22,25–27 The spatial localization of reactants, resulting in a high local reagent concentration, enables amplification circuits with faster reaction kinetics and higher sensitivity, which is a valuable strategy in the field of biosensor and biological imaging. These recent studies have achieved improved reaction kinetics and sensitivity for miRNA imaging in living cells by confining hairpin reactant probes on DNA nanomaterials such as DNA nanowires, cubes and tetrahedrons.28,29 Nevertheless, these localized DNA circuits still cover at least one of the following limitations that need to be solved. First, limited loading capacity, some DNA nanomaterials such as cubes and tetrahedrons have limited binding sites available to reactant probes, which limits further improvement of the reaction performance. Second, a high chance of derailment, almost all reported localized DNA circuits are based on CHA and here the target analyte is used as a catalyst. In such a reaction, the target must span a hurdle of the amplification product to react with the next hairpin probe, which can easily lead to derailment of the target.30,31 Once the target is detached from DNA nanomaterials, the signal amplification stops, which makes the localized DNA circuits not as sensitive and fast as expected. A localized DNA circuit with high loading capacity and sequential triggering without hindrance represents an ideal candidate for amplified biosensing, yet it is rarely proposed for intracellular miRNA imaging.
The domino effect is that a small initial energy can set off a series of chain reactions in an interconnected system. Inspired by the domino effect, we developed a domino-like localized cascade toehold assembly (LCTA) amplification circuit based on a linear DNA nanowire for highly sensitive imaging of miRNA in living cells. As shown in Scheme 1, the system is composed of three double stranded H1S1, H2S2 and L. The double stranded L, a large DNA nanowire with multiple bonding sites, is obtained by alternating hybridization between two linear DNA of L1 and L2. Hairpin H1 was designed to recognize S2 and labeled with BHQ1 at its appropriate region. Hairpin H2 was designed to recognize S1 and S1 was labeled with FAM. Double stranded H1S1 is generated by the hybridization between the loop part of hairpin H1 and linear DNA of S1, and fluorescence recovery of FAM is achieved once H1 is detached from H1S1. H2S2 is generated by the hybridization between hairpin H2 and linear DNA of S2. H1S1 and H2S2 hybridize to the nanowire L alternately through the sticky ends of S1 and S2, respectively. In the absence of target miRNA, H1S1 and H2S2 on the nanowire L remain intact and the fluorescence of FAM on S1 is very low due to the close proximity of the quenching group BHQ1 on H1. Upon target miRNA stimulation, H1 is competitively displaced from H1S1 by the target miRNA via toehold strand displacement and self-assembly to form a stable hairpin structure that draw the 3′ and 5′ fragments closer. Fluorescence recovery of FAM is achieved due to the displacement of H1 from H1S1. Then the released H1 further rapidly recognizes S2 of adjacent H2S2. Thus, H2 could be released from H2S2via a toehold strand displacement reaction and folded into a stable hairpin structure, which in turn recognizes new S1 of adjacent H1S1 and induces the release of new H1via a strand displacement reaction, achieving further enhancement of FAM fluorescence. It is evident that the target miRNA triggers the cascade circuit reaction between H1S1 and H2S2, realizing signal amplification. Herein, the nanowires L have a dual role, one is as a highly biocompatible carrier to deliver nucleic acid probes into cells, and another is to confine H1S1 and H2S2 in a confined space, which can increase the local concentration of the probe to achieve high reaction kinetics. In addition, the target is only used as the initial stimulus to induce the cascade reaction between H1S1 and H2S2 for the developed LCTA cascade amplification circuit, which is the same as the domino effect and could greatly reduce the risk of derailment compared to previously reported confined amplification reactions in theory. Therefore, this developed LCTA strategy for intracellular miRNA imaging has the advantages of simple design, high sensitivity and reaction kinetics, which is expected to be a promising tool for application in disease diagnosis.
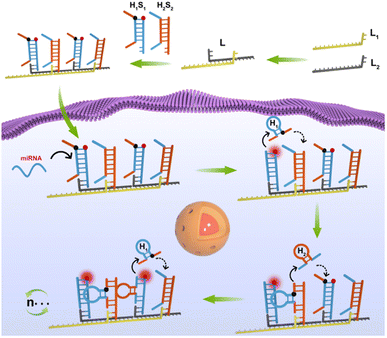 | ||
| Scheme 1 The scheme of the domino-like localized cascade toehold assembly amplification (LCTA)-based DNA nanowire for intracellular microRNA imaging. The LCTA system is composed of L, H1S1 and H2S2. | ||
Results and discussion
Assembly and characterization of LCTA nanostructures
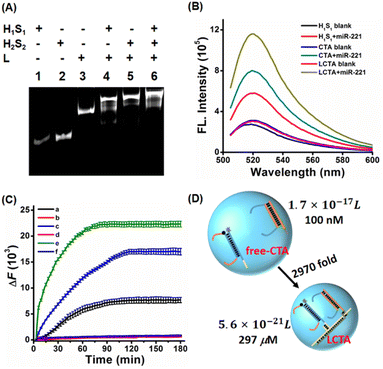
LCTA nanostructures were synthesized by linear assembly of H1S1, H2S2 and L. Subsequently, the prepared LCTA nanoprobes were first characterized by 12% native polyacrylamide gel electrophoresis analysis. As shown in Fig. S1A, S1B and S1C,† double-stranded H1S1, H2S2, and L chains are well formed. When H1S1, H2S2 and L were mixed, a new band with a higher molecular weight appeared and the old band disappeared (Fig. 1A), indicating that the expected LCTA nanostructure could be synthesized and the double-stranded probes of H1S1 and H2S2 could be immobilized on the nanowires. The formed LCTA nanostructures were also characterized by atomic force microscopy (Fig. S2†). Compared to the dispersed L without H1S1 and H2S2 (Fig. S2A†), a larger size complex could be observed for LCTA nanostructures (Fig. S2B†), which is consistent with previous reports.26Feasibility verification of the LCTA
After the synthesis of LCTA nanostructures, we investigated the feasibility of the LCTA for miRNA detection by thermodynamic studies, PAGE electrophoresis and fluorescence spectroscopy. Many previous studies have demonstrated that miR-221 is a potential disease marker and is upregulated in many cancers,32,33 so miR-221 was used as the target model. The thermodynamic calculation results indicated that the CTA strategy was thermodynamic feasible (the thermodynamic prediction part of ESI and Fig. S3†). To further verify the results of calculation, we verified the feasibility of CTA reaction by PAGE electrophoresis. As shown in Fig. S4,† no new bands in lane 3 could be observed when only H1S1 (lane 1) and H2S2 (lane 2) were mixed. Upon comparison, a new band appeared and the old band disappeared in lane 4 when miR-221, H1S1 and H2S2 were mixed, suggesting that the CTA had taken place. A diffuse high molecular weight band in lane 7 was observed when the target miR-221 was added to the LCTA nanostructure (lane 6), indicating that the LCTA had occurred. Fluorescence spectra were also further used to verify the feasibility of the reaction. The H1S1-target without amplification and free-CTA (H1S1 and H2S2 are not bonded to nanowire L and freely diffusing) systems were selected as the control groups. As depicted in Fig. 1B, similar and very low background fluorescence signals were observed from the H1S1 reaction, the free-CTA system and the LCTA system in the absence of miR-221, indicating that probe H1S1 or probe H2S2 is metastable in the absence of target miR-221. When miR-221 was incubated with H1S1, an enhanced fluorescence was observed with a signal-to-noise ratio of 2.13, indicating that miR-221 was able to displace the H1 probe from probe H1S1. Comparing the mixture of H1S1 and miR-221 in the H1S1 reaction, an increased fluorescence signal with a signal-to-noise ratio of 2.57 was detected in the mixed solution of H1S1, probe H2S2 and miR-221 for the free-CTA system, which should originate from the target miR-221 triggering the self-assembly reaction between probe H1S1 and probe H2S2, achieving signal amplification. When the target miR-221 was added to the LCTA nanostructure solution in the LCTA system, a highest fluorescence signal with a signal-to-noise ratio of 3.77 was observed, indicating that probe H1S1 and probe H2S2 were immobilized on the nanowire to further enhance the detected signal. These observations clearly indicate that the developed LCTA strategy enables detection of miR-221 with higher sensitivity than the H1S1-target system and the free-CTA system.The kinetic characteristics of the LCTA system, free-CTA system and H1S1-target system without amplification were also investigated by monitoring real-time fluorescence changes with a PCR instrument in a homogeneous solution. As shown in Fig. 1C, compared with H1S1 and free-CTA, the LCTA had a faster fluorescence enhancement rate under the same concentration of target miR-221. But in the absence of target miR-221, no fluorescence increase was observed in the LCTA, free-CTA and H1S1-target systems. These results indicate that the LCTA system has faster reaction kinetics and higher sensitivity than the free-CTA system.
The enhanced reaction kinetics of LCTA can be explained by the collision theory (V = 1/cR),22–34 where V is the local sphere volume, c represents the concentration of the probe, and R is the Avogadro constant (R = 6.02 × 10²³). When the concentrations of H1S1 and H2S2 are both 100 nM in the free-CTA system, the volume of a local sphere formed by the closest distance between H1S1 and H2S2 is 1.7 × 10⁻¹⁷ L with a radius of 54 nm. For the LCTA system, the distance between H1S1 and H2S2 in the DNA nanowires L is reduced to about 11 nm (33 bp). Hence, the minimum reaction sphere volume is calculated to be 5.6 × 10⁻²¹ L and the local concentration of H1S1 and H2S2 in nanowires is calculated to be 297 μM, which is about 2970-fold higher than that of free-CTA (Fig. 1D). Since the collision frequency is positively related to the local concentration of the reactants, the increased local concentration could exhibit higher reaction efficiency and sensitivity for the LCTA system in theory.
Sensing performance of the LCTA
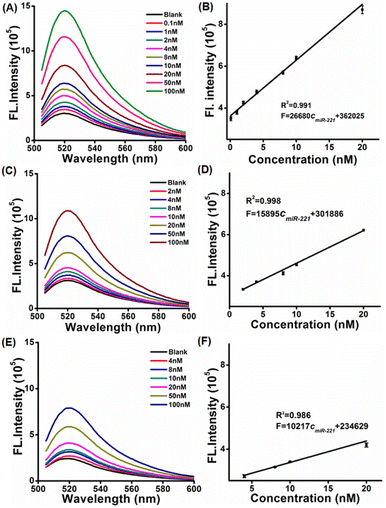
In order to study the sensing performance of the LCTA system in vitro, free-CTA and H1S1-target systems were selected as controls. The fluorescence spectra of the LCTA, free-CTA and H1S1-target systems were monitored in the presence of different concentrations of target miRNA. The fluorescence intensities of the LCTA, free-CTA and H1S1-target systems increased with the increase of the target concentration (Fig. 2A, C–E), respectively. For the LCTA strategy (Fig. 2A and B), a standard curve of F = 26680cmiR-221 + 362![[thin space (1/6-em)]](https://www.rsc.org/images/entities/char_2009.gif) 025 with a coefficient of 0.991 was fitted at miR-221 concentrations from 0.1 nM to 20 nM. The limit of detection (LOD) was calculated to be 51 pM based on the 3σ method. For free-CTA (Fig. 2C and 2D), a standard curve of F = 15895cmiR-221 + 301
025 with a coefficient of 0.991 was fitted at miR-221 concentrations from 0.1 nM to 20 nM. The limit of detection (LOD) was calculated to be 51 pM based on the 3σ method. For free-CTA (Fig. 2C and 2D), a standard curve of F = 15895cmiR-221 + 301![[thin space (1/6-em)]](https://www.rsc.org/images/entities/char_2009.gif) 886 was obtained in response to miR-221 concentration from 2 nM to 20 nM and the detection limit was 1.1 nM. For the H1S1-target system (Fig. 2E and F), the linear range is obtained from 4 nM to 20 nM and the standard curve equation is F = 10217cmiR-221 + 234
886 was obtained in response to miR-221 concentration from 2 nM to 20 nM and the detection limit was 1.1 nM. For the H1S1-target system (Fig. 2E and F), the linear range is obtained from 4 nM to 20 nM and the standard curve equation is F = 10217cmiR-221 + 234![[thin space (1/6-em)]](https://www.rsc.org/images/entities/char_2009.gif) 629, with a detection limit of 2.86 nM. In contrast, the LOD of the LCTA was about 21.6 times lower than that of CTA and 56.1 times lower than that of the H1S1-target system. These results demonstrate that the developed LCTA method enables highly sensitive analysis of miRNA in vitro and has the potential to sense intracellular molecules.
629, with a detection limit of 2.86 nM. In contrast, the LOD of the LCTA was about 21.6 times lower than that of CTA and 56.1 times lower than that of the H1S1-target system. These results demonstrate that the developed LCTA method enables highly sensitive analysis of miRNA in vitro and has the potential to sense intracellular molecules.
In addition to high sensitivity, good specificity is another important parameter for miRNA analysis due to its high sequence similarity. To evaluate the specificity of the LCTA for miR-221, different nucleic acid sequences, including single base difference mis-1 and mis-2, and other related miRNAs of miR-1246, miR-222, and miR-373, were used for comparison. As shown in Fig. S5A,† only the target miR-222 can induce an obvious fluorescence enhancement signal, and the signal intensity close to the background signal was observed for other nonspecific sequences with the same concentration. The Fx/FmiR-221 value corresponding to 100 nM miR-221 was about 8.5 times that of mis-1 and mis-2 at the same concentration, and about 196.4 times that of other miRNAs (Fig. S5B†), where FmiR-221 is the fluorescence intensity in response to 100 nM miR-221 and Fx represents the fluorescence intensity in response to the same concentration of the other sequences. The Tukey test also showed that P ≈ 0.000 < 0.001 (***) between miR-221 and other interferents, which was statistically different. These results suggest that the LCTA strategy has high specificity and can even distinguish single base mismatched miRNAs.
Intracellular miRNA imaging using the LCTA
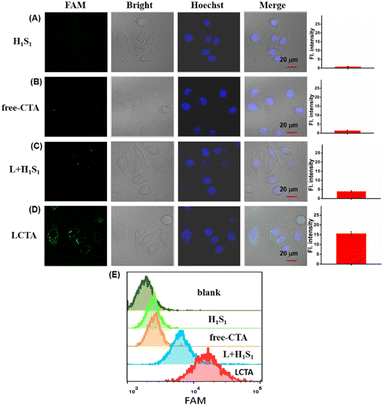
It is known that exogenous nucleic acid probes are easily degraded by nucleases in cells. DNA nanowires have been revealed to protect themselves from nuclease degradation. Prior to the miRNA imaging in living cells, we evaluated the anti-degradation performance of LCTA nanostructure probes. The stability of LCTA nanostructures was evaluated by measuring the fluorescence recovery ability of H1S1, H1S1 + L, CTA (H1S1, H2S2) and LCTA upon treatment with 0.5 U per mL DNase I and cell lysates (about 1 × 10⁴ cells per 1 μL cell lysate), respectively. As shown in Fig. S6,† only a slight fluorescence enhancement was observed over 6 h for H1S1 + L and LCTA treated with DNase I (Fig. S6A†) and cell lysates (Fig. S6B†), whereas a significant fluorescence increase signal was detected for free H1S1 and CTA. These results demonstrated that the DNA nanowire nanostructure had the ability to protect the probe from degradation by intracellular nucleases during intracellular miRNA imaging. We also evaluated the cell cytotoxicity of LCTA nanostructures by standard MTT. After incubation with different concentrations of LCTA nanostructures for 24 h, both breast cancer cells MCF-7, MDA-MB-231 and breast epithelial cell MCF-10A exhibited over 90% viability (Fig. S7†), indicating that LCTA nanostructures had good biocompatibility and were suitable for subsequent intracellular experiments.To demonstrate the ability of the proposed LCTA strategy to sensitively image intracellular miRNA, the H1S1-target, free-CTA and L + H1S1 (without H2S2 in LCTA nanostructures) systems were used as control groups. As shown in Fig. 3 and S8, no fluorescence signal was observed in MCF-7 and MDA-MB-231 cells treated with H1S1 and CTA (Fig. 3A and B, S8A and S8B†), which is attributed to the inability of DNA probes to enter cells without effective vectors. Weak FAM signals were found in cells incubated with L + H1S1 (Fig. 3C and S8C†). This result indicates that the probe can be efficiently transfected into cells via DNA nanowires, however, only weak fluorescence can be observed due to the absence of signal amplification. A bright FAM signal was clearly observed when the cells were incubated with LCTA (Fig. 3D and S8D). The MCF-7 cells were also treated with H1S1, free-CTA, L + H1S1 and LCTA systems, respectively, and further analyzed by flow cytometry. The results showed that the fluorescence signal of MCF-7 cells treated with the LCTA was higher than those of the other groups (Fig. 3E). These results indicate that the developed LCTA system with high amplification capacity enables highly sensitive imaging of intracellular miRNAs.
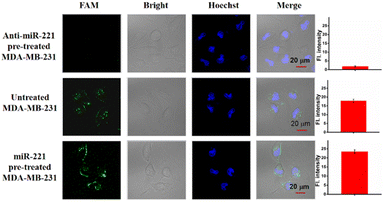
To validate the ability of the LCTA strategy to image the change of miR-221 in living cells, we used antisense miR-221 oligonucleotides to down-regulate the expression level of miR-221 in MDA-MB-231 cells and miR-221 mimics to increase the expression level of miR-221 in MDA-MB-231 cells. As shown in Fig. 4, compared with untreated MDA-MB-231 cells, the fluorescence signal of the cells pretreated with anti-sense miR-221 was lower, while that of the cells treated with miR-221 mimics was significantly enhanced. Those results showed that LCTA can visualize changes of miRNA in expression levels with high specificity.
To further verify that the developed LCTA can effectively distinguish differences in intracellular miRNA expression levels, we verified the imaging ability of drug-induced intracellular miRNA expression. It has been reported that dexamethasone can down-regulate miR-221 in MDA-MB-231 cells.35,36 We compared the expression of miR-221 in MDA-MB-231 cells after adding 10 μM dexamethasone. As shown in Fig. S9,† compared with untreated MDA-MB-231 cells, the fluorescence intensity of MDA-MB-231 cells treated with 10 μM dexamethasone was weaker, which is also consistent with previous studies.33,36 These results confirm that the developed LCTA is capable of visualizing changes of intracellular miRNA in expression levels and can be used to monitor the effects of drugs on intracellular miRNA expression levels.
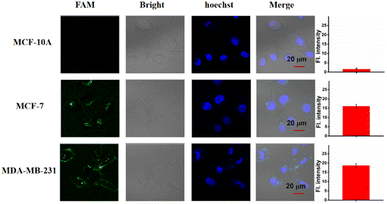
Based on the above results, we then studied the miRNA imaging ability of the LCTA in different cells including MCF-7, MDA-MB-231 and MCF-10A cells by using the CLSM technique. MCF-7 and MDA-MB-231 were reported to have high expression levels of miR-221 and were selected as the positive groups. MCF-10A cells with low expression of miR-221 were selected as a negative control. As shown in Fig. 5, almost no fluorescence was observed in MCF-10A, and brighter fluorescence was observed in MCF-7 and MDA-MB-231. These results were consistent with previously reported results and also consistent with the results obtained by the gold standard method RT-qPCR (Fig. S11†). Moreover, the results further suggest that this LCTA strategy has the ability to discriminate differences in gene expression levels in cancer cells and normal cells.
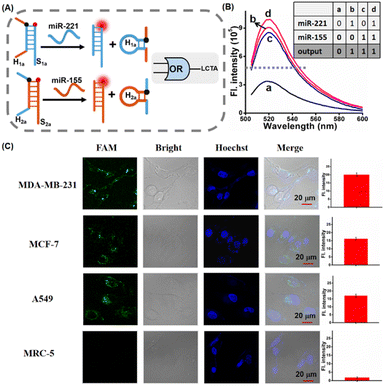
In the LCTA reaction mechanism, the formation of either H1 or H2 in this reaction can trigger the subsequent strand displacement reaction between H1S1 and H2S2 and there is no sequence dependence between the loop sequences of H1 and H2. So the LCTA method can be used to construct an OR gate logic sensor by using two types of miRNAs as input to further realize the simultaneous determination of the total content of two types of miRNAs in cells. Here, miR-221 and miR-155 were selected as research objects and the corresponding LCTA system probes were designed (Fig. 6A and S10†). H1a is designed to be able to be displaced from H1aS1a upon import of miR-221 and H2a is designed to be able to be displaced from H2aS2a upon miR-155 input. The released H1a or H2a can initiate subsequent self-assembly amplification reactions between H1aS1a and H2aS2a. We first verified the feasibility of simultaneous detection of the two miRNAs by fluorescence spectroscopy in vitro. In the absence of either miRNA, only weak fluorescence was observed (Fig. 6B). A significant fluorescence enhancement was observed in the presence of either one or both of the miR-221 and miR-155 in the LCTA system, which is in good accord with the characteristic OR logic operation (Fig. 6B, inset). We further explored this OR logic operation-based LCTA for imaging the total content of miR-221 and miR-155 in cells. MDA-MB-231, MCF-7 cells and A549 cells were selected as the positive model systems to validate the logical operation. It is reported that both miR-221 and miR-155 are highly expressed in MDA-MB-231 cells, MCF-7 cells display high expression levels of miR-222 but low expression levels of miR-155, and A549 cells shows low expression of miR-221 but high expression of miR-155.37,38 MRC-5 cells express low levels of both miR-221 and miR-155 and were therefore selected as a negative control system. As shown in Fig. 6C, a tiny fluorescence signal was observed in MRC-5 cells, indicating that both miR-221 and miR-155 are low expressed in this cell. As expected, a significant fluorescence signal was observed in MDA-MB-231, MCF-7 cells and A549 cells, demonstrating that this OR logic operation-based LCTA can successfully achieve multiple miRNA imaging in live cells. In these cells, these cellular imaging results are consistent with those shown for miRNA expression levels measured by standard RT-qPCR (Fig. S11 and S12†). These results indicate that the developed LCTA can not only achieve accurate and sensitive imaging of miRNA, but also be used to construct OR gate logic sensor circuits and realize simultaneous detection of multiple miRNAs in cells.
Conclusions
In conclusion, we have successfully developed a domino-like localized cascade toehold assembly (LCTA) amplification-based DNA nanowire for highly sensitive imaging of intracellular miRNAs. The following characteristics have been proven in the LCTA system. (1) By confining reactants in a confined space with DNA nanowires, improved reaction kinetics and sensitivity have been achieved compared to the diffusion of reactants in solution. (2) LCTA nanostructures have good biocompatibility and exhibit good stability against degradation by intracellular nucleases. (3) The LCTA system could enter cells by self-delivery without any exotic transfection reagents and nanocarriers, avoiding side reactions. (4) The cascade toehold assembly of reactant probes triggered by the target resembled a domino effect, reducing the risk of derailment. (5) The LCTA system could be used to construct OR gate logic sensor systems to achieve simultaneous imaging of multiple miRNA in cells without adding additional probes just by simply changing the recognition sequences of reaction probes. This system could also be used to monitor the effect of drugs on cells and to effectively distinguish the difference of miRNA expression levels in normal cells and cancer cells. It should also be noted that the cell imaging performance can be further improved by enhancing the transfection efficiency of DNA nanowires with transfection reagents, such as aptamers and liposomes (Fig. S13†). We anticipate that the developed LCTA system not only can become an effective tool for molecule imaging in living cells, but also facilitate the development of high-performance nucleic acid amplification circuits and DNA logical sensors.Experimental
Materials and apparatus
All oligonucleotides were obtained from Sangon Biotechnology Co., Ltd (Shanghai, China). All oligonucleotides and miRNAs were purified with HPLC. The sequence of oligos used is detailed in Table S1.†DEPC treated deionized water, 40% acrylamide, 6× loading buffer and 4S GelRed dye were purchased from Sangon Biotechnology Co., Ltd (Shanghai, China). Penicillin-streptomycin, 4-(2-hydroxyethyl) piperazine-1-ethylate sodium salt (HEPES), magnesium chloride, and 3-(4,5-dimethylthiazol-2-yl)-2,5-diphenyltetrazole bromide (MTT) were purchased from Sigma-Aldrich (MO, USA), and all were analytically pure reagents. Dulbecco's modified Eagle Culture medium (DMEM), fetal bovine serum (FBS) and trypsin were purchased from Thermo Fisher Scientific (USA). MCF-7 cells, MDA-MB-231 cells, A549 cells, MCF-10A cells and MRC-5 cells were purchased from Shanghai Institute for Biological Sciences (SIBS).
Gel electrophoresis was performed using a DyCZ-24DN electrophoresis cell (LIUYI, Beijing, China) and DigiGenius gel system (Syngene, UK). Fluorescence spectra were measured using a WATERS Prep 150 fluorescence spectrophotometer (WATERS, USA). Confocal fluorescence images of cells were obtained using a LSM 880 confocal laser scanning fluorescence microscope (Carl Zeiss, Germany). Cell viability was determined using a M1000PRO Multifunctional Microplate Reader (TECAN, Austria).
Preparation of LCTA nanoprobes
First, L1, H1, and H2 were incubated with L2, S1, and S2 in Tris–HCl buffer containing Mg2+ at 95 °C for 5 min and cooled to room temperature within 3 hours to form the complexes of L1L2 (DNA nanowire L), H1S1 and H2S2, respectively. Then, 50 μL of 10 μM L, 50 μL of 10 μM H1S1 and 50 μL of 10 μM H2S2 were added into Tris–HCl buffer containing Mg2+ and mixed at 37 °C for 5 hours to assemble LCTA nanoprobes.Gel electrophoresis analysis
The formation of double-stranded H1S1, H2S2, L and LCTA nanoprobes was verified by 12% polypropylene gel electrophoresis. The electrophoresis was run in 1× TBE buffer at a constant voltage of 220 V for 30 min and then the probes were dyed with 4S GelRed dye for 30 min. The final images were analyzed on a DigiGenius gel system (Syngene, UK).Detection of miR-221 in vitro
MiR-221 with different concentrations (0–100 nM) was incubated with 100 nM LCTA nanoprobes in Tris–HCl buffer containing Mg2+ at 37 °C for 3 h. Fluorescence spectra between 505 and 600 nm were recorded using a fluorescence spectrometer with an excitation wavelength of 492 nm. Both excitation and emission slit widths are 5 nm. The fluorescence intensity at 520 nm was recorded to evaluate the performance.In vitro kinetic analysis
Based on the developed strategy, 50 nM miR-221 and 100 nM LCTA nanoprobes were incubated at 37 °C, while fluorescence intensity changes were measured using a StepOne real-time PCR system (Applied Bio-Systems, USA). In order to compare the amplification effects, the CTA system and H1S1 system were separately incubated with miR-221 under the same conditions.Stability determination of DNA nanoprobes
1 U per mL DNase I was added to DNA LCTA nanoprobes to make the final concentration of the LCTA nanoprobe at 100 nM. The solutions were incubated at 37 °C and then the fluorescence change was measured using a StepOne real-time PCR system (Applied Bio-Systems, USA).Cell culture
MCF-7, A549, MDA-MB-231 and MCF-10A cells were cultured with DMEM containing 10% fetal bovine serum (FBS) and 1% streptomycin/penicillin antibiotic solution. MRC-5 cells were cultured with α-MEM containing 10% fetal bovine serum (FBS) and 1% streptomycin/penicillin antibiotic solution. All cells were cultured in an ESCO CCL-170B-8 cell culture chamber containing 5% CO2 at 37 °C.Preparation of cell lysate
The re-suspended MCF-7 cells were rapidly quick-frozen in liquid nitrogen and thawed in a 37 °C water bath 3 times. After that, the lysates were added to 0.4 M NaCl, and collected by centrifugation for 20 min at 12![[thin space (1/6-em)]](https://www.rsc.org/images/entities/char_2009.gif) 000 rpm (or max.) at 4 °C. Then 5 nmol anti-miR-221 was added to the cell lysate to form a stable double chain with probe miR-221 and were stored at −20 °C until use.
000 rpm (or max.) at 4 °C. Then 5 nmol anti-miR-221 was added to the cell lysate to form a stable double chain with probe miR-221 and were stored at −20 °C until use.
Toxicity assessment
MCF-7 cells were cultured overnight in 96-well plates at 37 °C containing 5% CO2. The old medium was then removed. LCTA nanoprobes (1 μM) were diluted in fresh medium to different concentrations (0, 10, 20, 50, 100, and 200 nM) and added to MCF-7 cells, and then further incubated for 24 h. Then the old medium was discarded, and 100 μL 0.5 mg mL−1 MTT solution was added to each well, and incubated at 37 °C for 4 h. Finally, cell viability was determined by measuring the absorbance of the sample at 490 nm with a multimode microplate reader. All experiments were repeated three times simultaneously.Confocal fluorescence imaging experiment
To explore the feasibility of the system for imaging miR-221 in living cells, MCF-7 cells and MDA-MB-231 cells were inoculated on a 35 mm confocal laser dish overnight. After washing with PBS 3 times, MCF-7 cells and MDA-MB-231 cells were incubated with H1S1, H1S1 + L, CTA and LCTA groups for 3 h, respectively. The concentration of each probe was 100 nM.For the miR-221 regulation experiment, 1 μM miR-221 mimics and 1 μM anti-miR-221 were separately pre-transfected into MDA-MB-231 cells via liposome 3000 and incubated for 2 h at 37 °C. After treatment, the cells were incubated with 100 nM LCTA nanoprobes at 37 °C for 3 h.
To verify the regulatory effect of dexamethasone on miR-221, 10 μM dexamethasone cells were pre-incubated with MDA-MB-231 cells for 24 h. After treatment, the cells and the LCTA nanosystem containing 100 nM LCTA probes were incubated at 37 °C for 3 h, respectively.
To image different intracellular miR-221, the LCTA nanosystem containing 100 nM LCTA probes was incubated with MCF-7, MDA-MB-231 cells and MCF-10a cells at 37 °C for 3 h, respectively.
To investigate the ability of LCTA to simultaneously image miR-221 and miR-155 in various cell lines, such as MCF-7, MDA-MB-231, A549 and MRC-5 cells, these cells were incubated with the LCTA nanosystem containing 100 nM LCTA probes at 37 °C for 3 h, respectively.
Then, the cells were washed with PBS 3 times and incubated with Hoechst solution for 20 min. The washed cells were washed with PBS again 3 times and then added into 1 mL complete medium for confocal imaging under a confocal laser microscope. All cell fluorescence images were collected using an LSM 880 confocal laser scanning fluorescence microscope (Carl Zeiss, Germany) containing the following filter set: excitation wavelength of FAM fluorescent dye was 480 nm and the emission wavelength was 520 nm. A 60× oil target was applied in one set of experiments. The fluorescence images were processed by standard software LSM880 and presented.
RT-qPCR
First, the cells were treated with 1 mL Trizol reagent to extract total intracellular RNA according to the operation instructions, and stored at −80 °C for further use. cDNA samples were prepared using the reverse transcription (RT) reaction with an AMV First Strand cDNA Synthesis Kit. According to the instructions protocol on a LightCycler480 software setup, qPCR analysis of miRNA was performed using SG Fast qPCR Master Mix. The relative expression levels of miR-221 and miR-155 were calculated by the 2−ΔΔCT method.Data availability
Data are available in the ESI† online.Author contributions
J. C and Z. Y. designed this study. B. L., T. H. and Z. Y. implemented the experiments. M. S. and T. H. implemented the construction of reaction kinetic models. T. L., B. L. and Wen-Jun Duan helped with living-cell image analysis. J. C., Jin-Xiang Chen. and Z. Y. completed the data analysis. Z. D. and Min-Min Li provided materials and helped with RT-qPCR data analysis. J. C. and Z. Y. wrote the manuscript with help from all authors. All authors approved the final version.Conflicts of interest
There are no conflicts to declare.Acknowledgements
This work was supported by the National Natural Science Foundation of China (22004059, 82172346, 21974153 and 21874064), the Scientific Technology Project of Guangzhou City (202102020640 and 202102010087), the Key Laboratory of Optic-electric Sensing and Analytical Chemistry for Life Science, MOE (M2022-1) and the Clinical Frontier Technology Program of the First Affiliated Hospital of Jinan University, China (no. JNU1AF-CFTP-2022-a01234).References
- M. Ha and V. N. Kim, Nat. Rev. Mol. Cell Biol., 2014, 15, 509–524 CrossRef CAS PubMed.
- J. T. Mendell and E. N. Olson, Cell, 2012, 148, 1172–1187 CrossRef CAS PubMed.
- S. L. Romero-Cordoba, I. Salido-Guadarrama, M. Rodriguez-Dorantes and A. Hidalgo-Miranda, Cancer Biol. Ther., 2014, 15, 1444–1455 CrossRef CAS PubMed.
- R. Deng, K. Zhang and J. Li, Acc. Chem. Res., 2017, 50, 1059–1068 CrossRef CAS PubMed.
- R. M. Graybill and R. C. Bailey, Anal. Chem., 2016, 88, 431–450 CrossRef CAS PubMed.
- R. Shi and V. L. Chiang, Biotechniques, 2005, 39, 519–525 CrossRef CAS PubMed.
- C. Chen, D. A. Ridzon, A. J. Broomer, Z. Zhou, D. H. Lee, J. T. Nguyen, M. Barbisin, N. L. Xu, V. R. Mahuvakar, M. R. Andersen, K. Q. Lao, K. J. Livak and K. J. Guegler, Nucleic Acids Res., 2005, 33, e179 CrossRef PubMed.
- H. Dong, J. Lei, L. Ding, Y. Wen, H. Ju and X. Zhang, Chem. Rev., 2013, 113, 6207–6233 CrossRef CAS PubMed.
- R. Deng, L. Tang, Q. Tian, Y. Wang, L. Lin and J. Li, Angew. Chem., Int. Ed., 2014, 53, 2389–2393 CrossRef CAS PubMed.
- Y. Zhao, F. Chen, Q. Li, L. Wang and C. Fan, Chem. Rev., 2015, 115, 12491–12545 CrossRef CAS PubMed.
- J. Wei, H. Wang, Q. Wu, X. Gong, K. Ma, X. Liu and F. Wang, Angew. Chem., Int. Ed., 2020, 59, 5965–5971 CrossRef CAS PubMed.
- J. Wei, H. Wang, X. Gong, Q. Wang, H. Wang, Y. Zhou and F. Wang, Nucleic Acids Res., 2020, 48, e60 CrossRef CAS PubMed.
- J. Chen, W. Yin, Y. Ma, H. Yang, Y. Zhang, M. Xu, X. Zheng, Z. Dai and X. Zou, Chem. Commun., 2018, 54, 13981–13984 RSC.
- J. Ge, L. L. Zhang, S. J. Liu, R. Q. Yu and X. Chu, Anal. Chem., 2014, 86, 1808–1815 CrossRef CAS PubMed.
- K. Zhang, R. Deng, Y. Li, L. Zhang and J. Li, Chem. Sci., 2016, 7, 4951–4957 RSC.
- A. Fu, R. Tang, J. Hardie, M. E. Farkas and V. M. Rotello, Bioconjugate Chem., 2014, 25, 1602–1608 CrossRef CAS PubMed.
- Z. Cheglakov, T. M. Cronin, C. He and Y. Weizmann, J. Am. Chem. Soc., 2015, 137, 6116–6119 CrossRef CAS PubMed.
- L. Li, J. Feng, H. Liu, Q. Li, L. Tong and B. Tang, Chem. Sci., 2016, 7, 1940–1945 RSC.
- J. Chen, H. H. Yang, W. Yin, Y. Zhang, Y. Ma, D. Chen, Y. Xu, S. Y. Liu, L. Zhang, Z. Dai and X. Zou, Anal. Chem., 2019, 91, 4625–4631 CrossRef CAS PubMed.
- X. Meng, K. Zhang, F. Yang, W. Dai, H. Lu, H. Dong and X. Zhang, Anal. Chem., 2020, 92, 8333–8339 CrossRef CAS PubMed.
- H. Fang, N. Xie, M. Ou, J. Huang, W. Li, Q. Wang, J. Liu, X. Yang and K. Wang, Anal. Chem., 2018, 90, 7164–7170 CrossRef CAS PubMed.
- Z. Qing, J. Hu, J. Xu, Z. Zou, Y. Lei, T. Qing and R. Yang, Chem. Sci., 2019, 11, 1985–1990 RSC.
- P. Liu, X. Qian, X. Li, L. Fan, X. Li, D. Cui and Y. Yan, ACS Appl. Mater. Interfaces, 2020, 12, 45648–45656 CrossRef CAS PubMed.
- G. Chatterjee, N. Dalchau, R. A. Muscat, A. Phillips and G. Seelig, Nat. Nanotechnol., 2017, 12, 920–927 CrossRef CAS PubMed.
- H. Bai, Y. Yan, D. Li, N. Fan, W. Cheng, W. Yang, H. Ju, X. Li and S. Ding, Biosens. Bioelectron., 2022, 198, 113821 CrossRef CAS PubMed.
- Q. Wei, J. Huang, J. Li, J. Wang, X. Yang, J. Liu and K. Wang, Chem. Sci., 2018, 9, 7802–7808 RSC.
- L. Liu, Q. Rong, G. Ke, M. Zhang, J. Li, Y. Li, Y. Liu, M. Chen and X.-B. Zhang, Anal. Chem., 2019, 91, 3675–3680 CrossRef CAS PubMed.
- F. Lin, Y. Shao, Y. Wu and Y. Zhang, ACS Appl. Mater. Interfaces, 2021, 13, 3713–3721 CrossRef CAS PubMed.
- C. Xing, Z. Chen, Y. Lin, M. Wang, X. Xu, J. Dai, J. Wang and C. Lu, Chem. Commun., 2021, 57, 3251–3254 RSC.
- X. Cheng, Y. Bao, S. Liang, B. Li, Y. Liu, H. Wu, X. Ma, Y. Chu, Y. Shao, Q. Meng, G. Zhou, Q. Song and B. Zou, Anal. Chem., 2021, 93, 9593–9601 CrossRef PubMed.
- N. Wu, K. Wang, Y. T. Wang, M. L. Chen, X. W. Chen, T. Yang and J. H. Wang, Anal. Chem., 2020, 92, 11111–11118 CrossRef CAS PubMed.
- G. A. Calin and C. M. Croce, Nat. Rev. Cancer, 2006, 6, 857–866 CrossRef CAS PubMed.
- D. Han, C. Xu, X. H. Ren, Y. Peng, B. Xu, J. L. Song, J. Chen and S. X. Cheng, Anal. Chem., 2022, 94, 2399–2407 CrossRef CAS PubMed.
- Y. Zhang, Y. Wu, S. Luo, C. Yang, G. Zhong, G. Huang, X. Zhang, B. Li, C. Liu, L. Li, X. Yan, L. Zheng and B. Situ, ACS Sens., 2022, 7, 1075–1085 CrossRef CAS PubMed.
- J. Xu, Y. Su, A. Xu, F. Fan, S. Mu, L. Chen, Z. Chu, B. Zhang, H. Huang, J. Zhang, J. Deng, L. Ai, C. Sun and Y. Hu, Mol. Ther., 2019, 27, 559–570 CrossRef CAS PubMed.
- J. J. Zhao, Z. B. Chu, Y. Hu, J. Lin, Z. Wang, M. Jiang, M. Chen, X. Wang, Y. Kang, Y. Zhou, T. Ni Chonghaile, M. E. Johncilla, Y. T. Tai, J. Q. Cheng, A. Letai, N. C. Munshi, K. C. Anderson and R. D. Carrasco, Cancer Res., 2015, 75, 4384–4397 CrossRef CAS PubMed.
- X. Gong, J. Wei, J. Liu, R. Li, X. Liu and F. Wang, Chem. Sci., 2019, 10, 2989–2997 RSC.
- Z. Zhou, Y. S. Sohn, R. Nechushtai and I. Willner, ACS Nano, 2020, 14, 9021–9031 CrossRef CAS PubMed.
Footnote |
| † Electronic supplementary information (ESI) available: Sequences of the used oligos, electrophoresis verification of H1L1, H2L2 and L nanowire formation, characterization of LCTA nanostructures by AFM, analysis of the specificity of the LCTA system, nuclease-resistance of the LCTA, cytotoxicity of the LCTA, CLSM images of MDA-MB-231 cells treated under different conditions, effects of dexamethasone on intracellular miR-221 imaging, quantification of the expression level of miR-221 and miR-155 by RT-qPCR. See DOI: https://doi.org/10.1039/d2sc05890a |
| This journal is © The Royal Society of Chemistry 2022 |

