
 Open Access Article
 This Open Access Article is licensed under a Creative Commons Attribution-Non Commercial 3.0 Unported Licence
High-fidelity ATP imaging via an isothermal cascade catalytic amplifier†
Zhiqiao
Zou
a,
Min
Pan
b,
Fengye
Mo
a,
Qunying
Jiang
a,
Ailing
Feng
a,
Yizhuo
Zhou
a,
Fuan
Wang
 *a and
Xiaoqing
Liu
*a
*a and
Xiaoqing
Liu
*a
aCollege of Chemistry and Molecular Sciences, Wuhan University, Wuhan 430072, P.R. China. E-mail: fuanwang@whu.edu.cn
bFrontier Science Center for Immunology and Metabolism, Medical Research Institute, Wuhan University, Wuhan 430072, P.R. China
First published on 30th September 2022
Abstract
Artificial catalytic DNA circuits that can identify, transduce and amplify the biomolecule of interest have supplemented a powerful toolkit for visualizing various biomolecules in cancer cells. However, the non-specific response in normal tissues and the low abundance of analytes hamper their extensive biosensing and biomedicine applications. Herein, by combining tumor-responsive MnO2 nanoparticles with a specific stimuli-activated cascade DNA amplifier, we propose a multiply guaranteed and amplified ATP-sensing platform via the successive cancer-selective probe exposure and stimulation procedures. Initially, the GSH-degradable MnO2 nanocarrier, acting as a tumor-activating module, ensures the accurate delivery of the cascade DNA amplifier into GSH-rich cancer cells and simultaneously provides adequate Mn2+ cofactors for facilitating the DNAzyme biocatalysis. Then, the released cascade amplifier, acting as an ATP-monitoring module, fulfills the precise and sensitive analysis of low-abundance ATP in cancer cells where the catalyzed hairpin assembly (CHA) is integrated with the DNAzyme biocatalyst for higher signal gain. Additionally, the cascade catalytic amplifier achieved tumor-specific activated photodynamic therapy (PDT) after integrating an activatable photosensitizer into the system. This homogeneous cascade catalytic aptasensing circuit can detect low-abundance endogenous ATP of cancer cells, due to its intrinsically rich recognition repertoire and avalanche-mimicking hierarchical acceleration, thus demonstrating broad prospects for analyzing clinically important biomolecules and the associated physiological processes.
Introduction
As the fundamental construct of live entities, cells undergo energy-dependent biochemical reactions all the time.1 As the direct source of energy, adenosine triphosphate (ATP) plays a crucial role in multiple physiological activities.2–5 Aberrant expression of ATP is related to many diseases such as Parkinson's disease,6 Alzheimer's disease,7 and some malignant tumors.8 ATP has been proved to participate in various biological processes of tumor cells,9 where the increased glucose metabolism leads to the higher expression of ATP in cancer cells than normal cells,10–13 and thus ATP has been considered as a potential cancer biomarker.14–17 Methods for ATP monitoring in cancer cells are of great significance for biological studies and clinical diagnosis.DNA nanotechnology exhibits excellent programmability and biocompatibility to construct versatile nanoplatforms for monitoring biomolecules and for processing molecule information.18–20 Functional nucleic acids (FNAs) can greatly expand the potential of DNA nanotechnology.21–23 Notably, aptamers,24 FNAs with high affinity and selectivity for their corresponding targets, ranging from biomolecules25,26 to whole-live cells,27 can be used as powerful identification tools for the ATP assay.28 Several ATP aptamer-based probes, including DNA nanoprisms,29 DNA nanoflares,30 and DNA dendrimers,31 have been developed for intracellular ATP detection. They can convert the ATP input into a readout signal through the reliable conformational transformation of aptamers, but the 1![[thin space (1/6-em)]](https://www.rsc.org/images/entities/char_2009.gif) :1 probe-to-biomolecule binding ratio restricts their detection sensitivity. To address this limitation, a delicate aptazyme has been constructed for amplified ATP sensing by integrating the ATP aptamer and a deoxyribozyme (DNAzyme) with catalytic activity.32 This functional aptazyme can be stimulated upon ATP binding to activate the successive DNAzyme-mediated substrate cleavage, thus generating a magnified readout signal. However, its moderate sensitivity and relatively low specificity hinder precise ATP analysis in complex cellular environments. The sensing efficiency of such aptazymes is restricted by single-stage amplification and insufficient supply of intracellular DNAzyme cofactors,33–35 which cannot satisfy the high demand for the analysis of low-abundance ATP in live cells.36 Moreover, the inherent drawbacks in ATP-switchable DNA amplifiers may inevitably cause non-specific responses,37 because ATP is expressed in both cancer cells and other highly secluded compartments.38–40 Therefore, it is urgent to develop a cell-selective, efficient and sensitive method for in situ visualization of ATP.
:1 probe-to-biomolecule binding ratio restricts their detection sensitivity. To address this limitation, a delicate aptazyme has been constructed for amplified ATP sensing by integrating the ATP aptamer and a deoxyribozyme (DNAzyme) with catalytic activity.32 This functional aptazyme can be stimulated upon ATP binding to activate the successive DNAzyme-mediated substrate cleavage, thus generating a magnified readout signal. However, its moderate sensitivity and relatively low specificity hinder precise ATP analysis in complex cellular environments. The sensing efficiency of such aptazymes is restricted by single-stage amplification and insufficient supply of intracellular DNAzyme cofactors,33–35 which cannot satisfy the high demand for the analysis of low-abundance ATP in live cells.36 Moreover, the inherent drawbacks in ATP-switchable DNA amplifiers may inevitably cause non-specific responses,37 because ATP is expressed in both cancer cells and other highly secluded compartments.38–40 Therefore, it is urgent to develop a cell-selective, efficient and sensitive method for in situ visualization of ATP.
Herein, by integration of a catalytic hairpin assembly (CHA) circuit41 and DNAzyme biocatalysis,42 we develop a cascaded amplifier for a sensitive ATP assay with the assistance of a tumor-responsive MnO2 vehicle which also serves as a cofactor precursor. Through decorating DNAzyme-based cascaded amplifiers onto the MnO2 nanocarrier surface, a tumor-specific activatable nanoprobe is constructed for high-fidelity ATP imaging with high selectivity and sensing efficiency in live cells and mice. Initially, the sensing function of the ATP-responsive cascade amplifier, attached on MnO2 nanoparticles, is silent (OFF). Once delivered into specific cancer cells, MnO2 is degraded to Mn2+ by the overexpressed glutathione (GSH),43 while the released cascade amplifier restores its sensing function (ON). Monitoring of ATP dynamics using the activated ATP-responsive probe consists of two simple catalytic DNA reactions. First, intracellular ATP binding to its aptamer induces the release of a pre-blocked sequence to expose the initiator DNA for catalyzing the hybridization of two hairpin reactants (CHA reaction). Meanwhile, the ATP-initiated CHA reaction induces the assembly of numerous DNAzymes with an active configuration. Consequently, with the help of Mn2+ cofactors, the DNAzyme amplifier triggers the cyclic cleavage of the substrate (DNAzyme catalytic reaction), thus generating the cascade-amplified readout signal. Moreover, our DNA nanoprobe can realize cell-specific activated photodynamic therapy via a functional photosensitizer. This homogeneous cascade aptasensing system in principle provides a robust tool for visualizing different intracellular bioactive molecules of low concentration, which shows its great potential in extensively realizing earlier disease diagnosis and in deeply understanding the associated physiological processes.
Results and discussion
Design and demonstration of the ATP-responsive CHA-DNAzyme amplifier
By coupling catalytic hairpin assembly (CHA) and the DNAzyme biocatalyst, we design an ATP-responsive CHA-DNAzyme amplifier for a sensitive and specific assay. This cascade amplifier is composed of a partially hybridized duplex (A/B), two functional hairpins (H1 and H2) encoded with DNAzyme subunits, and a DNAzyme substrate (S) labelled with a fluorophore/quencher (F/Q) pair at 5′- and 3′-ends (Scheme 1). The ATP sensing unit is a A/B complex. The A strand is comprised of an ATP aptamer sequence and a trigger sequence for the CHA reaction, both of which are partially blocked by the B strand in the absence of ATP. Once the aptamer sequence of A specifically binds to ATP, the strand B will be displaced from the hybrid, exposing the trigger sequence. Thus, by toehold-mediated strand displacement, the free trigger strand induces successive catalytic assembly steps between functional hairpins H1 and H2, generating enormous H1–H2 hybrids. With the help of the DNAzyme cofactor (Mn2+), the intact DNAzyme produced by the H1–H2 hybrid specially recognizes and cleaves the DNAzyme substrate S, resulting in fluorescence recovery.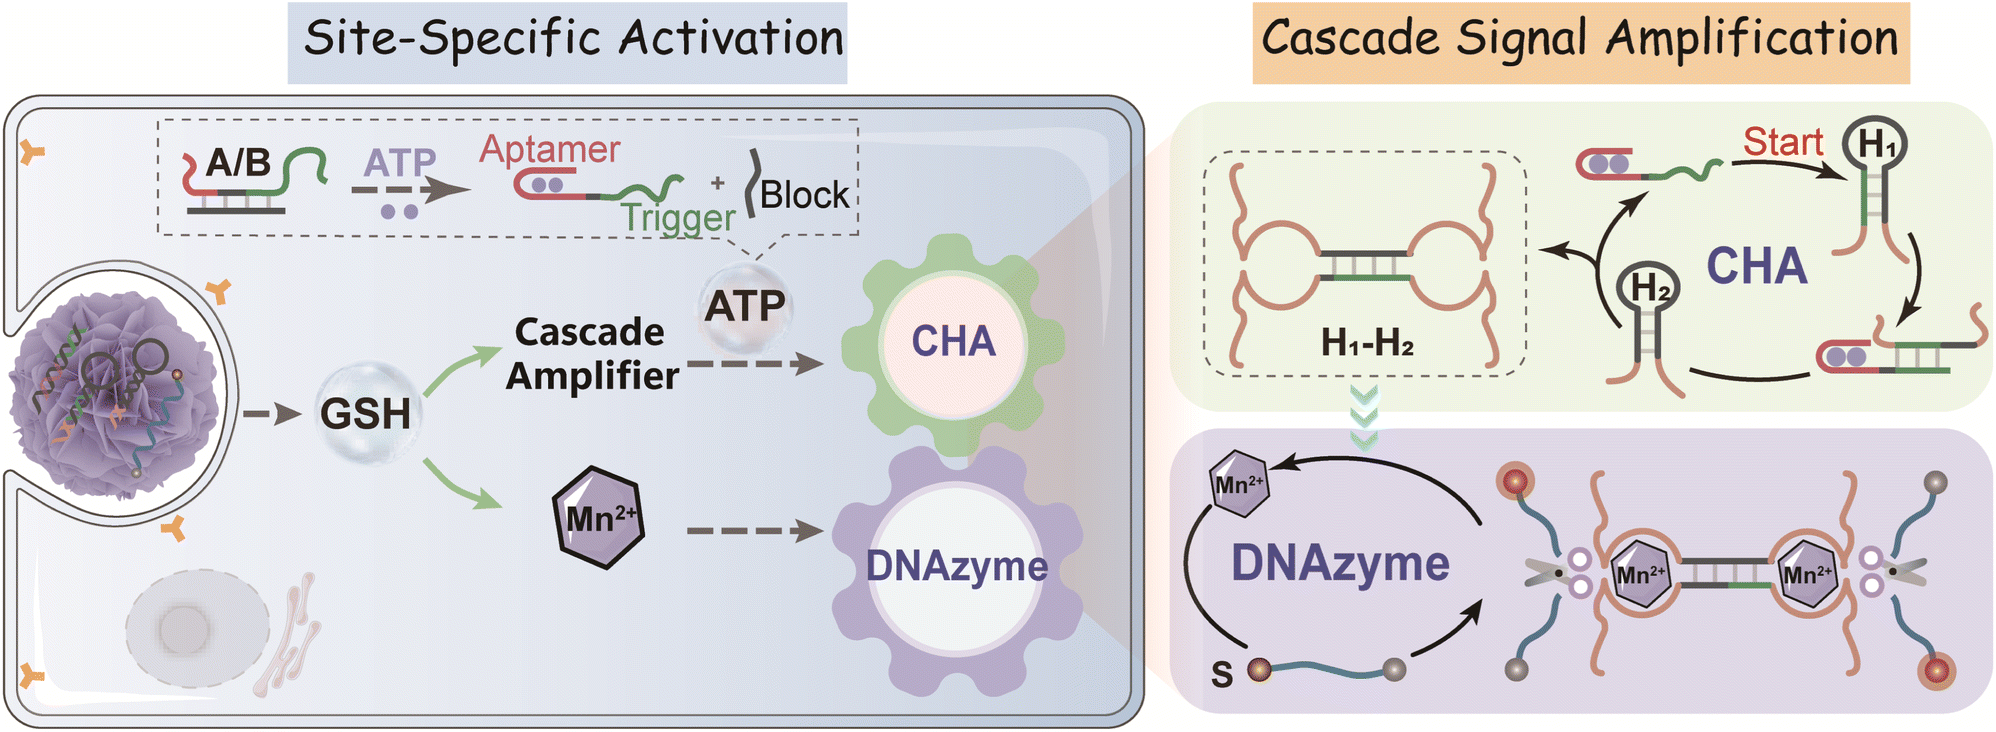 | ||
| Scheme 1 Illustration of the GSH-activated DNA nanoprobe for ATP-specific monitoring in cancer cells. Here, the MnO2 nanocarrier enables the accurate delivery of the ATP-responsive cascade amplifier into GSH-rich cancer cells and the simultaneous generation/release of Mn2+ DNAzyme cofactors. In the presence of intracellular ATP, the cascade amplifier produces plenty of CHA-assembled DNAzymes. Then, with the help of DNAzyme cofactors (Mn2+), these well-assembled DNAzymes successively catalyze the cleavage of the substrate, resulting in the amplified fluorescence signal to light up cancer cells both in vitro and in vivo. | ||
The viability of the CHA-DNAzyme amplifier was investigated by native polyacrylamide gel electrophoresis (PAGE) and fluorescence spectra (Fig. 1A–C). In the absence of A/B, H1 and H2 remained intact and only minimum H1–H2 hybrids were observed (lane f). However, in the presence of both A/B and ATP, abundant H1–H2 hybrids with the lowest electrophoretic mobility emerged (lane h), and the bands corresponding to H1 and H2 disappeared (Fig. 1A). This confirmed that ATP can specifically trigger the catalytic assembly between H1 and H2 (CHA reaction) and form enormous H1–H2 hybrids. Next, we confirmed the formation and the catalytic reaction of DNAzyme using Cy5 and BHQ-2 labelled substrate DNA (S) via fluorescence analysis (Fig. 1B and C). Upon addition of ATP into the cascade amplifier consisting of strands A/B, H1, H2 and S in the presence of DNAzyme cofactors such as Mn2+, the fluorescence intensity of the system was greatly enhanced (Fig. 1B). This indicated that the CHA-mediated formation of DNAzyme can efficiently cleavage its substrate. To validate the DNAzyme-mediated amplification, we then designed mutated DNAzymes and coupled them to CHA as control cascade amplifiers. The DNAzyme subunit sequence in the H1 and H2 hairpins was replaced with the poly-T sequence (termed as H1T and H2T respectively). After ATP-induced CHA reaction, each H1T–H2 or H1–H2T hybrid could only produce one DNAzyme unit, while the H1T–H2T hybrid did not form any effective DNAzyme structure (Fig. 1C and S1†), and the respective cascade reactions were termed as CHA-DNAzymeH1T–H2, CHA-DNAzymeH1–H2T, and CHA-DNAzymeH1T–H2T. As expected, compared with the CHA-DNAzyme amplifier, a lower fluorescence increase was observed for CHA-DNAzymeH1T–H2 and CHA-DNAzymeH1–H2T, and only a negligible background signal was produced with CHA-DNAzymeH1T–H2T. These data indicated the successful design of the cascade amplifier for the ATP assay.
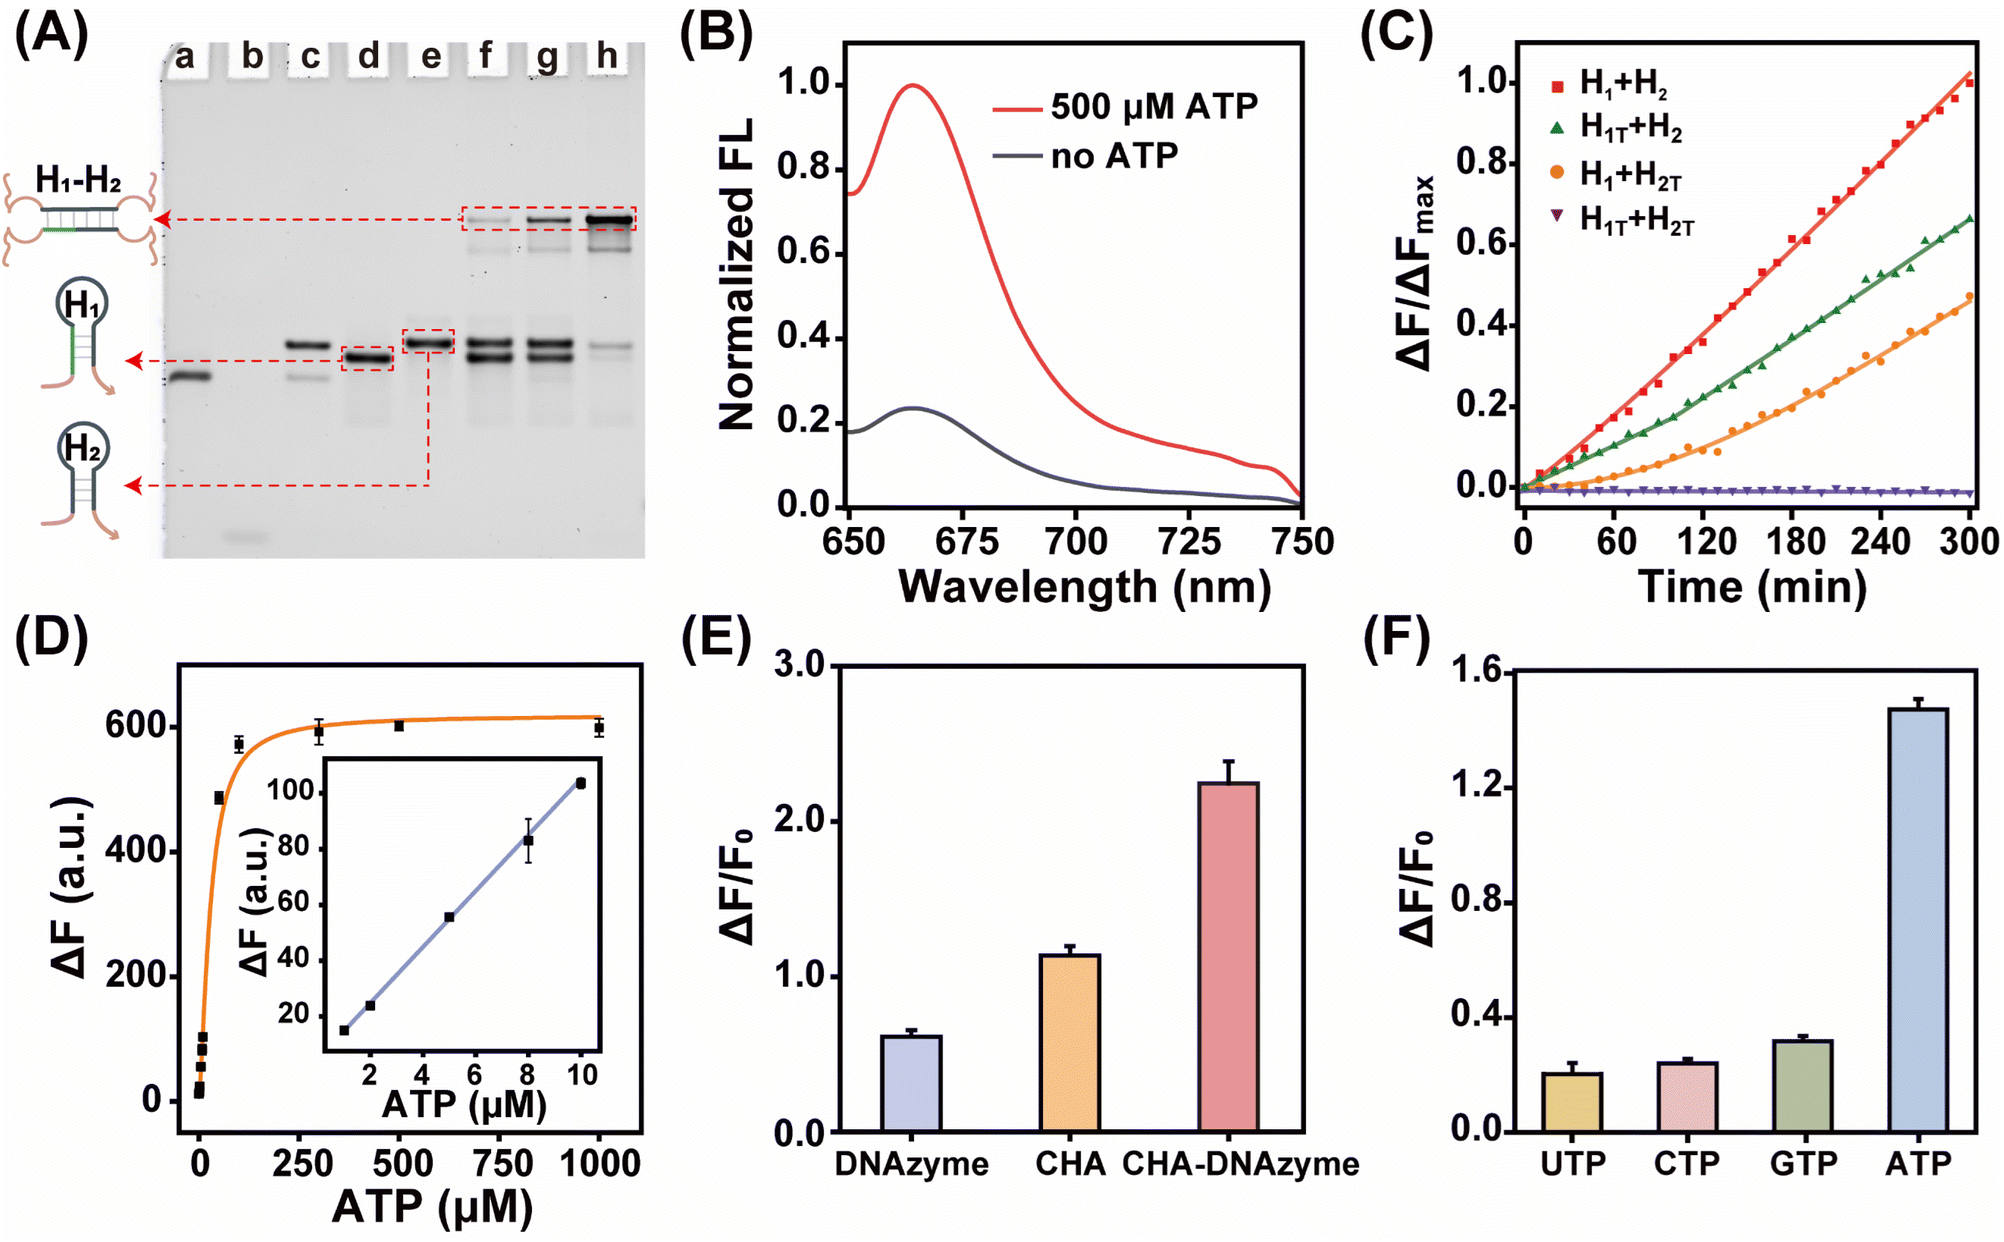 | ||
| Fig. 1 CHA-DNAzyme-amplified ATP detection via the cascade signal amplification strategy. (A) Native gel electrophoresis characterization of the ATP-induced CHA reaction: (a) A; (b) B; (c) A/B; (d) H1; (e) H2; (f) H1 + H2; (g) H1 + H2 + A/B; (h) H1 + H2 + A/B + ATP. (B) Fluorescence spectra of the CHA-DNAzyme cascade amplifier with and without 500 μM ATP in the presence of 2 mM Mn2+. (C) Time-dependent normalized fluorescence changes (ΔF/ΔFmax) of the CHA-DNAzyme amplifier and the H1T- or/and H2T-substituted amplifiers. Here ΔF refers to the fluorescence intensity change from the original fluorescence intensity F0 and ΔFmax refers to the maximal fluorescence change. (D) Relative fluorescence enhancement of the CHA-DNAzyme amplifier with ATP of different concentrations. Inset shows the corresponding linear calibration curve. (E) Fluorescence intensity changes of the single-stage (DNAzyme or CHA) and multi-stage (CHA-DNAzyme) amplifiers. (F) Selectivity of the cascade amplifier for ATP detection. Data are represented as mean ± SD (n = 3). | ||
Next, we investigated the performance of the cascade amplifier for ATP analysis. Fluorescence intensity gradually increased with elevated ATP concentrations and then reached a plateau (Fig. S2†). Based on the 3σ/slope principle, the limit of detection was obtained as 0.32 μM (Fig. 1D). It should be noted that compared with traditional single-stage amplifiers, CHA (Fig. S3†) or DNAzyme (Fig. S4†), the multi-stage amplifier, CHA-DNAzyme, exhibited a much higher fluorescence signal (Fig. 1E). In addition, the CHA-DNAzyme amplifier can distinguish ATP from its analogs including UTP, CTP, and GTP (Fig. 1F). The results revealed that this catalytic cascade approach allowed high sensitivity and selectivity for ATP detection.
Integration of MnO2 nanocarriers with the cascade amplifier for GSH-guided ATP sensing
With the high performance of the cascade amplifier for ATP analysis, we further conjugated the cascade amplifier onto MnO2 nanoparticles (MnO2 NPs) through the physisorption of nucleobases,44 and prepared DNA nanoprobes (MnCD) to improve the in vitro and in vivo assay accuracy. Besides acting as a delivery vehicle that improves the stability and cellular uptake efficacy of the cascade amplifier, this nanocarrier is responsive to the tumor-overexpressed GSH and self-supplies DNAzyme cofactor Mn2+ for in situ activation of DNAzyme, which offers an ideal nanoprobe that can precisely image ATP with high sensitivity and specificity in cancer cells. Honeycomb MnO2 nanoparticles were synthesized via a soft chemistry route under mild conditions.45 Scanning electron microscopy (SEM) and transmission electron microscopy (TEM) images indicated that the diameter of MnO2 nanoparticles was approximately equal to 140 nm (Fig. S5†). Furthermore, the MnO2 NPs had a broad absorption spectrum with a peak centered at 380 nm, endowing them with fluorescence quenching ability (Fig. S6A†). The fluorescence intensity of Cy5-labeled DNA was gradually quenched with the increased concentration of MnO2 NPs, and the amount of adsorbed DNA on MnO2 NPs was calculated to be 2.86 nmol mg−1 (Fig. S6B†). After cascade amplifier loading, the morphology of the nanoparticle remained the same (Fig. 2A), while their hydrodynamic diameter changed from 137 nm to 146 nm, and the zeta potential changed from −26.4 mV to −35.0 mV (Fig. 2B). Element distribution mapping analysis (Fig. S7†) also demonstrated the successful adsorption of DNA molecules on the MnO2 NPs, revealing the presence of homogeneously distributed carbon (C), oxygen (O), manganese (Mn) and nitrogen (N). These results preliminarily confirmed the effective construction of MnCD.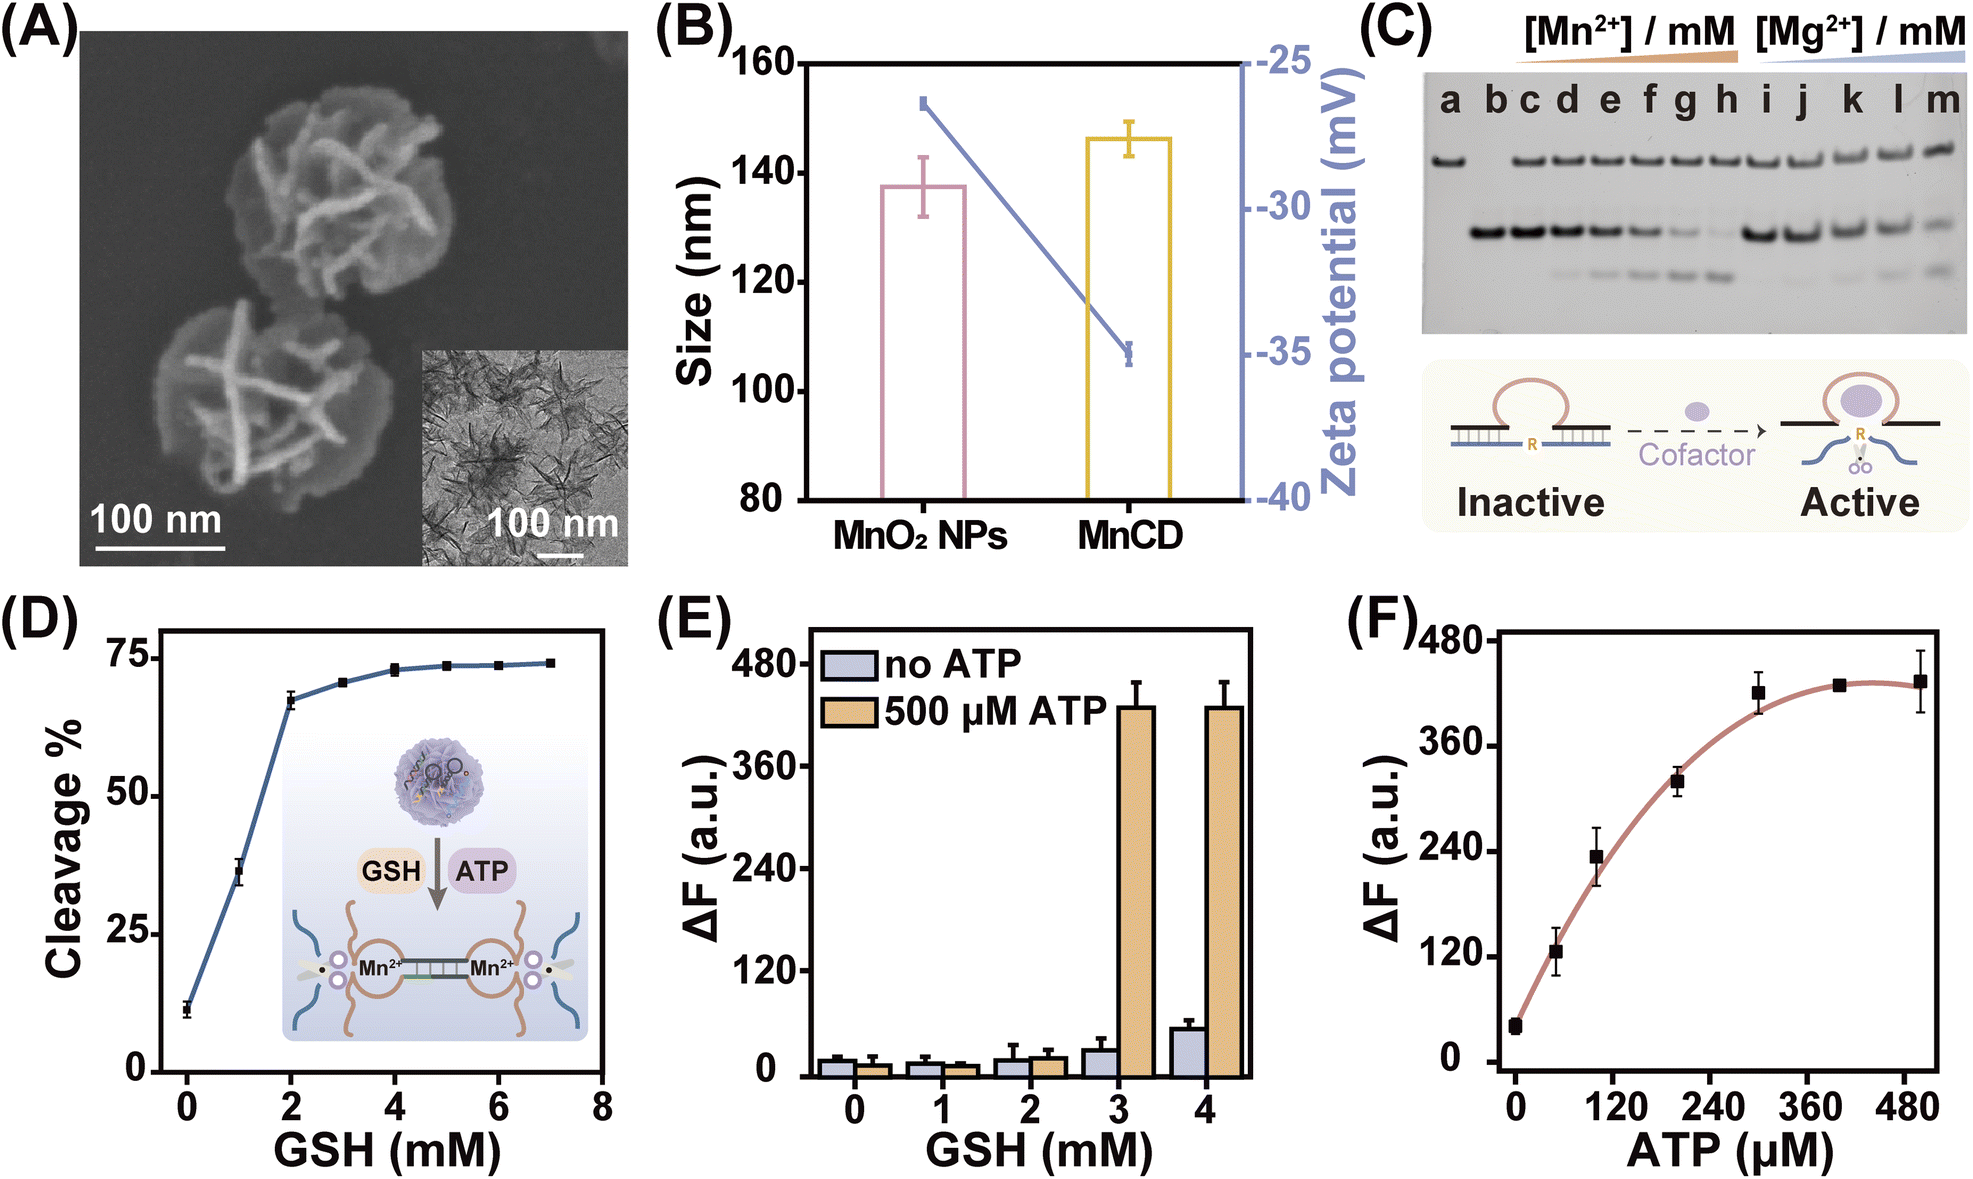 | ||
| Fig. 2 GSH-controlled DNA nanoprobe (MnCD) with a self-supplied Mn2+ cofactor for accurate ATP detection. (A) SEM and TEM images of MnCD. (B) Hydrodynamic size and zeta potential of MnO2 NPs and MnCD. (C) PAGE analysis of DNAzyme catalytic efficiency. (a) and (b) indicate the DNAzyme (a) and substrate (b) respectively. (c)–(m) represent the catalytic efficiency with different concentrations of Mn2+: 0 mM (c), 0.1 mM (d), 0.25 mM (e), 0.5 mM (f), 1 mM (g), 2 mM (h) and Mg2+: 0.1 mM (i), 0.25 mM (j), 0.5 mM (k), 1 mM (l), and 2 mM (m). (D) Summarized PAGE analysis of substrate consumption in the presence of 500 μM ATP and different GSH concentrations as shown in Fig. S11A.† (E) Fluorescence changes of MnCD in response to different concentrations of GSH in the absence or presence of 500 μM ATP. (F) Relative fluorescence enhancement of MnCD in response to various concentrations of ATP (0, 50, 100, 200, 300, 400, and 500 μM) at 3 mM GSH. Data are represented as mean ± SD (n = 3). | ||
To evaluate the stability of MnCD, we incubated MnCD with HEPES, PBS and culture medium for 24 h, and then measured the hydrodynamic size by dynamic light scattering (DLS). As shown in Fig. S8,† the hydrodynamic size of MnCD remained the same (∼142 nm) under these different conditions, thus demonstrating the high stability of MnCD. Furthermore, we utilized deoxyribonuclease I (DNase I) to assess the nuclease resistance of MnCD. The gel electrophoresis experiment indicated that the cascade amplifier, adsorbed on the MnO2 NP surface, was not obviously degraded after been treated with even 10 U mL−1 DNase I for 24 h (Fig. S9†). The result indicated that MnO2 NPs can improve the stability of our cascade amplifier by preventing it from nuclease degradation. The high stability of MnCD could provide a strong guarantee for efficient intracellular delivery.
As a nanoprobe for the ATP assay, the MnCD can be degraded by the overexpressed GSH in cancer cells (Fig. S10†), releasing Mn2+ and the cascade amplifier. Subsequently, the cascade amplifier enables recognition of ATP to generate massive CHA-induced DNAzymes. It should be noted that the content of intracellular Mg2+ cofactors (0.5 mM),46 is not sufficient enough for an efficient DNAzyme cleavage. Fortunately, the in situ generated Mn2+ cofactors in tumor sites compensate for this deficiency. Of note, as a DNAzyme cofactor, Mn2+ was more efficient than Mg2+ in facilitating DNAzyme activity. Comparisons showed that in the presence of 2 mM Mn2+, the DNAzyme demonstrated higher catalytic activity, and substrate DNA was completely cleaved; however, Mg2+ induced a lower cleavage efficacy (Fig. 2C). Overall, acting as both the nanocarrier and cofactor supplier, MnO2 NPs provided a powerful guarantee for cascade amplifier-mediated ATP monitoring.
PAGE (Fig. 2D and S11A†) verified the GSH-activated ATP sensing with MnCD. With increased concentrations of GSH, the DNAzyme cleavage reaction was accelerated and then reached saturation at 2 mM GSH, which falls within the expression level of GSH in cancer cells.43 In contrast, due to the insufficient Mn2+ supply and the quenching of fluorophores by MnO2 NP, the fluorescence intensity of MnCD was extremely inhibited in the absence or low concentrations of GSH (Fig. S11B† and 2E). Importantly, the MnCD performed concentration-dependent ATP responsiveness in the presence of 3 mM GSH (Fig. 2F). These data demonstrated that the cancer cell-overexpressed GSH controlled the release and activation of the ATP-monitoring cascade amplifier.
Visualization of intracellular ATP through signal molecule-responsive MnCD
Owing to the excellent ATP sensing performance of our GSH-controlled MnCD, we further challenged it for ATP monitoring in cancer cells. To find a suitable incubation time, dynamic cellular uptake of MnCD was analyzed by flow cytometry (Fig. S12†). The result showed that the intracellular fluorescence signal increased with elongated incubation time and reached a maximum value at 10 h. Then we incubated 4T1 cells with the A-excluded control DNA nanoprobe (CMnCD) to prove the working mechanism of MnCD. Here, the A strand was designed to recognize ATP and trigger the CHA-mediated DNAzyme cleavage reaction, generating an amplified signal readout. As expected, the CMnCD-treated cancer cells showed a weak fluorescence readout (Fig. 3A). Furthermore, compared with a DNA nanoprobe (MnC) that only enabled a single-stage amplifier, the MnCD displayed a higher fluorescence readout in cancer cells, demonstrating its superior amplification performance. To verify the specific response of MnCD to endogenous GSH, we used the GSH promotor (N-acetylcysteine, NAC)47 or GSH inhibitor (N-ethylmaleimide, NEM)48 to pretreat cancer cells to regulate the intracellular GSH content. The 4T1 cells pretreated with NAC displayed an apparent enhanced fluorescence signal as compared to the non-pretreated cells (Fig. 3B and C). In contrast, an ultralow fluorescence readout was obtained in the cells pretreated with NEM. These results manifested that the activation of MnCD depended on intracellular GSH. Subsequently, MnCD was used to monitor intracellular ATP evolutions. We pretreated 4T1 cells with Ca2+ or 4 °C incubation to enhance or decrease intracellular ATP production.49,50 Compared with the untreated cells, a much higher fluorescence output emerged in the Ca2+-pretreated cells, while the low-temperature (4 °C)-incubated cells displayed a negligible fluorescence intensity (Fig. 3D and E). These observations indicated the capability of MnCD to monitor ATP dynamics in cancer cells. In addition, we simultaneously pretreated cancer cells with the GSH modulator and ATP modulator. Confocal laser scanning microscopy (CLSM) images revealed that the cancer cells with higher levels of GSH and ATP corresponded to a stronger fluorescence readout compared to cells pretreated with the GSH promotor alone (Fig. S13†). In contrast, simultaneously decreasing intracellular ATP and GSH concentrations, cancer cells generated the weakest fluorescence signal, confirming that the signal output required stimulation from both GSH and ATP. To further validate cancer cell-specific ATP imaging, the MnCD was explored for distinguishing cancer cells (HeLa and MDA-MB-231) from normal cells (MCF-10A). The other two types of cancer cells exhibited higher fluorescence intensity compared to MCF-10A cells with lower expression of GSH and ATP (Fig. S14†). Overall, the GSH-stimulated MnCD was capable of visualizing ATP in cancer cells with high accuracy and reliability.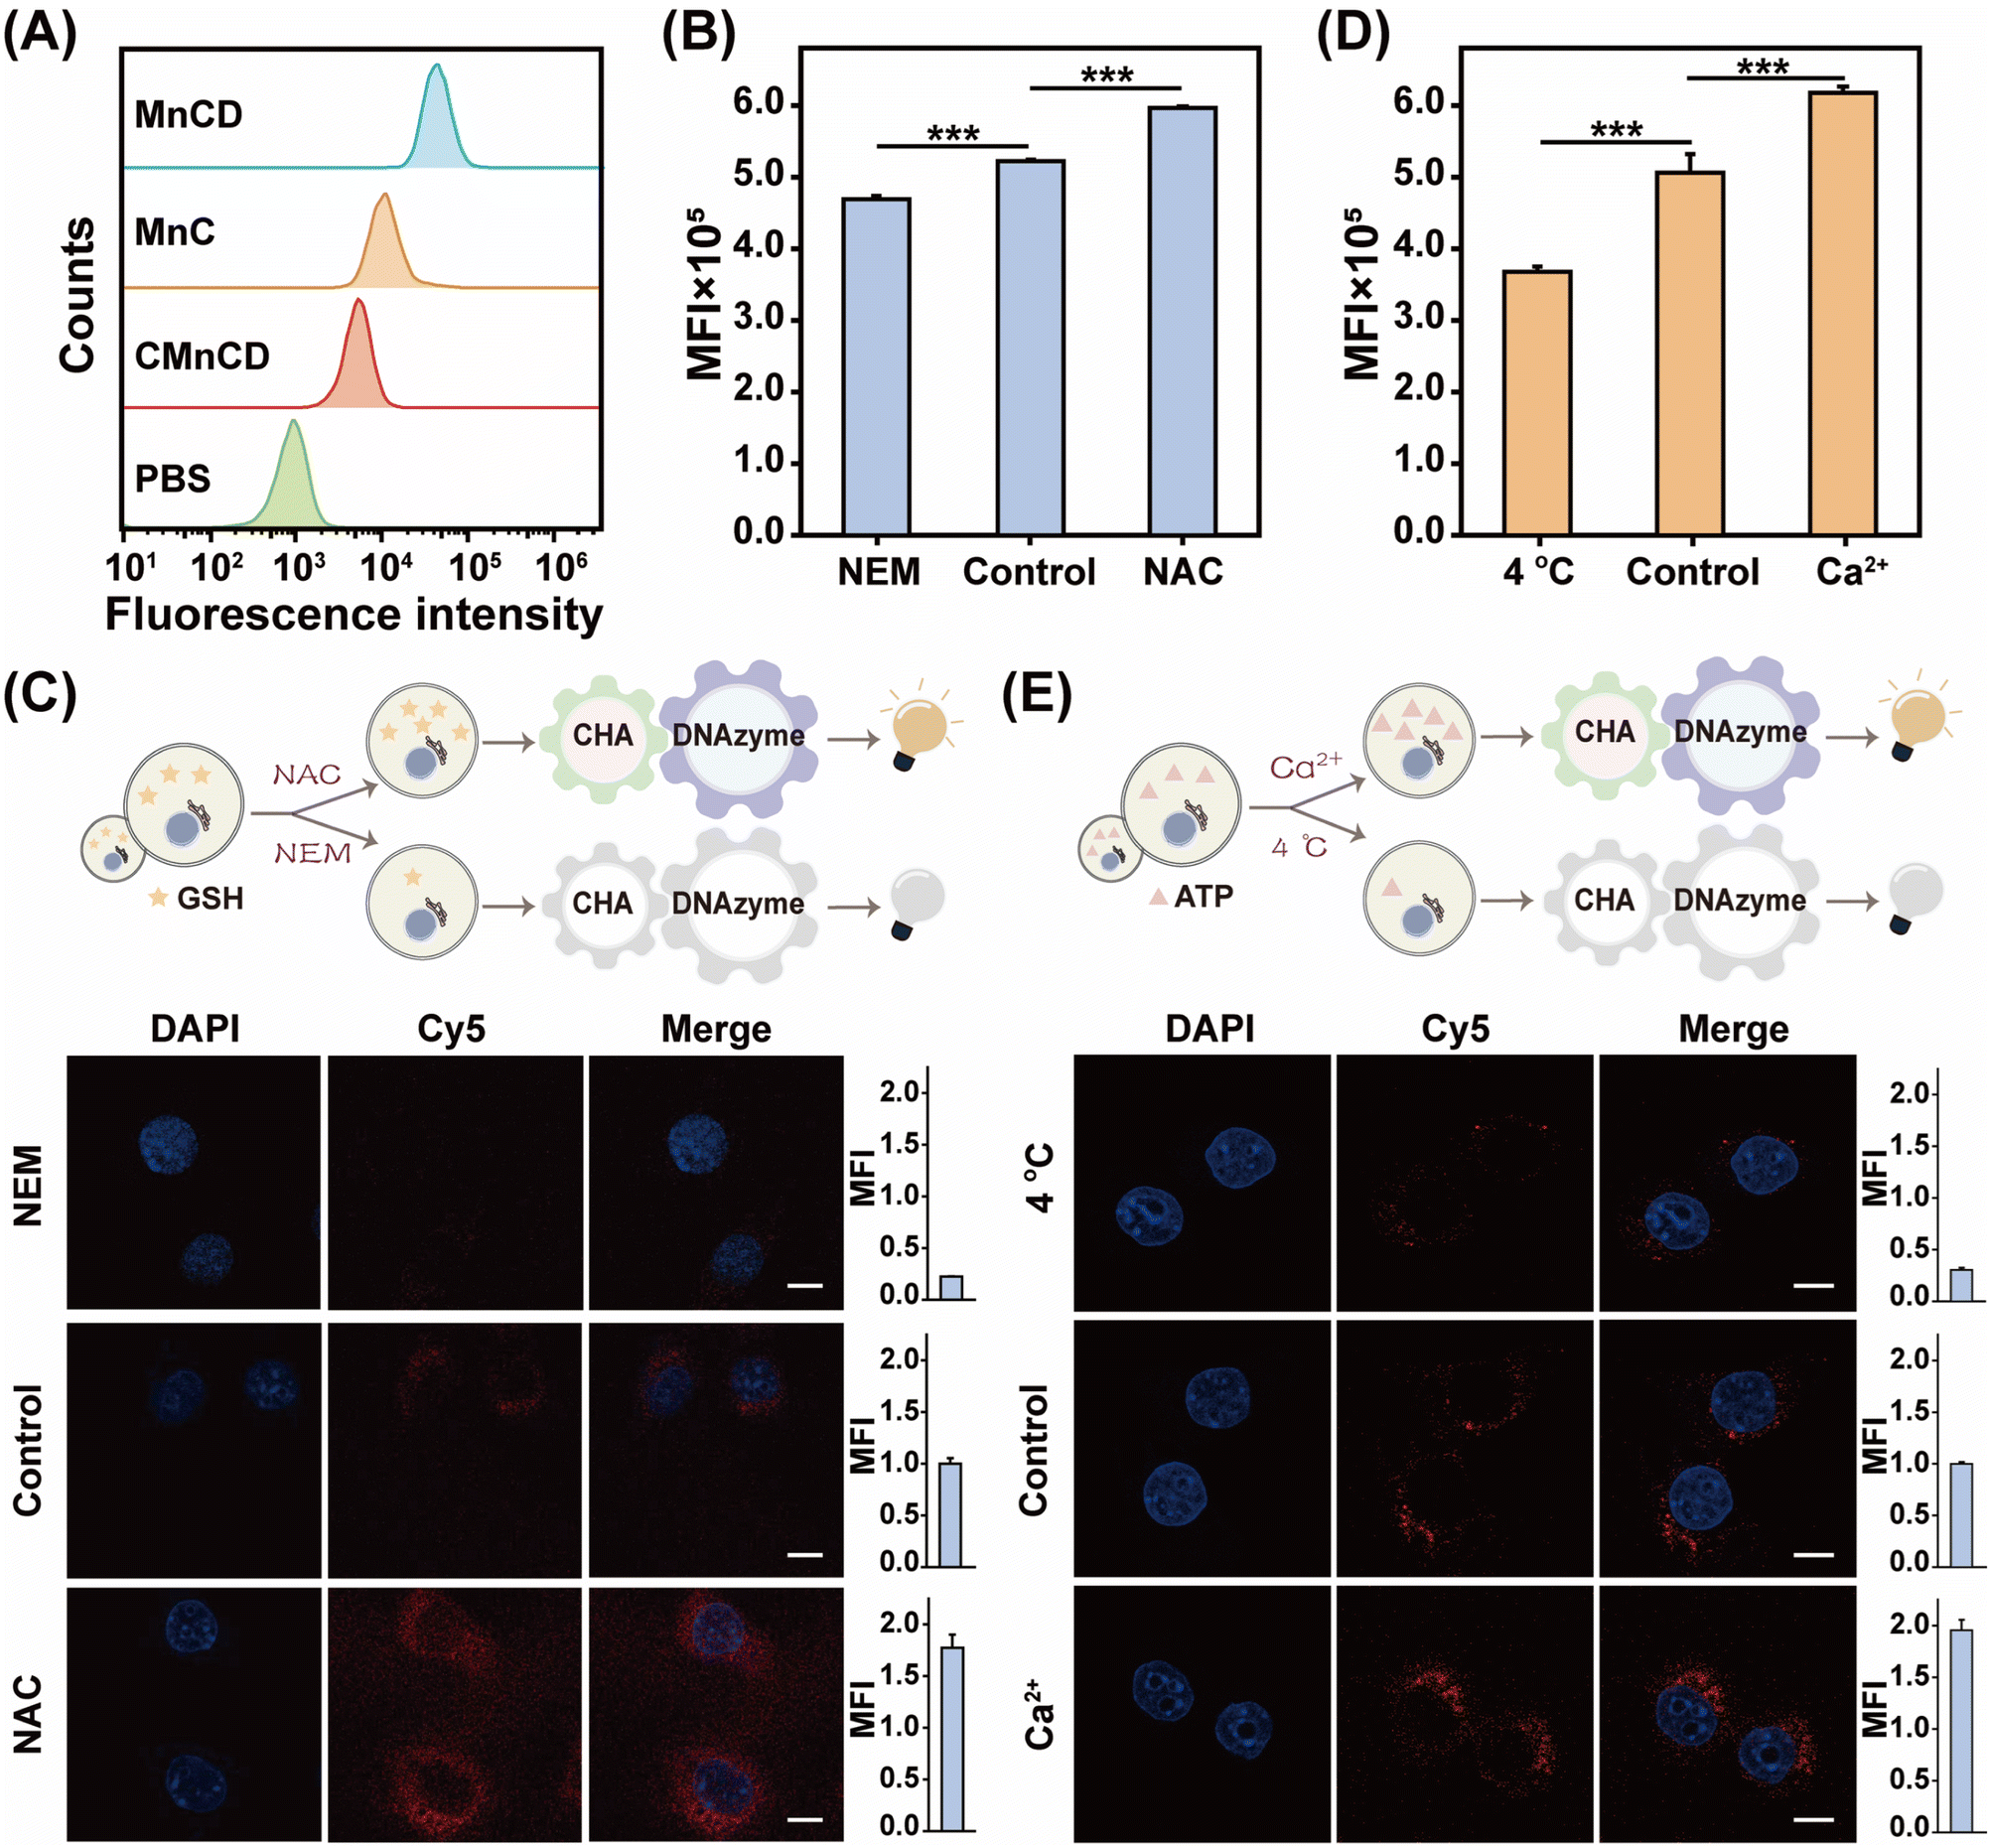 | ||
| Fig. 3 GSH-controlled DNA nanoprobe (MnCD) for monitoring ATP evolution in live cancer cells. (A) Fluorescence intensity of 4T1 cells that were respectively incubated with different systems. (B) Flow cytometry analysis of 4T1 cells that were treated with 10 μL NEM, 100 μL NAC, or culture medium (control), followed by MnCD incubation. Here MFI is denoted as the mean fluorescence intensity. (C) Confocal laser scanning microscopy (CLSM) characterization of 4T1 cells that were treated with different formulations, and the corresponding statistical histogram analysis of MFI was given on the right side. Scale bar: 10 μm. (D) Flow cytometry analysis of 4T1 cells that were incubated under 4 °C, medium or 10 mM Ca2+. (E) CLSM imaging of 4T1 cells that were incubated with the aforementioned different formulations, and the corresponding statistical histogram analysis of MFI was given on the right side. Scale bar: 10 μm. Data are represented as mean ± SD (n = 3), ***P < 0.001. | ||
Tumor-specific and sensitive ATP imaging with MnCD
Encouraged by its success in GSH-controlled ATP imaging in cancer cells, the potential of MnCD to illuminate the tumor site was further investigated. Before in vivo experiments, the biocompatibility of MnCD was explored by the hemolytic test (Fig. S15†). No significant hemolysis phenomenon occurred with even as high as 100 μg mL−1 of MnCD, proving the good biocompatibility of our DNA nanoprobe. Subsequently, 4T1 cells were subcutaneously injected into BALB/c female nude mice to establish a tumor-bearing mice model. Mice with a tumor volume of about 100 mm3 were randomly divided into 3 groups and respectively treated with MnCD, MnC, and CMnCD via intratumoral injection (Fig. 4A). As time extended, the fluorescence signal from the tumor site gradually increased and reached a maximum value at 4 h (Fig. S16†). Owing to the excellent amplification capability of MnCD, the MnCD-treated mice displayed higher fluorescence than the MnC-treated mice, while the CMnCD-treated mice exhibited a negligible fluorescence output due to no intact DNAzyme structure generation. After 16 h, the 4T1-bearing mice were dissected to assess the fluorescence intensity of the tumor and the corresponding organs. As expected, the mice injected with MnCD had the highest intratumoral fluorescence intensity (Fig. S17†). Additionally, we regulated GSH levels in tumor tissues to validate the dependence of MnCD activation on GSH expression in vivo. The mice pretreated with GSH inhibitor buthionine sulfoximine (BSO)51 revealed a weaker fluorescence signal (Fig. 4B and C), whereas the GSH promotor (NAC)-pretreated mice displayed a marked increase in fluorescence.52 Similarly, when ATP was up-regulated or down-regulated at the tumor site, the corresponding fluorescence readout was positively correlated with the ATP content (Fig. 4D and E). These data demonstrated that our biomarker-stimulated MnCD can achieve accurate ATP imaging in cancer cells both in vitro and in vivo.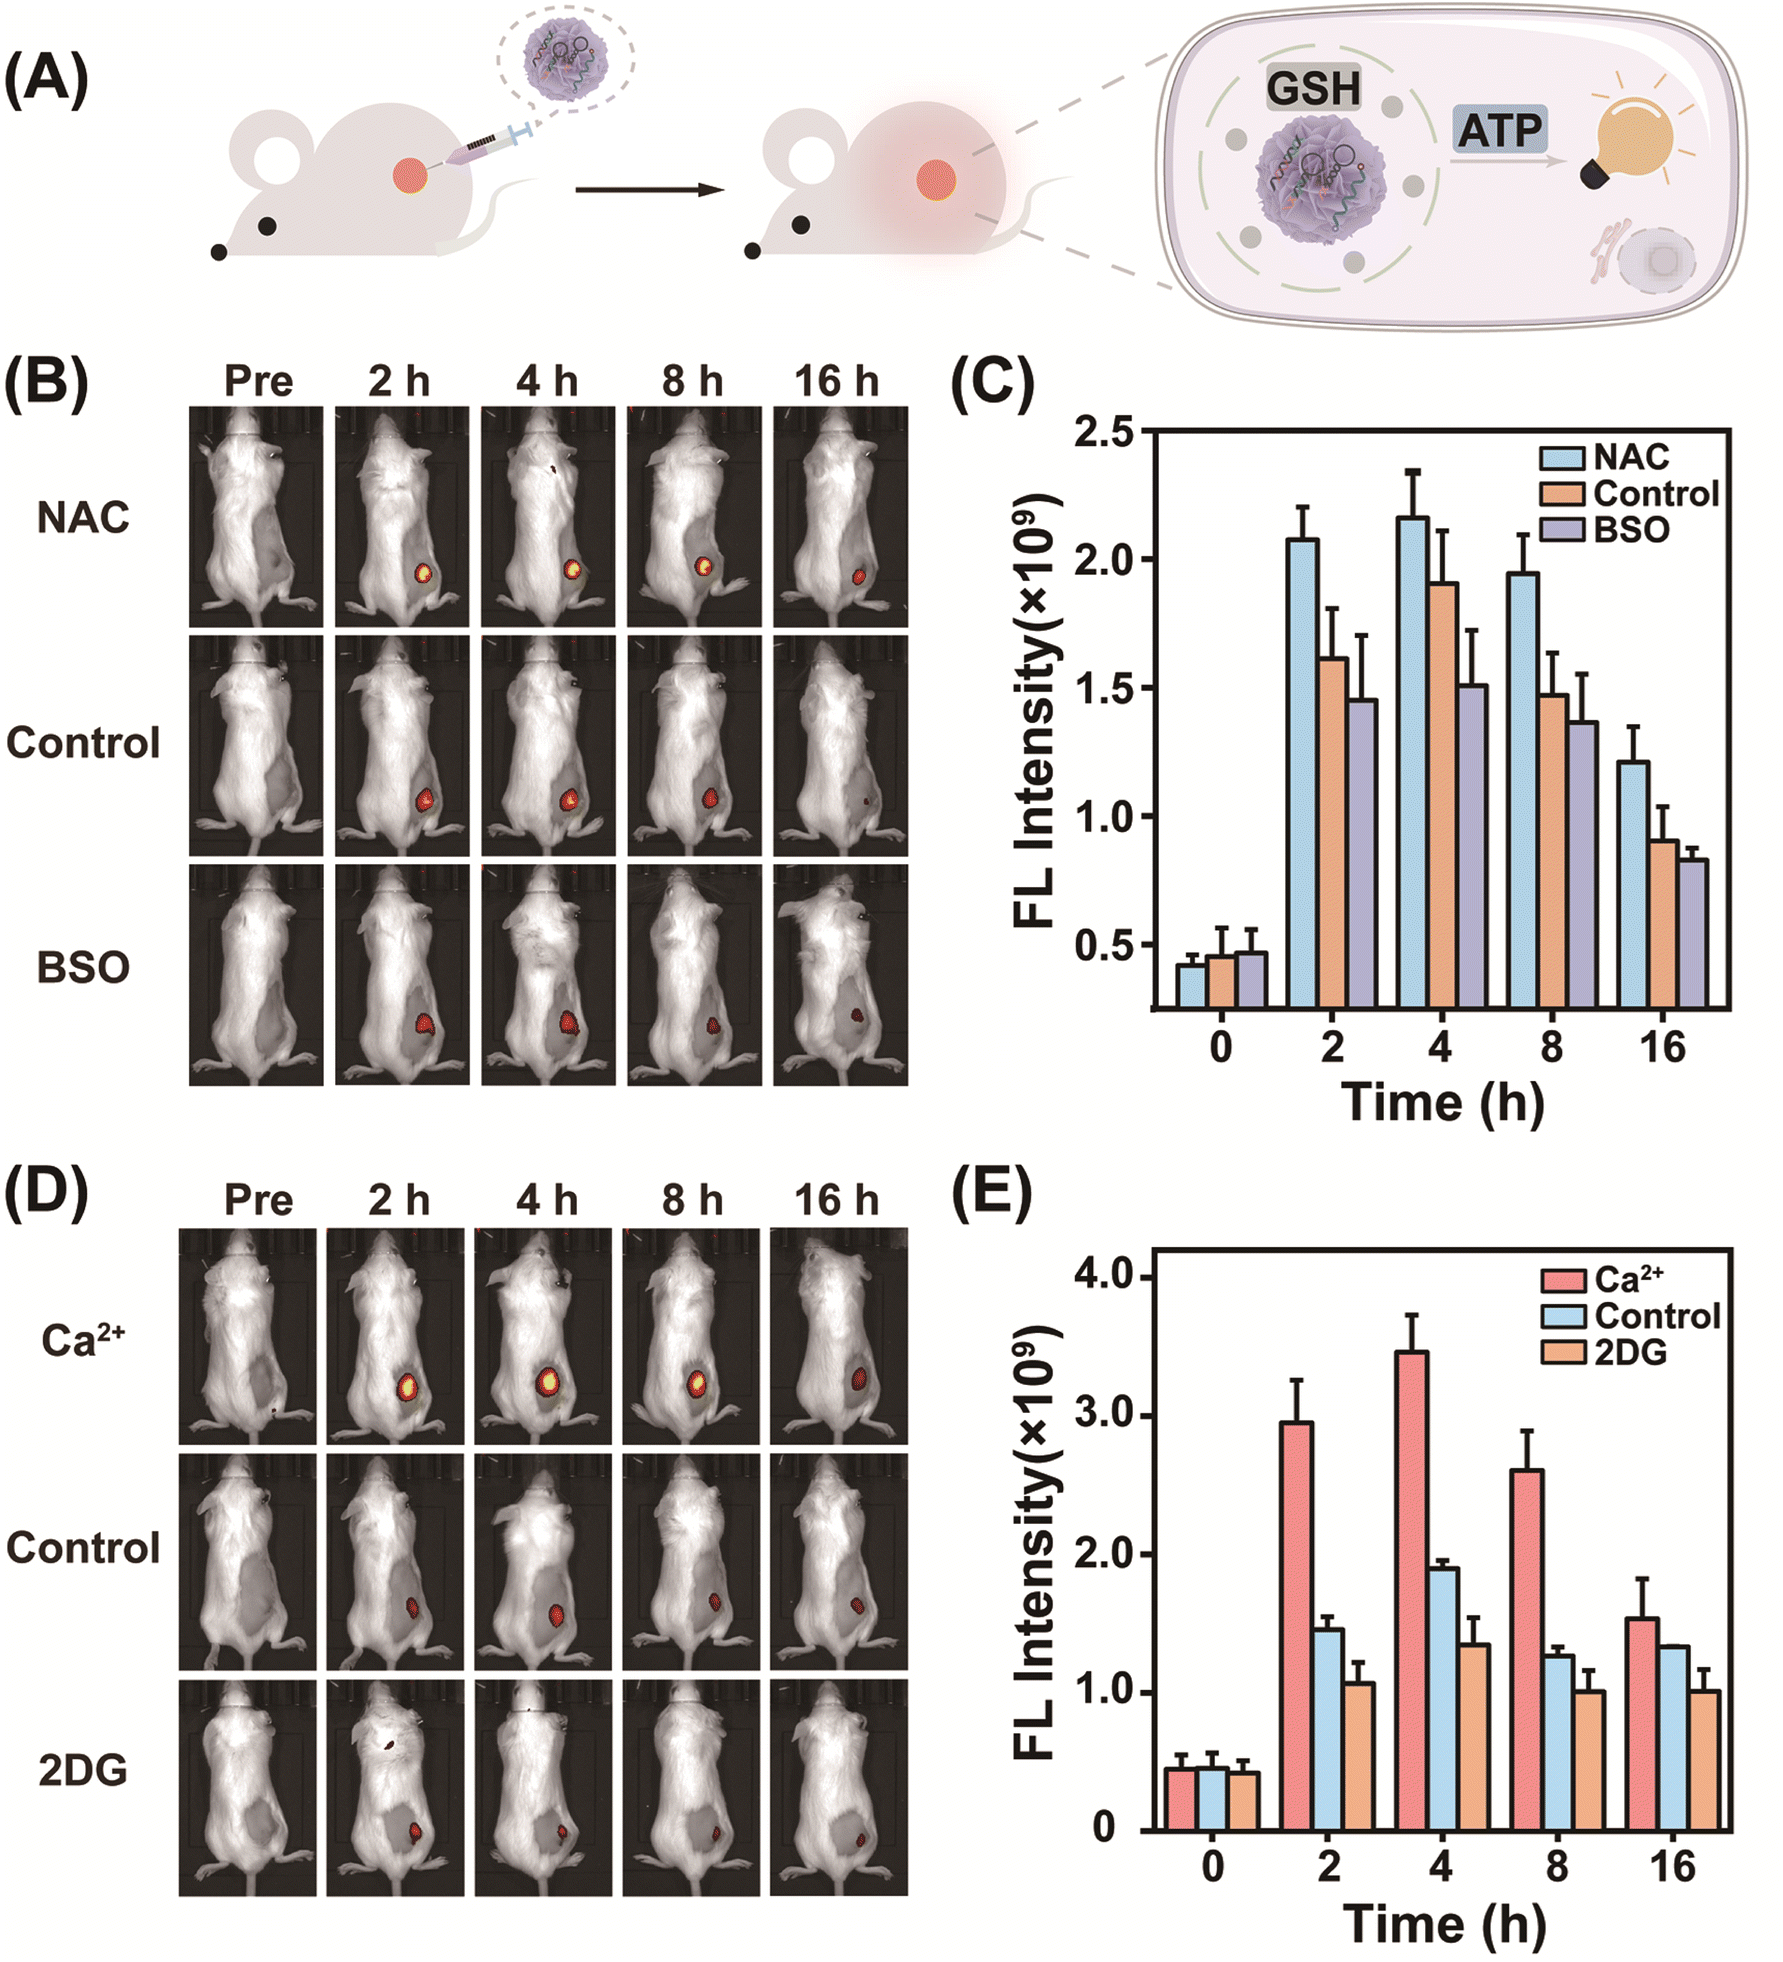 | ||
| Fig. 4 High-fidelity in vivo ATP imaging using the multiple biomarker-activated nanoprobe. (A) Illustration of the tumor-specific activatable nanoprobe for in vivo ATP imaging by intratumoral injection. (B) Fluorescence images of 4T1 tumor-bearing mice at 0, 2, 4, 8, and 16 h. The mice were pretreated with NAC (GSH promotor), BSO (GSH inhibitor), or PBS (control), followed by MnCD incubation. (C) Quantification of fluorescence intensity at the tumor site in (B). (D) Fluorescence imaging of 4T1 tumor-bearing mice. Ca2+ (ATP promotor), 2-deoxy-D-glucose (2DG, ATP inhibitor), or PBS (control) was primarily injected into the tumors, and then MnCD was injected. (E) Quantification of fluorescence intensity at the tumor site in (D). Data are represented as mean ± SD (n = 3). | ||
MnCD as a theranostic nanoprobe for activatable photodynamic therapy
Due to the good expansibility of the modular DNA-based nanoprobe, the MnCD holds promise for tumor-specific activated photodynamic (PDT) therapy through simple replacement of the signal output component from the fluorescence group to photosensitizer chlorin e6 (Ce6)53 as shown in Fig. 5A. Initially, Ce6 was positioned in a close proximity to the corresponding BHQ-2 quencher, resulting in a low photodynamic activity. Once activated by the overexpressed GSH in cancer cells, the ATP-initiated CHA-amplified DNAzyme triggered the cyclic cleavage of S, leading to the continuous recovery of the photodynamic activity of Ce6. Consequently, under light irradiation, Ce6 produced singlet oxygen (1O2) to kill cancer cells. The 3-(4,5-dimethylthialzol-2-yl)-2,5-diphenyltetrazolium bromide (MTT) assay indicated that MnCD obviously exhibited dose-dependent cytotoxicity upon laser irradiation (Fig. 5B). Then, 4T1 cells were respectively treated with PBS (I), MnO2 NPs (II), MnCD (III), PBS under photoirradiation (IV), MnO2 NPs under photoirradiation (V), and MnCD under photoirradiation (VI). To measure the intracellular reactive oxygen species (ROS) level, 2′,7′-dichlorofluorescein diacetate (DCFH-DA, 1O2 probe) was used for fluorescence analysis.54 Upon photoirradiation, the MnCD-treated cells showed an enhanced fluorescence signal (Fig. 5C and D). In contrast, the MnO2 NPs and MnCD revealed negligible cytotoxicity. Cell apoptosis analysis also revealed that MnCD treatment under laser irradiation exhibited the lowest cell survival rate (Fig. 5E). These results indicated that MnCD under irradiation could induce the generation of intracellular 1O2 and promote cell apoptosis. Therefore, our MnCD can be considered as a promising and versatile candidate for activated photodynamic therapy.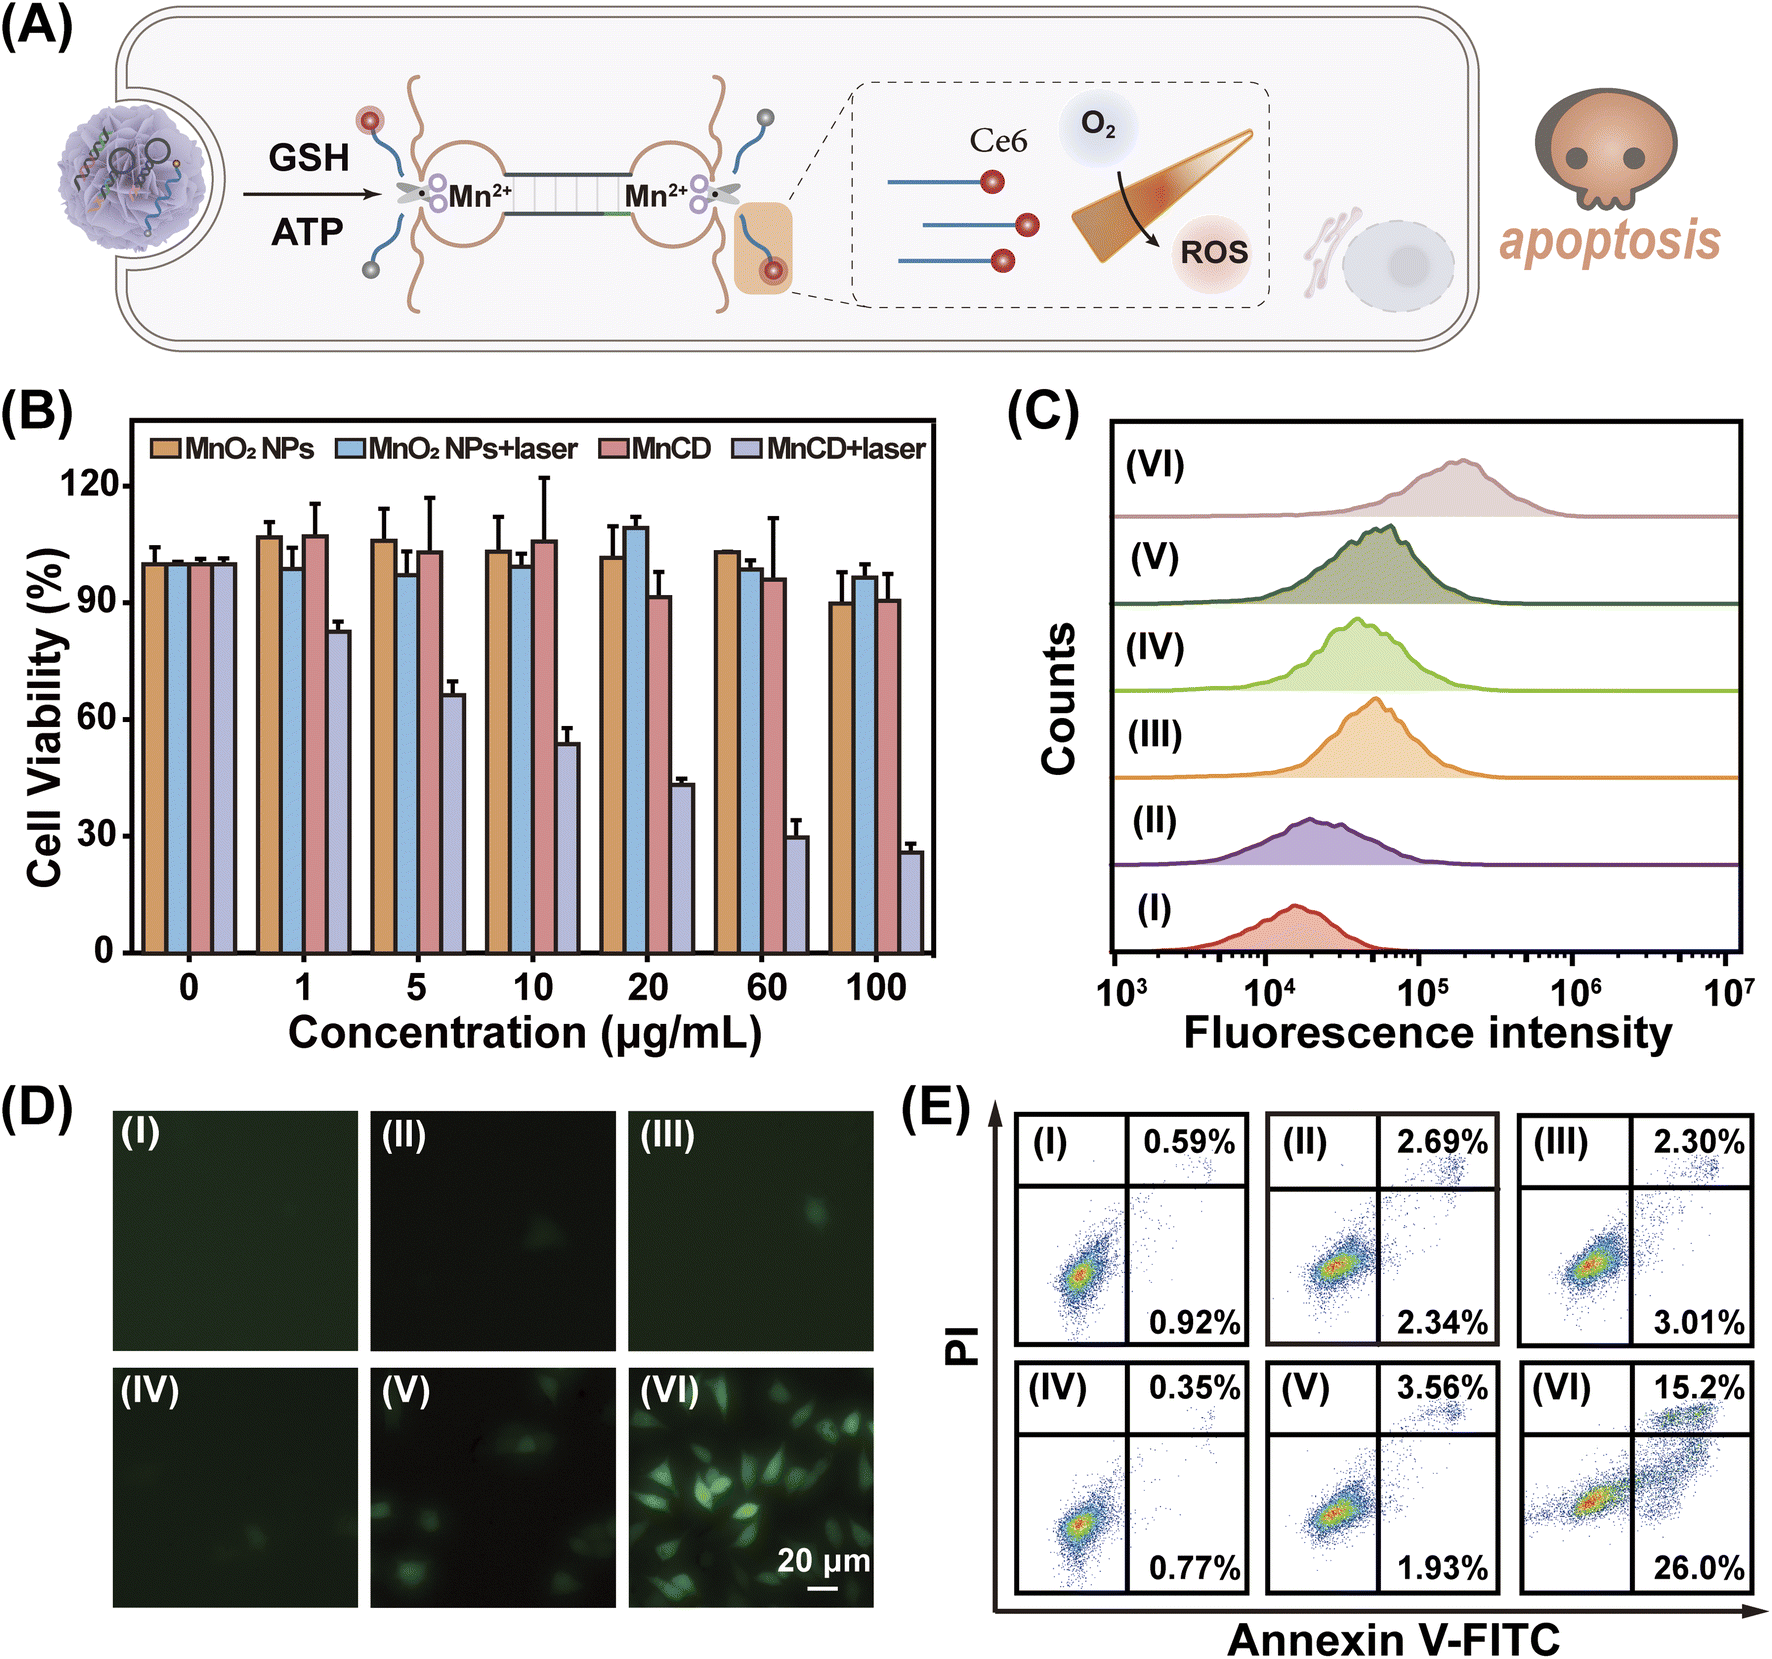 | ||
| Fig. 5 Enhanced ROS generation with a switchable DNA nanoprobe for in vitro phototherapy. (A) Illustration of the Ce6-modified DNA nanoprobe for ATP-activated PDT therapy in cancer cells. (B) Cell viability of 4T1 cells incubated with MnO2 NPs or MnCD with or without laser irradiation. Data denote the mean ± SD (n = 3). (C) and (D) Flow cytometric analysis (C) and CLSM images (D) of intracellular ROS of 4T1 cells under different treatments. (E) Flow cytometric analysis of the apoptotic cell population after different treatments. (I) PBS, (II) MnO2 NPs, (III) MnCD, (IV) PBS plus laser, (V) MnO2 NPs plus laser, and (VI) MnCD plus laser. Laser, 660 nm; power density, 0.2 W cm−2; irradiation time, 5 min. | ||
Conclusions
We have fabricated a tumor-specific activatable nanoprobe consisting of MnO2 nanoparticles and a cascade amplifier for accurate and sensitive visualization of ATP in cancer cells both in vitro and in vivo. Here, intracellular ATP monitoring using the cascade amplifier consists of a three-step process. First, aptamers with high affinity can bind to ATP for exposing the initiator. Then, under the inducement of the initiator, the amplifier undergoes the CHA reaction to produce massive well-assembled DNAzymes. Ultimately, with the help of cofactors, the DNAzymes restore catalytic activity and cyclically cleave their substrates, generating an amplified readout signal. Of note, owing to the high specificity of aptamers, the amplifier can easily distinguish ATP from its analogues. Importantly, by integration of CHA and DNAzyme reactions with amplifying capability, our cascade amplifier possesses high sensing efficiency compared with the single-stage CHA or DNAzyme amplifier, indicating that it may be more suitable for the assay of intracellular low-abundance ATP. Furthermore, the MnO2 nanocarrier provides a double guarantee for the ATP-responsive probe to precisely perform sensing function in cancer cells. On the one hand, its GSH-responsiveness enables the accurate delivery of the cascade amplifier to cancer cells. On the other hand, the degraded MnO2 nanoparticle provides adequate cofactors for the following DNAzyme catalytic reaction. Consequently, our DNA nanoprobe realizes the monitoring of ATP dynamics in cancer cells where the ATP-activated PDT is also achieved. This homogeneous cascade catalytic circuit-based aptasensing strategy enables the study of a critical active molecule-involved biological process, and thus holds great promise in understanding the associated physiological mechanism.Ethical statement
All animal experiments were carried out according to the Principles of Laboratory Animal Care (People's Republic of China). The animal protocol was under the approval of the Laboratory Animal Welfare and Ethics Committee Training Practitioner Institute of Hubei Province (AUP number: WP20210446).Data availability
All experimental data is available in the ESI.†Author contributions
Z. Zou and X. Liu conceived the study and designed the experiment. Z. Zou performed the main experiments and analysed the data. M. Pan, F. Mo and Y. Zhou assisted with cell experiments. Q. Jiang and A. Feng assisted with the animal experiments and discussion. F. Wang and X. Liu revised and finalized the manuscript. All authors participated in the writing of the manuscript.Conflicts of interest
There are no conflicts to declare.Acknowledgements
This work was supported by the Natural Science Foundation of Jiangsu Province (BK20221258), the National Natural Science Foundation of China (22274121, 22274123 and 21874103), and the Fundamental Research Funds for the Central Universities (2042022kf1175).Notes and references
- O. Kepp, F. Loos, P. Liu and G. Kroemer, Immunol. Rev., 2017, 280, 83–92 CrossRef CAS PubMed.
- J. Wang, Y. Jiang, C. Zhou and X. Fang, Anal. Chem., 2005, 77, 3542–3546 CrossRef CAS PubMed.
- A. M. Rice and M. K. Rosen, Science, 2017, 356, 701–702 CrossRef CAS PubMed.
- A. Patel, L. Malinovska, S. Saha, J. Wang, S. Alberti, Y. Krishnan and A. A. Hyman, Science, 2017, 356, 753–756 CrossRef CAS PubMed.
- A. V. Gourine, E. Llaudet, N. Dale and K. M. Spyer, Nature, 2005, 436, 108–111 CrossRef CAS PubMed.
- Y. Zhou, L. Yang, J. Wei, K. Ma, X. Gong, J. Shang, S. Yu and F. Wang, Anal. Chem., 2019, 91, 15229–15234 CrossRef CAS PubMed.
- T. K. Ulland, W. M. Song, S. C.-C. Huang, J. D. Ulrich, A. Sergushichev, W. L. Beatty, A. A. Loboda, Y. Zhou, N. J. Cairns, A. Kambal, E. Loginicheva, S. Gilfillan, M. Cella, H. W. Virgin, E. R. Unanue, Y. Wang, M. N. Artyomov, D. M. Holtzman and M. Colonna, Cell, 2017, 170, 649–663 CrossRef CAS PubMed.
- D. C. Wallace, Science, 1999, 283, 1482–1488 CrossRef CAS PubMed.
- G. G. Yegutkin and D. Boison, Pharmacol. Rev., 2022, 74, 799–824 CrossRef PubMed.
- F. Mimoto, K. Tatsumi, S. Shimizu, S. Kadono, K. Haraya, M. Nagayasu, Y. Suzuki, E. Fujii, M. Kamimura, A. Hayasaka, H. Kawauchi, K. Ohara, M. Matsushita, T. Baba, H. Susumu, T. Sakashita, T. Muraoka, K. Aso, H. Katada, E. Tanaka, K. Nakagawa, M. Hasegawa, M. Ayabe, T. Yamamoto, S. Tanba, T. Ishiguro, T. Kamikawa, T. Nambu, T. Kibayashi, Y. Azuma, Y. Tomii, A. Kato, K. Ozeki, N. Murao, M. Endo, J. Kikuta, M. Kamata-Sakurai, M. Ishii, K. Hattori and T. Igawa, Cell Rep., 2020, 33, 108542 CrossRef CAS PubMed.
- C. Zhang, Z. Liu, X. Liu, L. Wei, Y. J. Liu, J. Yu and L. X. Sun, Acta Pharm. Sin. B, 2013, 3, 254–262 CrossRef.
- O. Warburg, Science, 1956, 123, 309–314 CrossRef CAS PubMed.
- H. Cheng, Z. Sun, N. Kwon, R. Wang, Y. Cui, C. O. Park and J. Yoon, Chem.–Eur. J., 2019, 25, 3501–3504 CrossRef CAS PubMed.
- M. Huang, L. Yang, X. Peng, S. Wei, Q. Fan, S. Yang, X. Li, B. Li, H. Jin, B. Wu, J. Liu and H. Li, J. Exp. Clin. Cancer Res., 2020, 39, 185–198 CrossRef CAS PubMed.
- Y. Zhou, F. Tozzi, J. Chen, F. Fan, L. Xia, J. Wang, G. Gao, A. Zhang, X. Xia, H. Brasher, W. Widger, L. M. Ellis and Z. Weihua, Cancer Res., 2012, 72, 304–314 CrossRef CAS PubMed.
- X.-R. Song, S.-H. Li, H. Guo, W. You, D. Tu, J. Li, C.-H. Lu, H.-H. Yang and X. Chen, Adv. Sci., 2018, 5, 1801201–1801210 CrossRef PubMed.
- W.-H. Chen, X. Yu, W.-C. Liao, Y. S. Sohn, A. Cecconello, A. Kozell, R. Nechushtai and I. Willner, Adv. Funct. Mater., 2017, 27, 1702102 CrossRef.
- E. D. Grosso, Nat. Chem., 2022, 14, 600–613 CrossRef PubMed.
- J. Wei, H. Wang, X. Gong, Q. Wang, H. Wang, Y. Zhou and F. Wang, Nucleic Acids Res., 2020, 48, e60 CrossRef CAS PubMed.
- Q. Wang, K. Tan, H. Wang, J. Shang, Y. Wan, X. Liu, X. Weng and F. Wang, J. Am. Chem. Soc., 2021, 143, 6895–6904 CrossRef CAS PubMed.
- Z. Huang, L. Qiu, T. Zhang and W. Tan, Matter, 2021, 4, 461–489 CrossRef CAS.
- J. Wang, S. Yu, Q. Wu, X. Gong, S. He, J. Shang, X. Liu and F. Wang, Angew. Chem., Int. Ed., 2021, 60, 10766–10774 CrossRef CAS PubMed.
- X. Gong, R. Li, J. Wang, J. Wei, K. Ma, X. Liu and F. Wang, Angew. Chem., Int. Ed., 2020, 59, 21648–21655 CrossRef CAS PubMed.
- M. R. Dunn, R. M. Jimenez and J. C. Chaput, Nat. Rev. Chem., 2017, 1, 0076 CrossRef CAS.
- C. Hong, X. Zhang, S. Ye, H. Yang, Z. Huang, D. Yang, R. Cai and W. Tan, ACS Appl. Mater. Interfaces, 2021, 13, 19695–19700 CrossRef CAS PubMed.
- J. Lai, S. Li, X. Shi, J. Coyne, N. Zhao, F. Dong, Y. Mao and Y. Wang, Chem. Sci., 2017, 8, 7306–7311 RSC.
- J.-M. Oh, C. C. Venters, C. Di, A. M. Pinto, L. Wan, I. Younis, Z. Cai, C. Arai, B. R. So, J. Duan and G. Dreyfuss, Nat. Commun., 2020, 11, 1–8 CrossRef CAS PubMed.
- F. Wang, Q. Li, P. Zhang, X. Liu, A. Li, J. Yang and D. Liu, ACS Sens., 2018, 3, 2702–2708 CrossRef CAS PubMed.
- X. Zheng, R. Peng, X. Jiang, Y. Wang, S. Xu, G. Ke, T. Fu, Q. Liu, S. Huan and X. Zhang, Anal. Chem., 2017, 89, 10941–10947 CrossRef CAS PubMed.
- C. Wu, T. Chen, D. Han, M. You, L. Peng, S. Cansiz, G. Zhu, C. Li, X. Xiong, E. Jimenez, C. J. Yang and W. Tan, ACS Nano, 2013, 7, 5724–5731 CrossRef CAS PubMed.
- H.-M. Meng, X. Zhang, Y. Lv, Z. Zhao, N.-N. Wang, T. Fu, H. Fan, H. Liang, L. Qiu, G. Zhu and W. Tan, ACS Nano, 2014, 8, 6171–6181 CrossRef CAS PubMed.
- Y. Yang, J. Huang, X. Yang, K. Quan, H. Wang, L. Ying, N. Xie, M. Ou and K. Wang, Anal. Chem., 2016, 88, 5981–5987 CrossRef CAS PubMed.
- H. Wang, Y. Chen, H. Wang, X. Liu, X. Zhou and F. Wang, Angew. Chem., Int. Ed., 2019, 58, 7380–7384 CrossRef CAS PubMed.
- Y. Zhao, R. Li, J. Sun, Z. Zou, F. Wang and X. Liu, ACS Nano, 2022, 16, 5404–5417 CrossRef CAS PubMed.
- J. Wei, H. Wang, Q. Wu, X. Gong, K. Ma, X. Liu and F. Wang, Angew. Chem., Int. Ed., 2020, 59, 5965–5971 CrossRef CAS PubMed.
- Y. Gao, Y. Chen, J. Shang, S. Yu, S. He, R. Cui and F. Wang, ACS Appl. Mater. Interfaces, 2022, 14, 5080–5089 CrossRef CAS PubMed.
- F. Di Virgilio, A. C. Sarti, S. Falzoni, E. De Marchi and E. Adinolfi, Nat. Rev. Cancer, 2018, 18, 601–618 CrossRef CAS PubMed.
- B. Liu, R. Ma, J. Zhao, Y. Zhao and L. Li, Sci. China: Chem., 2020, 63, 1490–1497 CrossRef CAS.
- C.-H. Zhang, H. Wang, J.-W. Liu, Y.-Y. Sheng, J. Chen, P. Zhang and J.-H. Jiang, ACS Sens., 2018, 3, 2526–2531 CrossRef CAS PubMed.
- F. Gao, J. Wu, Y. Yao, Y. Zhang, X. Liao, D. Geng and D. Tang, RSC Adv., 2018, 8, 28161–28171 RSC.
- X. Chen, N. Briggs, J. R. McLain and A. D. Ellington, Proc. Natl. Acad. Sci. U. S. A., 2013, 110, 5386–5391 CrossRef CAS PubMed.
- R. Wu, Z. Zhu, X. Xu, C. Yu and B. Li, Nanoscale, 2019, 11, 10339–10347 RSC.
- C. Wang, H. Lin, X. Ge, J. Mu, L. Su, X. Zhang, M. Niu, H. Yang and J. Song, Adv. Funct. Mater., 2021, 31, 2009942 CrossRef CAS.
- H. Fan, Z. Zhao, G. Yan, X. Zhang, C. Yang, H. Meng, Z. Chen, H. Liu and W. Tan, Angew. Chem., Int. Ed., 2015, 54, 4801–4805 CrossRef CAS PubMed.
- X. Li, S. Kolemen, J. Yoon and E. U. Akkaya, Adv. Funct. Mater., 2017, 27, 1604053 CrossRef.
- M. J. Cromie, Y. Shi, T. Latifi and E. A. Groisman, Cell, 2006, 125, 71–84 CrossRef CAS PubMed.
- C. Wang, F. Cao, Y. Ruan, X. Jia, W. Zhen and X. Jiang, Angew. Chem., Int. Ed., 2019, 58, 9846–9850 CrossRef CAS PubMed.
- Y. Zhou, L. Zou, G. Li, T. Shi, S. Yu, F. Wang and X. Liu, Anal. Chem., 2021, 93, 13960–13966 CrossRef CAS PubMed.
- E. J. Griffiths and G. A. Rutter, Biochim. Biophys. Acta, 2009, 1787, 1324–1333 CrossRef CAS PubMed.
- Q. Wu, L. Yang, L. Xie, J. Shang, S. He, J. Liu and F. Wang, Small, 2022, 18, 2200983 CrossRef CAS PubMed.
- Z. Dong, L. Feng, Y. Chao, Y. Hao, M. Chen, F. Gong, X. Han, R. Zhang, L. Cheng and Z. Liu, Nano Lett., 2019, 19, 805–815 CrossRef CAS PubMed.
- E. Piskounova, M. Agathocleous, M. M. Murphy, Z. Hu, S. E. Huddlestun, Z. Zhao, A. M. Leitch, T. M. Johnson, R. J. DeBerardinis and S. J. Morrison, Nature, 2015, 527, 186–191 CrossRef CAS PubMed.
- X. Li, S. Kolemen, J. Yoon and E. U. Akkaya, Adv. Funct. Mater., 2017, 27, 1604053 CrossRef.
- Z. Xu, F. Zhang, C. Bai, C. Yao, H. Zhong, C. Zou and X. Chen, J. Exp. Clin. Cancer Res., 2017, 36, 124 CrossRef PubMed.
Footnote |
| † Electronic supplementary information (ESI) available: Experimental details; additional characterization and in vitro and in vivo analyses. See https://doi.org/10.1039/d2sc04560e |
| This journal is © The Royal Society of Chemistry 2022 |