
 Open Access Article
 This Open Access Article is licensed under a Creative Commons Attribution-Non Commercial 3.0 Unported Licence
Unraveling the origin of reductive stability of super-concentrated electrolytes from first principles and unsupervised machine learning†
Feng
Wang
and
Jun
Cheng
 *
*
State Key Laboratory of Physical Chemistry of Solid Surfaces, iChEM, College of Chemistry and Chemical Engineering, Xiamen University, Xiamen 361005, China. E-mail: chengjun@xmu.edu.cn
First published on 15th September 2022
Abstract
Developing electrolytes with excellent electrochemical stability is critical for next-generation rechargeable batteries. Super-concentrated electrolytes (SCEs) have attracted great interest due to their high electrochemical performances and stability. Previous studies have revealed changes in solvation structures and shifts in lowest unoccupied molecular orbitals from solvents to anions, promoting the formation of an anion-derived solid-electrolyte-interphase (SEI) in SCE. However, a direct connection at the atomic level to electrochemical properties is still missing, hindering the rational optimization of electrolytes. Herein, we combine ab initio molecular dynamics with the free energy calculation method to compute redox potentials of propylene carbonate electrolytes at a range of LiTFSI concentrations, and moreover employ an unsupervised machine learning model with a local structure descriptor to establish the structure–property relations. Our calculation indicates that the network of TFSI− in SCE not only helps stabilize the added electron and renders the anion more prone to reductive decomposition, but also impedes the solvation of F− and favors LiF precipitation, together leading to effective formation of protective SEI layers. Our work provides new insights into the solvation structures and electrochemistry of concentrated electrolytes which are essential to electrolyte design in batteries.
With increased public awareness on energy and environmental issues, much effort has been made to develop lithium-ion batteries (LIB) with high safety and high energy density.1–4 The safety and energy density of the LIBs are however impeded by the narrow electrochemical stability windows of electrolytes, which are affected by the solid-electrolyte-interphase (SEI) from reductive decomposition of electrolytes on electrode surfaces. During the first charging process of a LIB, a large negative potential is applied on the graphite anode,5–7 and ethylene carbonate based electrolytes decompose at about 0.7 V vs. Li+/Li(s) and a self-limiting SEI is formed, ensuring the stability and safety of the LIB.1,3,8,9 However, not all electrolytes are capable of depositing a stable SEI on anode surfaces, which restricts the use of a wide variety of solvents. For instance, for propylene carbonate based electrolytes, Li+ cannot be reduced and intercalated into a graphite anode due to severe decomposition of the electrolytes without the protection of the SEI.10
A promising strategy to enhance the electrolyte stability is the use of super-concentrated electrolytes (SCE).11 It has been well established that the concentration of Li-salt, e.g. lithium bis(trifluoromethanesulfonyl)imide (LiTFSI), in an electrolyte has significant impact on its electrochemical properties; in particular, when the concentration increases to over 3 mol L−1, the electrochemistry can undergo dramatic changes.10,12–25 SEI layers are not stable on anode surfaces in low concentration systems, and reductive degradation of electrolytes cannot be prevented. When the salt concentration is increased into the super-concentrated region, the reductive decomposition of electrolytes is inhibited by an anion-derived SEI.12,16,23,26–31 Also, an anion-derived SEI that is stable in highly concentrated electrolytes, cannot survive when transferring the SEI covered anode into low concentration electrolytes.32–34 Understanding these concentration effects on the formation and degradation of an SEI at a molecular level would help facilitate the design of electrolytes with high safety and stability.4,18,28,32
In recent years, extensive spectroscopic investigations, as well as molecular dynamics (MD) and electronic structure calculations, have been undertaken to obtain a microscopic understanding of concentration effects on the structures and electrochemistry of electrolytes and electrode–electrolyte interfaces.35–44 For example, by using Raman spectroscopy, Yamada et al. found the solvation structures of contact–ion pairs (CIPs) and aggregates (AGGs) in SCE, which are distinct from those of solvent-separated ion pairs (SSIPs) in low concentration electrolytes.15 By analyzing the solvation structures from MD trajectories and the projected density of states (PDOS), it has been shown that when increasing the concentration the lowest unoccupied molecular orbitals (LUMO) shift their position from solvent molecules to anions, suggesting that anions become more susceptible to reduction to form a protective SEI.15,17,45,46 Moreover, Sodeyama et al. suggested that the number of reducible anions is different in super-concentrated and low concentration electrolytes, and in the latter cases is insufficient for effective formation of an SEI.45
The highest occupied molecular orbital (HOMO) and LUMO are often used in literature to indicate the redox properties of electrolytes. However, the electrochemical stability windows of electrolytes are thermodynamic properties that are determined by the redox potentials (free energies) of solvated redox couples, not by the molecular orbital energies.47 Note that a redox species with a more positive redox potential tends to be more easily reduced. For example, liquid water has a fundamental band gap of 8.7 eV, in contrast to an electrochemical stability window of only 1.23 V.48,49 Also note that stable SEI layers could be formed at many low concentration electrolyte/anode interfaces during the initial charging process in spite of the limited number of reducible anions. Additionally, SCE diluted with inert solvents exhibits excellent SEI stability at low concentrations due to the preservation of solvation structures in SCE and the formation of an anion-derived SEI.50–54 Therefore, it is the unique solvation structures and redox properties of SCE, rather than the number of reducible anions and LUMO positions, that determine the electrochemical stability windows of SCEs.15,17,45 How the solvation structures of SCE affect the electrochemical stability and generation of SEI remains a puzzle hindering rational optimization of electrolytes.
In this work, aiming to unravel this puzzle, we perform all-atom ab initio molecular dynamics (AIMD) simulations of electrolytes based on propylene carbonate (PC) at a range of LiTFSI concentrations. One electron reduction potentials of TFSI− are computed using the free energy calculation method, and a novel computational Li reference electrode is devised so that the computed potentials at different concentrations can be meaningfully compared with each other and against experiments. Our calculation demonstrates that as the LiTFSI concentration increases, the reduction potential of TFSI− shifts to more positive values, indicating easier reduction and generation of an anion-derived SEI in SCE. To investigate the concentration effects on the solubility of an anion-derived SEI, we calculate the dissolution free energies of LiF, which is one of the main components of an anion-derived SEI,23 at different concentrations. It is found that the LiF solubility in SCE is lower than in low concentration electrolytes, supporting that the anion-derived SEI is stable in SCE but not at low concentrations. Furthermore, we propose a structural analysis method based on unsupervised machine learning and smooth-overlap-of-atomic-position (SOAP) descriptors, helping resolve the correlation between the solvation structures and electrochemical properties. Our work would facilitate the optimization and design of electrolytes with superior electrochemical performances based on the modification of solvation structures.
Results and discussion
As shown in Fig. 1, a series of PC based electrolyte models are built with different concentrations of LiTFSI. Cubic supercells under periodic boundary conditions (PBC) with 16.509 Å are used, which contain about 400 atoms, and the electrolyte densities are close to the experimental values with errors of less than 3%55 (see more details in Table S1†). These models cover a concentration window ranging from 0.37 to 3.69 mol L−1. AIMD simulations are performed by using the freely available CP2K/Quickstep package.56 The BLYP functional57,58 is employed with the Grimme D3 dispersion correction,59 and the hybrid functional HSE06 is used to check the accuracy of the calculated electronic density of states and redox potentials. One electron reduction potentials of TFSI− and dissolution free energies of LiF are calculated with free energy perturbation (FEP) theory and the thermodynamic integration (TI) method, in which tens to a hundred of pico-seconds of AIMD runs are often required to achieve statistical convergence so that the statistical uncertainties of computed free energies are about 0.1 eV.60–62 Detailed descriptions on the computational setup and free energy calculation method, as well as implementation of the computational Li reference electrode, are provided in the (ESI).† | ||
| Fig. 1 Simulation supercells of (a) liquid PC and PC with (b) 0.37, (c) 1.11, (d) 1.84, (e) 2.58 and (f) 3.69 mol L−1 LiTFSI. These six configurations are snapshots taken from AIMD trajectories. The C, H, O, N, S, F and Li atoms are in gray, white, red, blue, yellow, green and pink, respectively. | ||
Electronic structures
The projected electronic densities of states (PDOS) of PC solutions containing different concentrations of LiTFSI are averaged along AIMD trajectories, and plotted in Fig. 2. As the concentration of LiTFSI increases, the LUMO shifts to a lower energy level and the contribution of TFSI− to the LUMO also increases. It was proposed in the literature that localization of the LUMO on anions leads to better formation of the SEI.15–17 However, the LUMO is already localized on TFSI− at a low concentration of 1.11 mol L−1 LiTFSI according to Fig. 2, and at low concentrations PC undergoes reductive decomposition without effective protection of the SEI.22,23 This finding by using the BLYP functional is also confirmed with calculations by using the hybrid HSE06 functional (see Fig. S1 in the ESI†). Furthermore, the shapes and positions of PDOS of PC and TFSI− are almost the same at different concentrations if they are normalized with respect to the number of molecules or ions, as illustrated in Fig. S2 and S3 in the ESI.† As a consequence, when adding an extra electron into the models, the electron would localize on TFSI− and lead to decomposition of TFSI− during AIMD simulations at both low and high concentrations, which has also been shown by Sodeyama's work.45 Thus, it is evident that the PDOS analysis is inappropriate for differentiating redox properties of the electrolytes between low and high concentrations. | ||
| Fig. 2 Projected electronic density of states (PDOS) of PC solutions with LiTFSI concentrations of 0, 0.37, 1.11, 1.84, 2.58 and 3.69 mol L−1. They are averaged every 50 fs along AIMD trajectories of the last 10 ps. The functional used is BLYP. | ||
Redox potentials
It should be clarified that it is the redox potentials that determine the electrochemical stability of electrolytes. Computation of redox potentials from AIMD combined with the FEP-TI method has been established in previous publications60,61,63 and summarized in the ESI.† In this work a computational Li reference electrode38,40 is used to restore the potential reference under PBC in a similar spirit to the previously developed computational standard hydrogen electrode (cSHE)61,63,64 and Ag/AgCl electrode.65 To validate the computational Li reference electrode, we have benchmarked the Li+(aq)/Li(s) potential vs. SHE (−3.22 V) in aqueous solution using the FEP-TI method, which is in good agreement with the experimental value (−3.04 V), as shown in the ESI.† The one electron reduction potentials of TSFI− in PC solutions with different concentrations are computed using the AIMD based free energy calculation method, and the redox levels vs. Li+/Li(s), together with the corresponding vertical energy levels and band positions, are plotted and shown in Fig. 3. Note that the AIMD trajectories are generated by using the BLYP functional and the energies are then computed with the more accurate hybrid HSE06 functional every 100 fs along the BLYP trajectories. | ||
| Fig. 3 Redox potentials (U, black lines), vertical electron affinities of the oxidized state (EAO, blue lines) and vertical ionization potentials of the reduced states (IPR, red lines) of solvated TFSI−, conduction bands (light blue areas) and valence bands (light pink areas) vs. Li+/Li(s) for PC solutions containing different concentrations of LiTFSI. The gray area indicates the potential of reductive decomposition of PC from the experiment.22,23 The results are computed by using the HSE06 functional and the corresponding values are listed in Table 1 and S2 in the ESI.† The C, H, O, N, S, F and Li atoms are in gray, white, red, blue, yellow, green and pink, respectively. | ||
It was reported in the literature that the PC molecule coordinated with a Li+ tends to be more easily reduced, and two reduced states, without further decomposition, can be obtained, namely, cyclic PC− (cPC−) and ring-opened PC− (oPC−).66,67 Thus, in our AIMD model of PC electrolyte in the dilute limit, we add a Li+ to coordinate with a PC molecule. After inserting an electron, it indeed localizes on the PC molecule coordinated with Li+ after some MD steps, as illustrated in Fig. S4† (also for comparison between BLYP and HSE06). A restraining potential is applied to prevent ring opening of the PC, and thus the obtained redox potential corresponds to that of the redox couple PC/cPC−. Our computed redox potential of PC/cPC− is −0.23 V vs. Li+/Li(s). Note that the reduction of PC is irreversible due to ring opening of PC upon reduction.23,68 Thus, the ring-opened PC− structure is more stable than cyclic PC−, and the energy difference is estimated to be 1.14 eV by using the implicit solvation model (see Fig. S5 and Table S2†), which is similar to that in the previous theoretical work.66 Adding this ring opening energy, we obtain the redox potential of PC/oPC− to be 0.91 V vs. Li+/Li(s), confirming that PC can be readily reduced upon charging.12,23,66 This value is also consistent with the decomposition peak in the voltammogram of PC at different concentrations of LiTFSI (about 0.80 V vs. Li+/Li(s)).23 Note that the difference between the redox potential of PC/cPC− computed from the implicit solvation model (0.7–0.8 V vs. Li+/Li(s)69) and AIMD is caused by the shift in absolute potential of the Li reference electrode. In calculations using the implicit solvation model, the absolute potential of the Li reference electrode is estimated by aligning the experimental standard potential of the Li electrode vs. SHE (−3.05 V) to the absolute potential of the SHE (4.44 V) in aqueous solution.67,69 However, the absolute potentials of both the Li reference electrode and SHE can change considerably from aqueous to non-aqueous electrolytes, which would lead to about a 1 V shift in computed redox potentials by using the implicit solvation model.70–73
For PC solutions containing TFSI−, localization of inserted electron on TFSI− would lead to spontaneous decomposition of TFSI−, and thus for computing the one electron reduction potential a restraining potential is applied to help maintain the integrity of the TFSI− structure. Note that this restraint should not be regarded as a computational artefact but a matter of chemical definition and the configurations with and without restraining potential do not show much difference. The one electron reduction reaction of TFSI− leads to the sequential decomposition of the reduced product even though these two reactions may be strongly coupled. The computed reduction potential of TFSI− is 1.04 V vs. Li+/Li(s) in PC at a low TFSI− concentration of 0.37 mol L−1. This should be compared to the potential of reductive decomposition of electrolytes from the experiment, i.e. 0.7–1.0 V ref. 22,23 (gray area in Fig. 3) and our computed redox potential of PC/oPC−, which indicates that PC would decompose together with TFSI− upon charging at low concentrations. More importantly, our calculation shows that by increasing the TFSI− concentration, the reduction potential of TFSI− becomes more positive, i.e. 1.38 and 1.86 V vs. Li+/Li(s) at 1.84 and 3.69 mol L−1, respectively. This clearly indicates that the concentration has crucial effects on the thermodynamics of TFSI− reduction, and the anion becomes more prone to reductive decomposition to form a protective anion-derived SEI during the initial charging.15,17,20 It should be noted that TFSI− reduction at more positive potentials is important for SEI formation; under these conditions the anode surface is less negatively charged so that more TFSI− anions can get into close proximity to the anode to be reduced.
Dissolution free energies of LiF
It has been found experimentally that reductive decomposition of TFSI− leads to the formation of inorganic LiF, one of the crucial components of the SEI layer at the SCE/anode interface,23 and the electrolyte concentration can significantly affect its stability.15,18 Thus, we further compute the dissolution free energies of LiF (ΔdissALiF) at different concentrations by calculating the solvation free energies of Li+ and F− using the FEP-TI method. To demonstrate the accuracy of this method, ΔdissALiF is computed in liquid PC and the obtained value is 0.14 eV (Table 1) which is close to the experimental value (0.19 eV at 313 K).74 As listed in Table 1, the dissolution free energy of LiF shows a sudden increase in SCE of 3.69 mol L−1 by about 0.6 eV, compared to those at low and medium concentrations. This calculation indicates that the solubility of LiF decreases in SCE, which is in good agreement with the experimental findings that an LiF-based SEI is only stable in SCE.32,75| c (mol L−1) | U o | U oPC/oPC− | CBM | VBM | ΔdissALiF |
|---|---|---|---|---|---|
| 0 | −0.23 (0.05) | 0.91 (1.25) | −0.82 (−0.30) | 6.14 (4.97) | 0.14 |
| 0.37 | 1.04 (0.96) | −0.39 (−0.13) | 6.07 (4.84) | 0.48 | |
| 1.84 | 1.38 (1.46) | 0.11 (0.50) | 6.09 (5.01) | 0.39 | |
| 3.69 | 1.86 (1.81) | 0.72 (0.97) | 6.08 (4.95) | 1.05 |
Combining these computed reduction potentials and solvation energies, we now have a fuller picture of the concentration dependent thermodynamics of the formation of an anion-derived SEI, as illustrated in Fig. 3. At low and medium concentrations, TFSI− undergoes reductive decomposition at relatively negative potentials during charging. However, the solvation free energies of Li+ and F− are so high that LiF cannot readily deposit on the anode surface to prevent further decomposition of electrolytes, and co-intercalation of PC leads to disastrous exfoliation of the graphite anode. In contrast, TFSI− can be reduced in SCE at more positive potentials, and the process is facile due to more anions being available in proximity to the anode. Meanwhile, F− produced from TFSI− decomposition can precipitate with Li+ to form a favorable LiF protection layer on the anode, which is also supported by experiments.23
Local solvation environments of anions
To understand the above computed thermodynamic properties, we further analyze the band positions and solvation structures of the electrolytes at different concentrations. As shown in Fig. 3, the conduction band minimum (CBM) of the electrolyte shifts to a lower position (i.e. more positive in potential) when the concentration increases, while the valence band maximum (VBM) hardly changes. It has been established in previous studies63,76 that according to the Anderson impurity model,77 the solute levels, i.e. the vertical electron affinity of the oxidized state (EAO) and vertical ionization potential of the reduced state (IPR) as indicated by blue lines and red lines in Fig. 3, can shift with the CBM and VBM due to electronic hybridization. Consequently, lowering the CBM in SCE will shift the EAO level down, thus shifting the redox level (black line, N. B. calculated by integrating vertical energies) to a more positive potential.A chemical interpretation of this level shifting mechanism is that lowering the CBM can help stabilize the extra electron in SCE. In order to elucidate the structural origin of this stabilization, we use smooth-overlap-of-atomic-position (SOAP) descriptors78,79 to analyze the local solvation environments of TFSI−. SOAP descriptors expand the local configurations of center atoms into high dimensional vectors in which the structural information is enhanced and encoded. The unsupervised clustering method together with SOAP descriptors has been applied to identify the similarity of chemical environments of center atoms.80,81 In Fig. 4, we show the structural similarity between different local environments of TFSI− anions. The SOAP descriptors of the center of mass of TFSI− anions are generated and clustered by principal component analysis (PCA). We then color-code the data points by using DFT-computed excess Mulliken charges on the respective TFSI− anions in order to help establish the structure–property relationships. The excess Mulliken charges are computed by using the charge difference before and after the vertical insertion of an excess electron, aiming to analyze the localization of the excess electron.
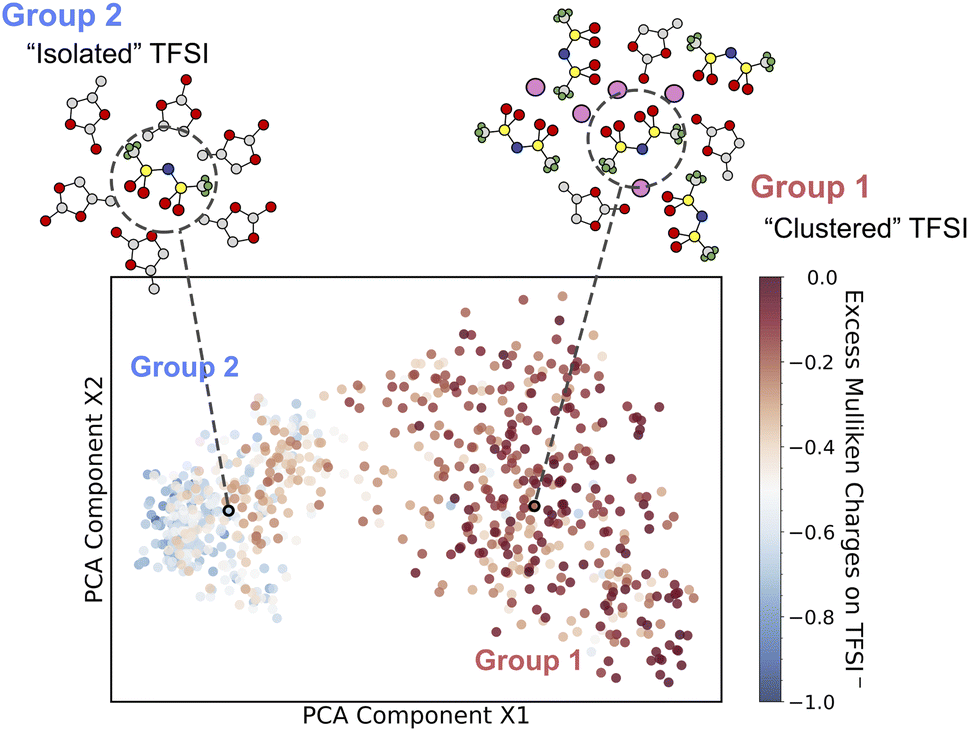 | ||
| Fig. 4 Unsupervised machine learning of solvation environments of TFSI− in PC solution at a range of concentrations. A SOAP-descriptor-based structural similarity map obtained by principal component analysis (PCA) is drawn such that the most dissimilar structures are furthest away and vice versa. Color coding indicates the excess Mulliken charges for each TFSI− anion. Two groups of solvation environments (isolated and clustered) are identified, and two representative solvation structures are included for high and low excess charges on TFSI−. The C, O, N, S, F and Li atoms are in gray, red, blue, yellow, green and pink, respectively. The concentration of each data point is given in Fig. S6.† | ||
Interestingly, the solvation structures of TFSI− appear to fall into two groups based on the local environments involved in a range of concentrations. We discover clustered TFSI− (group 1) with approximately zero excess charge and isolated TFSI− anions (group 2) which have about a unit charge, with a gradual transition between the two groups. At low concentrations, TFSI− anions are separated by PC molecules and the vertically inserted electron localizes on single TFSI−. In contrast, at a highly concentrated region, the vertically inserted electron tends to delocalize over the network of TFSI− anions. To confirm the delocalized electron, the HSE06 functional is applied to check the spin density of the vertically inserted electron in 3.69 mol L−1 electrolyte (Fig. S7†), which indicates that the spin density obtained using BLYP shows good agreement with that obtained using HSE06. Sharing the electron density among a few adjacent TFSI− anions helps reduce the Coulomb repulsion, thus stabilizing the extra electron in SCE and shifting the redox level to a more positive potential.
The local environments of solvents also have great influence on solvation free energies of F−. A solvated F− ion can be stabilized by partially positively charged hydrogen atoms in PC molecules (see Table S3†). At low concentrations, the solvation process incurs small reorganization of solvent molecules, as illustrated in Fig. 5a. However, in highly concentrated solution, the solvation of F− becomes harder because solvent molecules are separated by the network of TFSI− anions and coordination of Li+ cations (see Fig. S8 and S9 in the ESI†). Extra work needs be done to bring solvent molecules together to stabilize F−, which involves significant solvent reorganization (see Fig. 5b). Therefore, the unfavorable solvation of F− in highly concentrated electrolytes leads to precipitation of LiF and formation of an SEI.
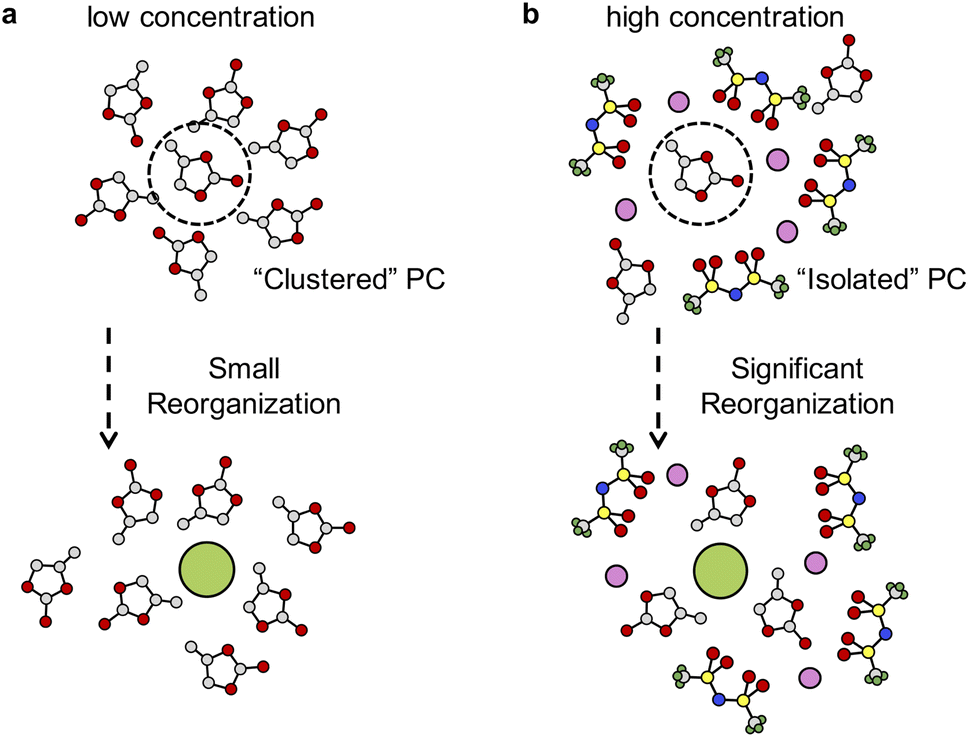 | ||
| Fig. 5 Schematic representation of the structure changes for solvating a F− ion in (a) low concentration and (b) high concentration PC electrolytes. The C, O, N, S, F and Li atoms are in gray, red, blue, yellow, green and pink, respectively. | ||
Conclusion
In summary, by using AIMD based free energy calculations and unsupervised machine learning, we have established detailed relationships between the solvation structures and electrochemical properties (i.e. redox potentials and solvation free energies) of PC electrolytes at different concentrations of LiTFSI. The increase in the concentration can induce dramatic changes in solvation structures of anions and solvent molecules, leading to the appearance of isolated solvent molecules and a lower CBM of electrolytes. These changes have significant impact on one electron reduction potentials of TFSI− and solvation free energies of ions. We find that a few adjacent TFSI− anions in SCE can stabilize the added electron so that TFSI− can be readily reduced at more positive potentials. Furthermore, owing to the isolation of PC molecules, solvation of F− involves significant electrolyte reorganization and becomes harder, resulting in lower LiF solubility in SCE and thus favorable formation of LiF in the SEI. Our calculation demonstrates the importance of solvation structures on ions and solvent molecules, shedding new light on the relations between the structures and electrochemistry of concentrated electrolytes. Finally, our work shows that the combination of free energy calculation from first principles and structural analysis based on machine learning models, is a powerful tool to study electrolytes and facilitate future development of new electrolyte materials in batteries.Data availability
The data that support the findings of this study are available from the corresponding author upon reasonable request.Author contributions
J. C. conceived and designed the project. F. W. performed the calculations. All authors analyzed the results and wrote the manuscript.Conflicts of interest
There are no conflicts to declare.Acknowledgements
We thank Gábor Csányi for helpful discussion. J. C. acknowledges the National Natural Science Foundation of China (Grant No. 21991151, 21991150, 21861132015, and 22021001) and Xiamen Science and Technology Plan Project (No. 3502Z20203027) for financial support. F. W. thanks Xiamen University and iChEM for a PhD studentship, and the China Scholarship Council for a visiting scholarship (No. 201906310034) to the University of Cambridge.References
- K. Xu, Chem. Rev., 2004, 104, 4303–4418 CrossRef CAS PubMed.
- T. R. Jow, K. Xu, O. Borodin and M. Ue, Electrolytes for lithium and lithium-ion batteries, Springer, 2014, vol. 58 Search PubMed.
- K. Xu, Chem. Rev., 2014, 114, 11503–11618 CrossRef CAS PubMed.
- M. Li, C. Wang, Z. Chen, K. Xu and J. Lu, Chem. Rev., 2020, 120, 6783–6819 CrossRef CAS.
- M. Winter, J. O. Besenhard, M. E. Spahr and P. Novak, Adv. Mater., 1998, 10, 725–763 CrossRef CAS.
- P. Arora, R. E. White and M. Doyle, J. Electrochem. Soc., 1998, 145, 3647 CrossRef CAS.
- D. Aurbach, Y. Ein-Eli, O. Chusid, Y. Carmeli, M. Babai and H. Yamin, J. Electrochem. Soc., 1994, 141, 603 CrossRef CAS.
- Y. Nishi, Advances in Lithium Ion Batteries, ed. W. van Schalkwijk and B. Scrosati, 2002 Search PubMed.
- P. B. Balbuena and Y. X. Wang, Lithium-ion batteries: solid-electrolyte interphase, World Scientific, 2004 Search PubMed.
- S.-K. Jeong, M. Inaba, Y. Iriyama, T. Abe and Z. Ogumi, Electrochem. Solid-State Lett., 2002, 6, A13 CrossRef.
- O. Borodin, J. Self, K. A. Persson, C. Wang and K. Xu, Joule, 2020, 4, 69–100 CrossRef CAS.
- S.-K. Jeong, M. Inaba, Y. Iriyama, T. Abe and Z. Ogumi, J. Power Sources, 2008, 175, 540–546 CrossRef CAS.
- L. Suo, Y.-S. Hu, H. Li, M. Armand and L. Chen, Nat. Commun., 2013, 4, 1–9 Search PubMed.
- Y. Yamada, M. Yaegashi, T. Abe and A. Yamada, Chem. Commun., 2013, 49, 11194–11196 RSC.
- Y. Yamada, K. Furukawa, K. Sodeyama, K. Kikuchi, M. Yaegashi, Y. Tateyama and A. Yamada, J. Am. Chem. Soc., 2014, 136, 5039–5046 CrossRef CAS.
- Y. Yamada, K. Usui, C. H. Chiang, K. Kikuchi, K. Furukawa and A. Yamada, ACS Appl. Mater. Interfaces, 2014, 6, 10892–10899 CrossRef CAS.
- L. Suo, O. Borodin, T. Gao, M. Olguin, J. Ho, X. Fan, C. Luo, C. Wang and K. Xu, Science, 2015, 350, 938–943 CrossRef CAS PubMed.
- Y. Yamada and A. Yamada, J. Electrochem. Soc., 2015, 162, A2406 CrossRef CAS.
- T. Doi, Y. Shimizu, M. Hashinokuchi and M. Inaba, J. Electrochem. Soc., 2016, 163, A2211 CrossRef CAS.
- Y. Yamada, K. Usui, K. Sodeyama, S. Ko, Y. Tateyama and A. Yamada, Nat. Energy, 2016, 1, 1–9 Search PubMed.
- N. Takenaka, A. Bouibes, Y. Yamada, M. Nagaoka and A. Yamada, Adv. Mater., 2021, 33, 2100574 CrossRef CAS PubMed.
- P. Shi, M. Lin, H. Zheng, X. He, Z. Xue, H. Xiang and C. Chen, Electrochim. Acta, 2017, 247, 12–18 CrossRef CAS.
- Y. Pan, G. Wang and B. L. Lucht, Electrochim. Acta, 2016, 217, 269–273 CrossRef CAS.
- D. Lu, J. Tao, P. Yan, W. A. Henderson, Q. Li, Y. Shao, M. L. Helm, O. Borodin, G. L. Graff and B. Polzin, et al. , Nano Lett., 2017, 17, 1602–1609 CrossRef CAS.
- C. Zeng-hua, H. Fu-juan, Y. Xi-xin, W. Jian-tao and L. Shi-gang, J. Electrochem, 2020, 26, 759 Search PubMed.
- S. Ko, Y. Yamada and A. Yamada, Batteries Supercaps, 2020, 3, 910–916 CrossRef CAS.
- S. Ko, Y. Yamada and A. Yamada, Electrochem. Commun., 2020, 116, 106764 CrossRef CAS.
- M. R. Lukatskaya, J. I. Feldblyum, D. G. Mackanic, F. Lissel, D. L. Michels, Y. Cui and Z. Bao, Energy Environ. Sci., 2018, 11, 2876–2883 RSC.
- S. Ko, Y. Yamada, K. Miyazaki, T. Shimada, E. Watanabe, Y. Tateyama, T. Kamiya, T. Honda, J. Akikusa and A. Yamada, Electrochem. Commun., 2019, 104, 106488 CrossRef CAS.
- H. Wu, P. Gao, H. Jia, L. Zou, L. Zhang, X. Cao, M. H. Engelhard, M. E. Bowden, M. S. Ding and J. Hu, et al. , ACS Appl. Mater. Inter., 2021, 13, 31583–31593 CrossRef CAS.
- L. Chen, J. Zhang, Q. Li, J. Vatamanu, X. Ji, T. P. Pollard, C. Cui, S. Hou, J. Chen and C. Yang, et al. , ACS Energy Lett., 2020, 5, 968–974 CrossRef CAS.
- G. vall, J. Wallenstein, G. Cheng, K. L. Gering, P. Johansson and D. P. Abraham, J. Electrochem. Soc., 2021, 168, 050521 CrossRef.
- Y. Yamada, Y. Takazawa, K. Miyazaki and T. Abe, J. Phys. Chem. C, 2010, 114, 11680–11685 CrossRef CAS.
- Y. Yamada, Y. Koyama, T. Abe and Z. Ogumi, J. Phys. Chem. C, 2009, 113, 8948–8953 CrossRef CAS.
- C.-Y. Li, J.-B. Le, Y.-H. Wang, S. Chen, Z.-L. Yang, J.-F. Li, J. Cheng and Z.-Q. Tian, Nat. Mater., 2019, 18, 697–701 CrossRef CAS PubMed.
- K. Leung and J. L. Budzien, Phys. Chem. Chem. Phys., 2010, 12, 6583–6586 RSC.
- K. Leung, Y. Qi, K. R. Zavadil, Y. S. Jung, A. C. Dillon, A. S. Cavanagh, S.-H. Lee and S. M. George, J. Am. Chem. Soc., 2011, 133, 14741–14754 CrossRef CAS PubMed.
- K. Leung, J. Phys. Chem. C, 2013, 117, 1539–1547 CrossRef CAS.
- K. Leung and C. M. Tenney, J. Phys. Chem. C, 2013, 117, 24224–24235 CrossRef CAS.
- K. Leung, Phys. Chem. Chem. Phys., 2015, 17, 1637–1643 RSC.
- Y. Li, K. Leung and Y. Qi, Acc. Chem. Res., 2016, 49, 2363–2370 CrossRef CAS PubMed.
- N. Takenaka, T. Inagaki, T. Shimada, Y. Yamada, M. Nagaoka and A. Yamada, J. Chem. Phys., 2020, 152, 124706 CrossRef CAS.
- Z. Yu, T. R. Juran, X. Liu, K. S. Han, H. Wang, K. T. Mueller, L. Ma, K. Xu, T. Li and L. A. Curtiss, et al. , Energy Environ. Mater., 2021, 5, 295–304 CrossRef.
- R. Bouchal, Z. Li, C. Bongu, S. Le Vot, R. Berthelot, B. Rotenberg, F. Favier, S. A. Freunberger, M. Salanne and O. Fontaine, Angew. Chem., 2020, 132, 16047–16051 CrossRef.
- K. Sodeyama, Y. Yamada, K. Aikawa, A. Yamada and Y. Tateyama, J. Phys. Chem. C, 2014, 118, 14091–14097 CrossRef CAS.
- K. Miyazaki, N. Takenaka, E. Watanabe, S. Iizuka, Y. Yamada, Y. Tateyama and A. Yamada, J. Phys. Chem. Lett., 2019, 10, 6301–6305 CrossRef CAS PubMed.
- P. Peljo and H. H. Girault, Energy Environ. Sci., 2018, 11, 2306–2309 RSC.
- V. Garbuio, M. Cascella, L. Reining, R. Del Sole and O. Pulci, Phys. Rev. Lett., 2006, 97, 137402 CrossRef CAS.
- A. Bernas, C. Ferradini and J.-P. Jay-Gerin, Chem. Phys., 1997, 222, 151–160 CrossRef CAS.
- Z. Zeng, V. Murugesan, K. S. Han, X. Jiang, Y. Cao, L. Xiao, X. Ai, H. Yang, J.-G. Zhang and M. L. Sushko, Nat. Energy, 2018, 3, 674–681 CrossRef CAS.
- X. Fan, L. Chen, O. Borodin, X. Ji, J. Chen, S. Hou, T. Deng, J. Zheng, C. Yang and S.-C. Liou, Nat. Nanotechnol., 2018, 13, 715–722 CrossRef CAS PubMed.
- Y. Yamada, J. Wang, S. Ko, E. Watanabe and A. Yamada, Nat. Energy, 2019, 4, 269–280 CrossRef CAS.
- X. Ren, S. Chen, H. Lee, D. Mei, M. H. Engelhard, S. D. Burton, W. Zhao, J. Zheng, Q. Li and M. S. Ding, Chem, 2018, 4, 1877–1892 CAS.
- X. Peng, Y. Lin, Y. Wang, Y. Li and T. Zhao, Nano Energy, 2022, 96, 107102 CrossRef CAS.
- Z. Wang, W. Gao, X. Huang, Y. Mo and L. Chen, J. Raman Spectrosc., 2001, 32, 900–905 CrossRef CAS.
- J. VandeVondele, M. Krack, F. Mohamed, M. Parrinello, T. Chassaing and J. Hutter, Comput. Phys. Commun., 2005, 167, 103–128 CrossRef CAS.
- A. D. Becke, Phys. Rev. A, 1988, 38, 3098–3100 CrossRef CAS PubMed.
- C. Lee, W. Yang and R. G. Parr, Phys. Rev. B: Condens. Matter Mater. Phys., 1988, 37, 785–789 CrossRef CAS PubMed.
- S. Grimme, J. Antony, S. Ehrlich and H. Krieg, J. Chem. Phys., 2010, 132, 154104 CrossRef PubMed.
- J. Blumberger, I. Tavernelli, M. L. Klein and M. Sprik, J. Chem. Phys., 2006, 124, 064507 CrossRef PubMed.
- J. Cheng, M. Sulpizi and M. Sprik, J. Chem. Phys., 2009, 131, 154504 CrossRef PubMed.
- M. Sulpizi and M. Sprik, Phys. Chem. Chem. Phys., 2008, 10, 5238–5249 RSC.
- J. Cheng, X. Liu, J. VandeVondele, M. Sulpizi and M. Sprik, Acc. Chem. Res., 2014, 47, 3522–3529 CrossRef CAS.
- J. Cheng and M. Sprik, Phys. Chem. Chem. Phys., 2012, 14, 11245–11267 RSC.
- X.-H. Yang, A. Cuesta and J. Cheng, J. Phys. Chem. B, 2019, 123, 10224–10232 CrossRef CAS.
- Y. Wang and P. B. Balbuena, J. Phys. Chem. B, 2002, 106, 4486–4495 CrossRef CAS.
- K. Leung, Chem. Phys. Lett., 2013, 568, 1–8 CrossRef.
- R. Mogi, M. Inaba, Y. Iriyama, T. Abe and Z. Ogumi, Langmuir, 2003, 19, 814–821 CrossRef CAS.
- A. von Wald Cresce, O. Borodin and K. Xu, J. Phys. Chem. C, 2012, 116, 26111–26117 CrossRef CAS.
- L. D. Gibson, J. Pfaendtner and C. J. Mundy, J. Chem. Phys., 2021, 155, 204703 CrossRef CAS PubMed.
- M. Busch, E. Ahlberg and K. Laasonen, Phys. Chem. Chem. Phys., 2021, 23, 11727–11737 RSC.
- Y. Marcus, Pure Appl. Chem., 1983, 55, 977–1021 CrossRef CAS.
- M. I. Chaudhari, J. R. Nair, L. R. Pratt, F. A. Soto, P. B. Balbuena and S. B. Rempe, J. Chem. Theory Comput., 2016, 12, 5709–5718 CrossRef CAS.
- J. Jones, M. Anouti, M. Caillon-Caravanier, P. Willmann and D. Lemordant, Fluid Phase Equilib., 2009, 285, 62–68 CrossRef CAS.
- Y. Aoki, M. Oda, S. Kojima, T. Ishihama, T. Nagashima, T. Doi and M. Inaba, ACS Appl. Energ. Mater., 2022, 5, 1085–1094 CrossRef CAS.
- J. Cheng and J. VandeVondele, Phys. Rev. Lett., 2016, 116, 086402 CrossRef PubMed.
- F. Haldane and P. Anderson, Phys. Rev. B: Condens. Matter Mater. Phys., 1976, 13, 2553 CrossRef CAS.
- A. P. Bartók, R. Kondor and G. Csányi, Phys. Rev. B: Condens. Matter Mater. Phys., 2013, 87, 184115 CrossRef.
- J.-X. Huang, G. Csányi, J.-B. Zhao, J. Cheng and V. L. Deringer, J. Mater. Chem. A, 2019, 7, 19070–19080 RSC.
- V. L. Deringer, M. A. Caro, R. Jana, A. Aarva, S. R. Elliott, T. Laurila, G. Csanyi and L. Pastewka, Chem. Mater., 2018, 30, 7438–7445 CrossRef CAS.
- M. Ceriotti, J. Chem. Phys., 2019, 150, 150901 CrossRef.
Footnote |
| † Electronic supplementary information (ESI) available. See https://doi.org/10.1039/d2sc04025e |
| This journal is © The Royal Society of Chemistry 2022 |