 Open Access Article
Evolution of the active species of homogeneous Ru hydrodeoxygenation catalysts in ionic liquids†
K.
Janssens
 a,
A. L.
Bugaev
 bc,
E. G.
Kozyr
 bd,
V.
Lemmens
a,
A. A.
Guda
b,
O. A.
Usoltsev
 b,
S.
Smolders
 a,
A. V.
Soldatov
b and
D. E.
De Vos
 *a
*a
aCentre for Membrane Separations, Adsorption, Catalysis and Spectroscopy for Sustainable Solutions (cMACS), KU Leuven, Celestijnenlaan 200F, Post Box 2454, 3001 Leuven, Belgium. E-mail: dirk.devos@kuleuven.be
bThe Smart Materials Research Institute, Southern Federal University, Sladkova 178/24, 344090 Rostov-on-Don, Russia. E-mail: abugaev@sfedu.ru
cSouthern Scientific Centre, Russian Academy of Sciences, Chekhova 41, 344006 Rostov-on-Don, Russia
dDepartment of Chemistry, University of Turin, Via Giuria 5, 10125 Torino, Italy
First published on 30th July 2022
Abstract
This work establishes structure–property relationships in Ru-based catalytic systems for selective hydrodeoxygenation of ketones to alkenes by combining extensive catalytic testing, in situ X-ray absorption spectroscopy (XAS) under high pressures and temperatures and ex situ XAS structural characterization supported by density functional theory (DFT) calculations. Catalytic tests revealed the difference in hydrogenation selectivity for ketones (exemplified by acetone) or alkenes (exemplified by propene) upon changing the reaction conditions, more specifically in the presence of CO during a pretreatment step. XAS data demonstrated the evolution of the local ruthenium structure with different amounts of Cl/Br and CO ligands. In addition, in the absence of CO, the catalyst was reduced to Ru0, and this was associated with a significant decrease of the selectivity for ketone hydrogenation. For the Ru–bromide carbonyl complex, selectivity towards acetone hydrogenation over propene hydrogenation was explained on the basis of different relative energies of the first intermediate states of each reaction. These results give a complete understanding of the evolution of the Ru species, used for the catalytic valorization of biobased polyols to olefins in ionic liquids, identifying the undesired deactivation routes as well as possibilities for reactivation.
Introduction
The selection of ligands in the coordination sphere of homogeneous catalysts allows for the tuning of process-specific, chemoselective hydrogenations.1 As a prominent example, the chemoselectivity of RuCl2(PPh3)2 can be shifted from olefin hydrogenation2 to carbonyl hydrogenation,3 as discovered by Noyori and coworkers. This was achieved through the addition of a vicinal diamine, e.g. ethylenediamine, and a base, e.g. KOH, revealing a new way to catalytically hydrogenate the carbonyl group.4 For the preferential hydrogenation of carbonyl groups in the presence of C![[double bond, length as m-dash]](https://www.rsc.org/images/entities/char_e001.gif) C functions, this approach allows replacement of stochiometric metal hydride reagents, such as NaBH4 or LiAlH4, by molecular hydrogen and a catalyst.
C functions, this approach allows replacement of stochiometric metal hydride reagents, such as NaBH4 or LiAlH4, by molecular hydrogen and a catalyst.
Other homogeneous Ru-complexes are also known to be active catalysts for hydrogenation of aldehydes and ketones, but whether they also refrain from reacting with C![[double bond, length as m-dash]](https://www.rsc.org/images/entities/char_e001.gif) C bonds, is not always clear. Braca et al. reported that Ru halide carbonyls, even without PPh3, catalyze the hydrogenative dehydroxylation of glycerol and sugar alcohols, which proceeds in acidic conditions.5 For instance, in the presence of [Ru(CO)3I2]2 as a homogeneous catalyst, and of hydrogen iodide as a Brønsted acid, glycerol is converted to n-propanol. After the Brønsted acidity dehydrates glycerol to acrolein, the Ru catalyst performs a complete hydrogenation of both the olefin and aldehyde functions, yielding 1-propanol and the derived ether. Clearly, under these acidic dehydration conditions, the Ru catalysts do not discriminate between C
C bonds, is not always clear. Braca et al. reported that Ru halide carbonyls, even without PPh3, catalyze the hydrogenative dehydroxylation of glycerol and sugar alcohols, which proceeds in acidic conditions.5 For instance, in the presence of [Ru(CO)3I2]2 as a homogeneous catalyst, and of hydrogen iodide as a Brønsted acid, glycerol is converted to n-propanol. After the Brønsted acidity dehydrates glycerol to acrolein, the Ru catalyst performs a complete hydrogenation of both the olefin and aldehyde functions, yielding 1-propanol and the derived ether. Clearly, under these acidic dehydration conditions, the Ru catalysts do not discriminate between C![[double bond, length as m-dash]](https://www.rsc.org/images/entities/char_e001.gif) C and C
C and C![[double bond, length as m-dash]](https://www.rsc.org/images/entities/char_e001.gif) O bonds. In contrast, our group has developed an alternative approach to the hydrodeoxygenation of sugar alcohols and glycerol to olefins. When HBr/Bu4PBr as a Brønsted acidic ionic liquid (IL) is combined with a Ru halide carbonyl hydrogenation catalyst, mono-alkenes are obtained selectively from sugar alcohols.6,7 In contrast to previous work, the dehydration in this process relies on acid-promoted Br− substitution–elimination reactions; the hydrogenation is performed by in situ formed RuBrx(CO)y compounds. These were observed to be generated in situ from RuBr3 and CO, formed by decarbonylation of the formed aldehyde intermediates, or by the thermal decomposition of formaldehyde.6 Later, an additional pretreatment step involving CO gas proved useful to obtain even higher selectivities in the valorization of crude waste glycerol to propylene.7 Remarkably, the product alkenes are hardly hydrogenated. However, apart from the proof that CO drastically improves the biomass valorization in terms of olefin selectivity, no clear understanding of the catalytic system is available.
O bonds. In contrast, our group has developed an alternative approach to the hydrodeoxygenation of sugar alcohols and glycerol to olefins. When HBr/Bu4PBr as a Brønsted acidic ionic liquid (IL) is combined with a Ru halide carbonyl hydrogenation catalyst, mono-alkenes are obtained selectively from sugar alcohols.6,7 In contrast to previous work, the dehydration in this process relies on acid-promoted Br− substitution–elimination reactions; the hydrogenation is performed by in situ formed RuBrx(CO)y compounds. These were observed to be generated in situ from RuBr3 and CO, formed by decarbonylation of the formed aldehyde intermediates, or by the thermal decomposition of formaldehyde.6 Later, an additional pretreatment step involving CO gas proved useful to obtain even higher selectivities in the valorization of crude waste glycerol to propylene.7 Remarkably, the product alkenes are hardly hydrogenated. However, apart from the proof that CO drastically improves the biomass valorization in terms of olefin selectivity, no clear understanding of the catalytic system is available.
Here, we elucidate the different catalytic steps in the Ru-catalyzed hydrodeoxygenation of glycerol to propene by monitoring the evolution of Ru-species by in situ X-ray absorption spectroscopy (XAS) and performing additional detailed analysis of the high-quality ex situ data collected by carefully trapping different intermediate states in solidified ionic liquid. The different states are correlated to the separate activation and deactivation steps. First, we focus on the catalyst dissolution in the IL, to reveal whether the Ru precursors remain stable or are converted into new complexes. Then, we investigate the impact of CO gas, to correlate the actual ligand environment of Ru to the catalytic performance. Finally, the origin of the selectivity towards ketone hydrogenation is supported with theoretical density functional theory (DFT) calculations.
Materials and methods
Catalytic reaction
A typical reaction mixture consists of a homogeneous Ru catalyst (10 μmol) dissolved in Bu4PBr (1.7 mmol, 577 mg), acetone (0.50 mmol, 37.0 μL) or propene (1 bar) as the model reactants, H2 gas as the reducing agent, in the presence of a mixture of dodecane (1 mL, extraction solvent) and tetradecane (0.5 mmol, 0.13 mL, internal standard). First, all solids and liquids are loaded into a glass liner (5 ml) inside a stainless steel pressure reactor. Next, the reactor is flushed 3 times with N2 followed by H2, loaded optionally with propene gas (1 bar) and finally with 40 bar of H2. Occasionally, prior to the actual catalytic reaction, an additional pretreatment step was performed to generate Ru bromide carbonyl species through stirring of RuBr3 in the IL under 1 bar of CO gas and 40 bar of H2 for 30 minutes at 180 °C. Catalytic reactions were performed by stirring the total reaction mixture for 1 h at 220 °C.After reaction, the reactor was cooled on ice and a gaseous sample was taken for FTIR gas phase analysis. The yield of apolar compounds was determined via GC analysis of the dodecane layer. Finally, a derivatisation reaction was performed on the polar IL layer using N,O-bis(trimethylsilyl)-trifluoroacetamide (BSTFA, 400 μL), silylating the alcohols remaining in that layer. All products were analyzed according to previous literature procedures.6,7 Details on the product analysis and the boundary conditions for the catalytic reaction are provided in the ESI.†
Synthesis of [RuBr2(CO)3]2
The Ru bromide carbonyl complex was synthesized according to a literature procedure.7,8 Ru3(CO)12 (0.129 g, 0.20 mmol) was dissolved in dry benzene resulting in an orange solution. Excess Br2 was added and the solution was stirred vigorously for 3 hours. The solvent and unreacted Br2 were removed under reduced pressure. The crude product was purified by recrystallization in chloroform/hexane resulting in a yellow solid. The identity of the [RuBr2(CO)3]2 complex was confirmed with FT-IR spectroscopy and Electrospray Ionization Mass Spectrometry (ESI-MS). FTIR analysis was performed in a Bruker IFS 66v/S FTIR spectrometer under vacuum. The ESI-MS was conducted in positive ion mode with a Thermo Finnigan LCQ Advantage mass spectrometer. ν(CO): (KBr) 2138 cm−1 (s), 2078 (s) cm−1, ESI-MS (MH+ in CH3CN): 387.75; found, 388.0. XAS analysis (Fig. S7†) also provided the 3D atomic structure of the complex.9,10Ex situ XAS data collection
Experimental Ru K-edge XAS data were measured at the BM23 beamline of ESRF (Grenoble, France) and CLAESS beamline of ALBA (Barcelona, Spain). The powdered reference samples were pressed into pellets to optimize the absorption jump at the Ru K-edge. The catalytic samples frozen in the IL were placed in a self-made teflon container of cylindrical shape, closed from both sides with Kapton tape. To exclude the effect of dilution in the IL, the reference complexes were measured both pure in the crystalline state and diluted in Bu4PBr at high or low concentrations. For the diluted reference samples, both powders were heated 10 °C above the IL melting point (Tmelting = 100 °C) and stirred vigorously. High concentrations (Ru![[thin space (1/6-em)]](https://www.rsc.org/images/entities/char_2009.gif) :
:![[thin space (1/6-em)]](https://www.rsc.org/images/entities/char_2009.gif) Br ratio of ca. 1
Br ratio of ca. 1![[thin space (1/6-em)]](https://www.rsc.org/images/entities/char_2009.gif) :
:![[thin space (1/6-em)]](https://www.rsc.org/images/entities/char_2009.gif) 35) resulted in good signal-to-noise ratio in both X-ray absorption near edge structure (XANES) and extended X-ray absorption fine structure (EXAFS) regions. However, in standard catalytic reactions the system is ∼5 times more diluted, resulting in an Ru
35) resulted in good signal-to-noise ratio in both X-ray absorption near edge structure (XANES) and extended X-ray absorption fine structure (EXAFS) regions. However, in standard catalytic reactions the system is ∼5 times more diluted, resulting in an Ru![[thin space (1/6-em)]](https://www.rsc.org/images/entities/char_2009.gif) :
:![[thin space (1/6-em)]](https://www.rsc.org/images/entities/char_2009.gif) Br ratio of 1
Br ratio of 1![[thin space (1/6-em)]](https://www.rsc.org/images/entities/char_2009.gif) :
:![[thin space (1/6-em)]](https://www.rsc.org/images/entities/char_2009.gif) 170. The presence of the strongly absorbing Br limits signal intensity in the lower edge jump compared to reference samples and, therefore, more noisy data are obtained in the EXAFS region. All spectra were collected in the transmission mode, which showed better signal-to-noise ratio compared to the fluorescence signal collected in similar acquisition times, with simultaneous measurement of metallic ruthenium foil for energy alignment. The filling of the 1st, 2nd and 3rd ionization chambers resulted in the absorption of 20, 80, and 80%, respectively, at the Ru K-edge photon energy. The energy was selected by a Si(311) double-crystal monochromator operated in a step mode. Rejection of higher harmonics was done by Rh coated mirrors. The energy steps in the pre-edge and XANES regions were 5 and 1 eV respectively. In the EXAFS region, a constant step in k-space of 0.035 Å−1 was used. At B22, continuous scanning mode was used.
170. The presence of the strongly absorbing Br limits signal intensity in the lower edge jump compared to reference samples and, therefore, more noisy data are obtained in the EXAFS region. All spectra were collected in the transmission mode, which showed better signal-to-noise ratio compared to the fluorescence signal collected in similar acquisition times, with simultaneous measurement of metallic ruthenium foil for energy alignment. The filling of the 1st, 2nd and 3rd ionization chambers resulted in the absorption of 20, 80, and 80%, respectively, at the Ru K-edge photon energy. The energy was selected by a Si(311) double-crystal monochromator operated in a step mode. Rejection of higher harmonics was done by Rh coated mirrors. The energy steps in the pre-edge and XANES regions were 5 and 1 eV respectively. In the EXAFS region, a constant step in k-space of 0.035 Å−1 was used. At B22, continuous scanning mode was used.
In situ XAS data collection
In situ Ru K-edge XAS spectra were collected in fluorescence mode at the SAMBA beamline of Soleil synchrotron (Paris, France). A sample containing similar concentrations of reagents, as used for the catalytic tests, was loaded into a self-made high-pressure reactor (Fig. S1†) which had the same geometry as the reactors used for the catalytic tests. The cell was pressurized with H2 and CO and heated by four built-in thermistor elements. The magnetic stirrer was positioned below the cell (Fig. S1b†). The energy was scanned continuously by a Si(220) monochromator. The I0 intensity before the sample was collected by an ionization chamber and the fluorescence signal was collected by a Vortex silicon drift detector. The energy was calibrated with a ruthenium foil before each in situ run; this did not demonstrate significant drifts of the monochromator.XAS data analysis
Initial processing of experimental XAS data, including normalization, energy calibration, extraction of χ(k) signals and further Fourier analysis of EXAFS, were performed in the Athena and Artemis programs of the Demeter package.11 The fitting was done in R-space in the 1–3 Å range simultaneously on k1-, k2-and k3-weighted data, Fourier-transformed applying the Hanning window from 4 to 15 Å−1 with dk = 1. For the reference compounds the signals up to k = 18 Å−1 were also examined. The theoretical phases and amplitudes were calculated by FEFF6.12 The in situ XAS data were processed in the Fastosh program. Principle component analysis (PCA) analysis was performed in PyFitIt code.13 Multivariate curve resolution alternating least squares (MCR-ALS) analysis of the in situ data (in the XANES region) was performed by means of the MATLAB code.14–16DFT calculations
Geometry relaxation and calculation of reaction enthalpies were done in ADF software17 at DFT level of theory with BLYP-D3 exchange-correlation potential18–20 and TZP Slater-type basis set.21 The choice of the potential and basis set was made based on the comparison of the Ru–ligand C, Ru–Cl and C–O distances in the relaxed structure with those obtained from EXAFS for [RuCl2(CO)3]2. The scalar relativistic effects were included within the Zero Order Regular Approximated (ZORA) Hamiltonian.22Results and discussion
Catalytic testing
Previous reports on the use of HBr/Bu4PBr as the dehydrating solvent for the valorisation of biobased vicinal alcohols suggested a pathway relying on substitution with Br− and HBr elimination, rather than an E1 mechanism. This results in a specific dehydration route mainly leading through ketone, rather than aldehyde intermediates.6 In the reaction of erythritol, butanone hydrogenation was found to be a kinetically slow step, whereas the hydrogenation of 2,3-butanedione and α-hydroxycarbonyl compounds occurs faster, possibly due to the directing role of the second oxygen functionality.6 Similar results were obtained in the case of glycerol, where acetone was detected as the carbonyl intermediate that is slowest to be converted.7 In absence of the HBr acid co-catalyst, over 50% of unconverted alcohol products (mainly 1,2-PDO and glycerol) were reported, indicating the importance of HBr to fully convert biobased polyol intermediates to the desired olefins.6,7 Most decisive for the olefin selectivity is the ability to hydrogenate ketones like butanone or acetone, while leaving the desired propene or butene products intact. In order to elucidate the role of the various Ru species in either ketone or olefin hydrogenation, acetone and propene were used as model reactants (Scheme 1). Several ruthenium catalysts (commercial RuBr3 and [RuCl2(CO)3]2, and synthesized [RuBr2(CO)3]2) were tested on either substrate under realistic conditions, similar to those of the conversion of (waste) glycerol to propene (Table 1). Ru bromide carbonyl compounds were obtained in two different ways: via a classical, ex situ way, as reported by Johnson et al., starting from Ru3(CO)12 and Br2 leading to [RuBr2(CO)3]2 (entries 3 and 10 in Table 1),8,23 and by an in situ exposure of RuBr3 dissolved in the IL to CO gas in a pretreatment step (entries 4–6, 11–13).7 For the hydrogenation of acetone with different Ru precursors, key observations are summarized in Table 1 (entries 1–7). The presence of CO in the catalyst coordination sphere seems strictly necessary to obtain an active catalyst for ketone hydrogenation, with RuBr3 (entry 1) only resulting in non-selective conversion of acetone (presumably via condensation reactions).6 Remarkably, depending on the catalyst synthesis, a distinct product distribution is observed (entries 2–3 vs. 4–5). In the case of the pre-isolated [RuX2(CO)3]2 complexes, less dehydration reactions are occurring (up to 30% alcohols remaining), with significant overhydrogenation to the undesired alkanes (less than 40% olefin selectivity). A pretreatment step with CO gas on the ex situ synthesized [RuBr2(CO)3]2 improved the propene selectivity significantly, but further decreased the dehydration activity (entry 4). In contrast, a similar complex formed in situ starting from Ru(III)Br3·xH2O results in near quantitative dehydration, maintaining very high olefin selectivity (entry 5). Even after extending the reaction time to 4 hours there is only a minor increase in olefin overhydrogenation to propane (entry 6). The increase in alcohol conversion might be due to in situ formation of HBr, as a result of reduction of Ru(III)Br3 to [Ru(II)Br2(CO)x]2. This results in an increase in Brønsted acidity and free Br− in the system, while the additional CO ligands allow for more catalyst stability and selectivity in the two competitive hydrogenation steps.| Entry | Catalyst | Substratee | Olefin Selectivityf | Propeneg (%) | Propaneg (%) | Isopropanolh (%) | Acetoneg (%) |
|---|---|---|---|---|---|---|---|
| a Reaction conditions unless stated otherwise: 0.01 mmol Rucat. (2 mol%), 1.7 mmol Bu4PBr, 1 mL dodecane, 0.5 mmol tetradecane (IS), 220 °C, 40 bar H2, 1 h. b Pretreatment step of RuBr3 with CO gas (1 bar), 30 min, 40 bar H2, 180 °C. c Reaction for 4 h. d CO gas (1 bar) present during the reaction. e Glycerol: ref. 7: HBr co-catalyst (5 mol%), crude glycerol (0.5 mmol). Acetone (0.5 mmol, 36.7 μL). Propene gas (1 bar). f Ratio of propene vs. (propene + propane) determined by FT-IR/GC gas analysis. g GC yield. h GC yield after BSTFA derivatization. i Yield too low to allow reliable selectivity determination. | |||||||
| 0 | RuBr3·xH2O + COb | Glycerol | 94% | 82 | 5 | 2 | 4 |
| 1 | RuBr3·xH2O | Acetone | /i | 2 | <1 | <1 | 53 |
| 2 | [RuCl2(CO)3]2 | Acetone | 36% | 25 | 44 | 26 | 3 |
| 3 | [RuBr2(CO)3]2 | Acetone | 30% | 17 | 40 | 29 | 8 |
| 4 | [RuBr2(CO)3]2 + COb | Acetone | 52% | 25 | 23 | 46 | 4 |
| 5 | RuBr 3 ·xH 2 O + COb | Acetone | 90% | 77 | 8 | 2 | <1 |
| 6 | RuBr3·xH2O + COb,c | Acetone | 82% | 72 | 16 | <1 | <1 |
| 7 | RuBr3·xH2O + COb,d | Acetone | 93% | 40 | 3 | 1 | 50 |
| 8 | RuBr3·xH2O | Propene | 39% | 38 | 59 | — | — |
| 9 | [RuCl2(CO)3]2 | Propene | 56% | 52 | 41 | — | — |
| 10 | [RuBr2(CO)3]2 | Propene | 63% | 62 | 36 | — | — |
| 11 | [RuBr2(CO)3]2 + COb | Propene | 82% | 78 | 17 | — | — |
| 12 | RuBr 3 ·xH 2 O + COb | Propene | 96% | 95 | 4 | — | — |
| 13 | RuBr3·xH2O + COb,c | Propene | 87% | 84 | 13 | — | — |
| 14 | RuBr3·xH2O + COb,d | Propene | 98% | 93 | 2 | — | — |
Next, it was evaluated whether the choice of the Ru precursor has an effect on the preservation of propene, thus on avoiding overhydrogenation to the undesired alkane (entries 8–14). RuBr3 shows the highest overhydrogenation in the absence of a CO pretreatment step (entry 8). The overhydrogenation decreases for the isolated complexes (entries 9 and 10), also upon addition of a CO pretreatment step (entry 11). Finally, it is found to be almost negligible for the in situ formed complex (entry 12) as the increased acidity may additionally prevent the reduction to zerovalent Ru metal. Extending the reaction time to 4 h (entry 13) shows only a minor formation of propane from propene, indicating that high catalyst stability is combined with impressive C![[double bond, length as m-dash]](https://www.rsc.org/images/entities/char_e001.gif) O vs. C
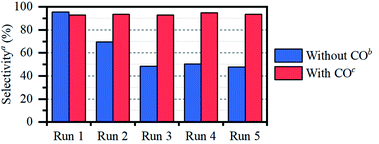
O vs. C![[double bond, length as m-dash]](https://www.rsc.org/images/entities/char_e001.gif) C selectivity. The necessity of a pretreatment step under CO, rather than applying CO directly during the reaction, was confirmed by a control experiment on both acetone and propene (entries 7 and 14). We have previously obtained similar results in the HDO of erythritol, with butanone as the model substrate.6 Indeed, when the reaction is performed under 1 bar of CO, not only the olefin is hardly hydrogenated (entry 14); also the carbonyl hydrogenation is significantly hampered, presumably due to oversaturation of the catalyst coordination sphere with CO. Besides catalyst stability and selectivity, also catalyst recyclability is an important criterion. Therefore, after CO pretreatment, the catalyst was reused in 5 runs, showing clear selectivity loss if no CO is added in between cycles (Fig. 1). Selectivity is perfectly preserved when CO is added in between cycles.
C selectivity. The necessity of a pretreatment step under CO, rather than applying CO directly during the reaction, was confirmed by a control experiment on both acetone and propene (entries 7 and 14). We have previously obtained similar results in the HDO of erythritol, with butanone as the model substrate.6 Indeed, when the reaction is performed under 1 bar of CO, not only the olefin is hardly hydrogenated (entry 14); also the carbonyl hydrogenation is significantly hampered, presumably due to oversaturation of the catalyst coordination sphere with CO. Besides catalyst stability and selectivity, also catalyst recyclability is an important criterion. Therefore, after CO pretreatment, the catalyst was reused in 5 runs, showing clear selectivity loss if no CO is added in between cycles (Fig. 1). Selectivity is perfectly preserved when CO is added in between cycles.
Ru speciation in IL upon dissolution
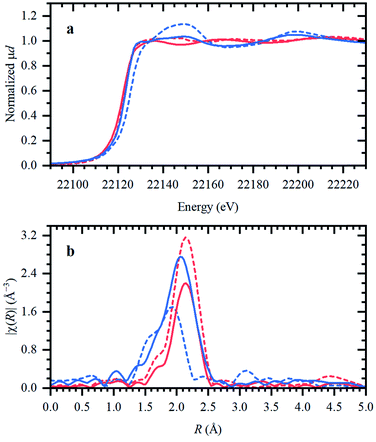
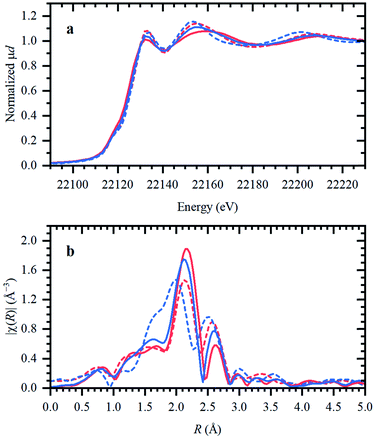
In the following, the solidification of the IL at room temperature (Tmelting = 100 °C) is used as a unique feature to trap the catalytic species, in order to clarify the behavior of the different Ru compounds by XAS (vide supra; ex situ XAS data collection). Spectra recorded for RuX3 (X = Br, Cl) salts admixed in Bu4PBr, show that higher-shell FT-EXAFS peaks are eliminated (Fig. 2b); this confirms their dissolution. At the same time, there is no shift in the edge position of the XANES spectra (Fig. 2a), indicating that the oxidation state of Ru is not changed. The results of Fourier-analysis of EXAFS data are reported in Table S1.† For RuBr3 in the ionic liquid, the first-shell coordination number (CN) decreases from 6 to 4.3 ± 0.3. This could be explained by 4-coordinated [RuBr4]− complexes with additional Br− coming from the IL. For RuCl3, a significant reshaping of both EXAFS and XANES data is observed, associated with a Cl−–Br− exchange in Br-rich IL. The resulting structure contains a mixture of RuClx and RuBry species, with clearly visible Ru–Cl and Ru–Br contributions in FT-EXAFS. To overcome the instabilities, the total CN was fixed to 4.Next, isolated [RuX2(CO)3]2 precursors were used instead of RuX3 compounds (X = Br, Cl). The corresponding XANES and EXAFS data are shown in Fig. 3. As in the previous case, the strongest changes in the spectra are observed for the Cl-containing precursor, which is also associated with Cl−–Br− exchange. This is supported by DFT calculations since the reaction of 4 Bu4PBr + [RuCl2(CO)3]2 to form 4Bu4PCl + [RuBr2(CO)3]2 is favourable with ΔH of about (−3)–(−4) kcal mol−1 (Fig. S5†). In addition, after dissolution in IL, both precursors exhibit increased Ru–Br and decreased Ru–CO contributions in EXAFS (Fig. 3b). The Ru–Br coordination is increased roughly by 1 (see Table S2†) with respect to the reference [RuBr2(CO)3]2 complex. This can be explained by a loss of CO ligands to the gas phase.
Two aspects related to the Ru speciation upon dissolution in the IL are noteworthy. First, irrespective of the original precursor, a complex with Br-ligands is formed in Bu4PBr due to Cl−–Br− exchange. Secondly, the IL itself is not sufficient to preserve the structure of the isolated [RuX2(CO)3]2 complexes upon dissolution, explaining their significantly lower catalytic performance (Table 1; entry 2–3 and 9–10). Since the structure of the isolated Ru-precursors is not preserved (CNCO < 3), it might only be possible to form the actual catalytic complex in the IL through the CO pretreatment step.
The role of CO and reaction conditions
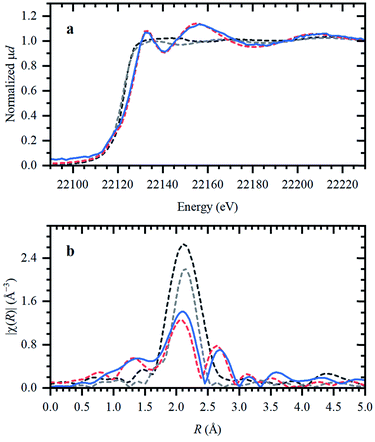
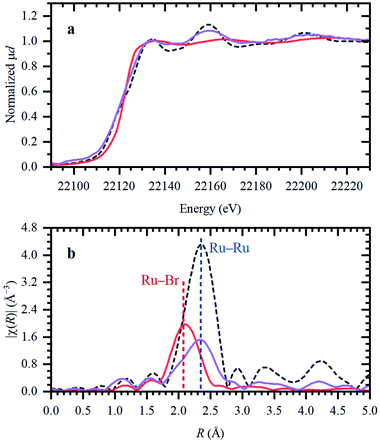
The presence of CO gas (during the pretreatment) transforms the RuBr3 salt (Fig. 4, dashed black vs. gray spectra for RuBr3 before & after dissolution in the IL) into Ru carbonyl species (solid blue), with a spectrum highly similar to that of the crystalline [RuBr2(CO)3]2 reference compound (dashed red). This shift in the Ru speciation (from dashed grey to solid blue) is reflected in the very high selectivity for carbonyl vs. olefin hydrogenation (entries 5, 12). The structure was also compared with the one formed in presence of formaldehyde as a CO source, according to the procedure reported in our previous work.6 The latter also results in a similar ruthenium halide carbonyl complex, but with increased Ru–Br and decreased Ru–CO contributions compared to the sample obtained under CO gas (Fig. S2†). This again can be assigned to a partial decomposition of the priorly isolated [RuBr2(CO)3]2 into Ru bromide carbonyl species (CNCO < 3), explaining the significant decrease in olefin selectivity shown for glycerol.7 The low concentration of Ru in the systems tested under CO pretreatment and under reaction conditions complicates EXAFS analysis, but XANES spectra give a clear indication of the relative changes in the number of CO and Br ligands over the whole series of samples.A linear combination fitting (LCF) using two reference spectra of RuBr3 and Ru3(CO)12 was performed to reveal the relative ratio of these components in the studied samples (Fig. 5). For RuX3 dissolved in IL, the fraction of RuBr3 component is close to 1, but in the presence of CO during the pretreatment step, this sample almost fully (ca. 92%) converts to [RuBr2(CO)3]2 (reference) species. After reaction or upon dissolution of the pre-isolated reference in IL the [RuBr2(CO)3]2complex partially degrades to RuBrx species, which can be associated with deactivation of the catalysts in absence of CO (vide supra). This can be counteracted by CO pretreatment in between the cycles (Fig. 1). Finally, if RuBr3 is used in absence of CO, formation of small Ru0 clusters occurs after reaction due to the presence of the reducing H2 gas (Fig. 6). These species are not active in carbonyl hydrogenation and can be responsible for alkene hydrogenation (Table 1; entry 1 and 8).
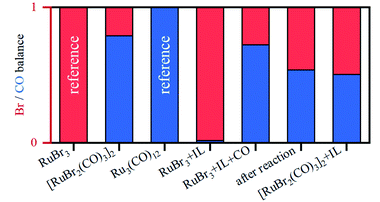 | ||
| Fig. 5 Relative fractions of Br (shown in red) vs. CO (in blue) in the Ru coordination sphere, for different samples, as obtained by LCF analysis. | ||
In situ evolution of Ru-species under reaction conditions
To prove the relevance of the Ru-species identified from ex situ data, an in situ experiment was performed utilizing a dedicated high-pressure reactor cell (see Fig. S1†). The data (Fig. S3†) were collected in fluorescence mode with high time resolution and have lower signal-to-noise ratio for quantitative EXAFS analysis than in measurements performed on ex situ samples. Implementation of PCA and MCR-ALS procedures to the whole experimental dataset revealed the existence of three different Ru-species (see Fig. S4†); their spectra and respective concentration profiles are shown in Fig. 7. The fact that only three components were identified also indicates that no other Ru bromide carbonyl complex besides [RuBr2(CO)3]2 is present in the system. Indeed, a complex with different Br/CO coordination numbers would result in similar spectral features but shifted edge position due to changes in Ru oxidation state,9 which would result in an additional component in PCA.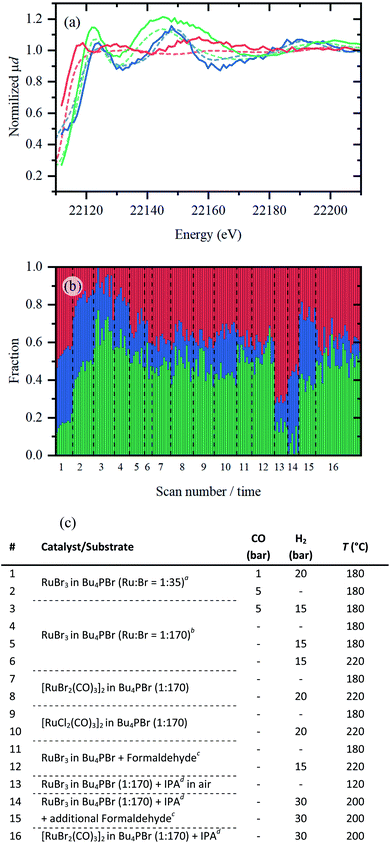 | ||
| Fig. 7 (a) XANES spectra of pure Ru-species (solid coloured lines) extracted by MCR-ALS plotted together with the reference spectra of RuBr3, [RuBr2(CO)3]2, and Ru foil (dashed red, green and blue lines respectively). (b) Concentration profiles of the three Ru-species extracted from MCR-ALS. (c) A list of experimental conditions applied during in situ XAS data collection. Conditions were varied within the described boundary conditions (see ESI,† “boundary conditions”): CO (0–5 bar), H2 (0–30 bar) and temperature (180–220 °C). Dashed lines indicate when the sample was changed. aA high concentration of RuBr3 was used, with 68 mg RuBr3 in 2 g IL. bFor all other entries, low concentrations of Ru were measured (13.6 mg in 2 g IL, similar to catalytic results presented in Table 1). cFormaldehyde (100 μL) was thermally decomposed to generate in situ CO gas. dIsopropanol (IPA, 250 μL) was added as propene precursor. | ||
The first part of Fig. 7(a) shows the spectra of pure species extracted from the in situ collected data. The first species is obviously similar to the RuBr3 reference and to RuBrx dissolved in Bu4PBr (indicated in red). The second species presents a spectrum close to that of the [RuBr2(CO)3]2 reference and represents the Ru carbonyl contribution (indicated in green). Finally, the third species shares common features with metallic ruthenium foil (indicated in blue). The evolution of these three species under various conditions is summarized in Fig. 7b. The applied steps and corresponding sets of conditions (1–16) along the x-axis are summarized in Fig. 7c, in which each scan takes approximately 5–6 minutes.
Under 1 bar CO and 20 bar H2, a considerable fraction of RuBrx still remains unchanged for the highly concentrated catalyst (1). The fraction of Ru bromide carbonyl increases either by removing H2 and increasing CO pressure (2) or by reducing the Ru loading (3), i.e. increasing CO/Ru ratio. In absence of CO, under inert atmosphere (4), in H2 (5) and with increased temperature (6), Ru is gradually converted towards RuBrx species. In agreement with ex situ results, isolated [RuX2(CO)3]2 complexes (7–8 and 9–10, respectively) contain less Ru carbonyl contribution (indicated in green) compared to the in situ carbonylated species (i.e. in step 3). Like in the previous research,6 formaldehyde can also be used as a CO source (11–12). In presence of IPA (as propene precursor) and H2 gas, RuBrx species are reduced to small Ru clusters (14). As expected, the RuBrx can be converted back to a Ru carbonyl species by addition of a CO source (formaldehyde, 15), while the lost Ru (0) species cannot. The metallic Ru contribution remains constant in step 14 vs. 15 (indicated in blue). If [RuBr2(CO)3]2 is used as a precursor, slight decarbonylation is observed over a large timeframe of ca. 2.5 h (16).
The origin of the selectivity towards ketone hydrogenation
Since both in situ and ex situ experiments have unambiguously proven that [RuBr2(CO)3]2 is the main active species necessary for the C![[double bond, length as m-dash]](https://www.rsc.org/images/entities/char_e001.gif) O hydrogenation, a screening of possible intermediate states in the hydrogenation of acetone and propene was performed at DFT level of theory, based on the minimal energy of their relaxed structures. In addition, the transition states and the height of the barriers for the adsorption of acetone and propene on the Ru complex were determined (Fig. 8).
O hydrogenation, a screening of possible intermediate states in the hydrogenation of acetone and propene was performed at DFT level of theory, based on the minimal energy of their relaxed structures. In addition, the transition states and the height of the barriers for the adsorption of acetone and propene on the Ru complex were determined (Fig. 8).
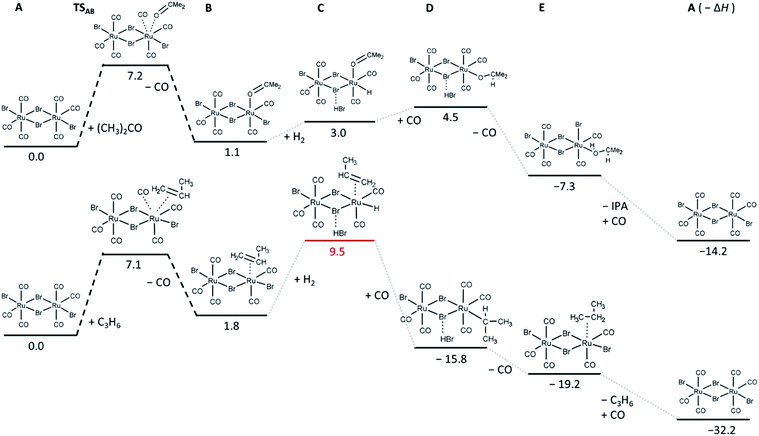 | ||
| Fig. 8 Relative energies in kcal mol−1 of the most stable intermediates and first transition state determined for acetone (top) and propene (bottom) hydrogenation reactions. The corresponding relaxed structures and output files are attached in ESI.† | ||
In particular, the exchange of a CO ligand by acetone results in very small (in case of one-side reaction) or slightly negative (in case of both Ru-sites involved, shown in Fig. S6†) reaction enthalpies (Fig. 8), with an energy barrier of about 7 kcal mol−1. Relatively small reaction enthalpies are also obtained for the next intermediate steps (dissociation of H2 and carbonyl hydrogenation). For the hydrogenation of propene, the barrier for propene coordination instead of CO ligand is similar to that obtained for the acetone case, but it leads to the formation of an intermediate state with higher energy, indicating that in the competition, coordination of acetone is more favourable. The next step involving H2 is significantly unfavourable compared to the acetone case, which might again explain the selectivity of the [RuBr2(CO)3]2 system towards C![[double bond, length as m-dash]](https://www.rsc.org/images/entities/char_e001.gif) O hydrogenation over C
O hydrogenation over C![[double bond, length as m-dash]](https://www.rsc.org/images/entities/char_e001.gif) C hydrogenation. C
C hydrogenation. C![[double bond, length as m-dash]](https://www.rsc.org/images/entities/char_e001.gif) C hydrogenation over Ru0 was not simulated, since olefin hydrogenation over active noble metal nanoparticles is well known.
C hydrogenation over Ru0 was not simulated, since olefin hydrogenation over active noble metal nanoparticles is well known.
Conclusions
Combining catalytic testing with in-depth characterization of the local structure of Ru-atoms by XANES and EXAFS, we have unambiguously shown the evolution of Ru-species and established important structure–activity and structure–selectivity relationships which were additionally supported by theoretical computations. The active [RuBr2(CO)3]2 species are formed from RuBr3 in Bu4PBr in presence of CO gas during a pretreatment step, which is crucial to convert dissolved RuBrx into the active complex. These species selectively hydrogenate C![[double bond, length as m-dash]](https://www.rsc.org/images/entities/char_e001.gif) O bonds over C
O bonds over C![[double bond, length as m-dash]](https://www.rsc.org/images/entities/char_e001.gif) C bonds due to favored coordination of ketones over alkenes on Ru sites and unfavorable intermediate states involving H2 dissociation for the latter case, exemplified using acetone and propene as a substrate. Without a CO source, these species can disintegrate to RuBrx which under reaction conditions could be reduced to Ru0 clusters responsible for unselective C
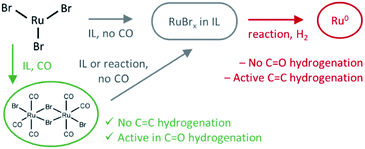
C bonds due to favored coordination of ketones over alkenes on Ru sites and unfavorable intermediate states involving H2 dissociation for the latter case, exemplified using acetone and propene as a substrate. Without a CO source, these species can disintegrate to RuBrx which under reaction conditions could be reduced to Ru0 clusters responsible for unselective C![[double bond, length as m-dash]](https://www.rsc.org/images/entities/char_e001.gif) C hydrogenation. Disintegration to RuBrx occurs in the IL in absence of CO and when the pre-made catalysts are dissolved and CO is lost; this was the case for both [RuX2(CO)3]2 (X = Br,Cl) complexes. If a Cl-containing precursor is used, a Cl−–Br− exchange was identified in the Br-rich environment (IL) for all studied samples, resulting in the formation of the corresponding Br-containing complexes. These results give a complete understanding of the evolution of Ru species, summarized in Scheme 2, applied for the homogeneous catalytic valorization of biobased (waste) polyols to olefins, indicating the undesired routes of its deactivation and possibilities for reactivation.
C hydrogenation. Disintegration to RuBrx occurs in the IL in absence of CO and when the pre-made catalysts are dissolved and CO is lost; this was the case for both [RuX2(CO)3]2 (X = Br,Cl) complexes. If a Cl-containing precursor is used, a Cl−–Br− exchange was identified in the Br-rich environment (IL) for all studied samples, resulting in the formation of the corresponding Br-containing complexes. These results give a complete understanding of the evolution of Ru species, summarized in Scheme 2, applied for the homogeneous catalytic valorization of biobased (waste) polyols to olefins, indicating the undesired routes of its deactivation and possibilities for reactivation.
Data availability
The datasets supporting this article have been uploaded as part of the ESI material.†Author contributions
K. J. performed the synthesis and catalytic testing. K. J., A. L. B., V. L. S. S., A. A. G., E. G. K. and O. A. U. measured XAS data. A. L. B. and E. G. K., performed XAS analysis and DFT calculations. K. J. and A. L. B. wrote the manuscript. A. V. S. and D. D. V. provided the funding, did the conceptualization and critical reading of the manuscript.Conflicts of interest
There are no conflicts to declare.Acknowledgements
K. J., V. L., S. S. and D. D. V. thank FWO for funding (G0D0518N, G0781118N and G0F2320N), the Flemish government for long-term structural funding through Methusalem, and EoS (Biofact) for financial support. A. L. B, E. G. K., A. A. G., O. A. U. and A. V. S. acknowledge Russian Science Foundation grant #20-43-01015 (Joint RSF-FWO project) for the financial support (XAS measurements at ESRF and ALBA beamlines, data analysis). The in situ XAS measurements and the design of the high-pressure cell were supported by Ministry of Science and Higher Education of the Russian Federation (Agreement #075-15-2021-1363). Analysis of big experimental datasets and MCR-ALS of in situ data was performed in frame of RFBR project #19-32-60083 granted to A. L. B. We acknowledge the European Synchrotron Radiation Facility for providing the beamtime (proposal MA-4443) at BM23 beamline and Dr Kirill Lomachenko for the professional support. We acknowledge the collaboration with the staff of ALBA synchrotron for the additional measurements performed at CLAESS beamline. We acknowledge SOLEIL for provision of synchrotron radiation facilities and we would like to thank Emiliano Fonda for assistance during in situ XAS measurements at beamline SAMBA (proposal 20210394). We also acknowledge Victor Shapovalov and the team of the Research and education center Functional Nanomaterials of the Baltic Federal University (Kaliningrad, Russia) for their help in the design and production of the in situ XAS cell.Notes and references
- P. A. Dub and J. C. Gordon, Nat. Rev. Chem., 2018, 2, 396–408 CrossRef CAS
.
- D. Evans, J. A. Osborn, F. H. Jardine and G. Wilkinson, Nature, 1965, 208, 1203–1204 CrossRef CAS
.
- T. Ohkuma, H. Ooka, S. Hashiguchi, T. Ikariya and R. Noyori, J. Am. Chem. Soc., 1995, 117, 2675–2676 CrossRef CAS
.
- R. Noyori and T. Ohkuma, Angew. Chem., Int. Ed., 2001, 40, 40–73 CrossRef CAS PubMed
.
- G. Braca, A. M. Raspolli Galletti and G. Sbrana, J. Organomet. Chem., 1991, 417, 41–49 CrossRef CAS
.
- M. Stalpaert, K. Janssens, C. Marquez, M. Henrion, A. L. Bugaev, A. V. Soldatov and D. E. De Vos, ACS Catal., 2020, 10, 9401–9409 CrossRef CAS
.
- K. Janssens, M. Stalpaert, M. Henrion and D. E. De Vos, Chem. Commun., 2021, 57, 6324–6327 RSC
.
- B. F. G. Johnson, R. D. Johnston, P. L. Josty, J. Lewis and I. G. Williams, Nature, 1967, 213, 901–902 CrossRef CAS
.
- E. G. Kozyr, A. L. Bugaev, S. A. Guda, A. A. Guda, K. A. Lomachenko, K. Janssens, S. Smolders, D. De Vos and A. V. Soldatov, J. Phys. Chem. C, 2021, 125, 27844–27852 CrossRef CAS
.
- A. Martini, A. L. Bugaev, S. A. Guda, A. A. Guda, E. Priola, E. Borfecchia, S. Smolders, K. Janssens, D. De Vos and A. V. Soldatov, J. Phys. Chem. A, 2021, 125, 7080–7091 CrossRef CAS PubMed
.
- B. Ravel and M. Newville, J. Synchrotron Radiat., 2005, 12, 537–541 CrossRef CAS PubMed
.
- S. I. Zabinsky, J. J. Rehr, A. Ankudinov, R. C. Albers and M. J. Eller, Phys. Rev. B, 1995, 52, 2995–3009 CrossRef CAS PubMed
.
- A. Martini, S. A. Guda, A. A. Guda, G. Smolentsev, A. Algasov, O. Usoltsev, M. A. Soldatov, A. Bugaev, Y. Rusalev, C. Lamberti and A. V. Soldatov, Comput. Phys. Commun., 2020, 250, 107064 CrossRef CAS
.
- J. Jaumot, R. Gargallo, A. de Juan and R. Tauler, Chemom. Intell. Lab. Syst., 2005, 76, 101–110 CrossRef CAS
.
- R. Tauler, Chemom. Intell. Lab. Syst., 1995, 30, 133–146 CrossRef CAS
.
- J. Jaumot, A. de Juan and R. Tauler, Chemom. Intell. Lab. Syst., 2015, 140, 1–12 CrossRef CAS
.
- G. te Velde, F. M. Bickelhaupt, E. J. Baerends, C. Fonseca Guerra, S. J. A. van Gisbergen, J. G. Snijders and T. Ziegler, J. Comput. Chem., 2001, 22, 931–967 CrossRef CAS
.
- A. D. Becke, Phys. Rev. A, 1988, 38, 3098–3100 CrossRef CAS PubMed
.
- S. Grimme, J. Antony, S. Ehrlich and H. Krieg, J. Chem. Phys., 2010, 132, 154104 CrossRef PubMed
.
- C. Lee, W. Yang and R. G. Parr, Phys. Rev. B, 1988, 37, 785–789 CrossRef CAS PubMed
.
- E. van Lenthe and E. J. Baerends, J. Comput. Chem., 2003, 24, 1142–1156 CrossRef CAS PubMed
.
- E. van Lenthe, A. Ehlers and E.-J. Baerends, J. Chem. Phys., 1999, 110, 8943–8953 CrossRef CAS
.
- B. F. G. Johnson, R. D. Johnston and J. Lewis, J. Chem. Soc. A, 1969, 792–797 RSC
.
Footnote |
| † Electronic supplementary information (ESI) available: Details of Product analysis, catalytic tests, XAS analysis and DFT calculations. See https://doi.org/10.1039/d2sc02150a |
| This journal is © The Royal Society of Chemistry 2022 |


