
 Open Access Article
 This Open Access Article is licensed under a Creative Commons Attribution-Non Commercial 3.0 Unported Licence
A two-photon ratiometric fluorescent probe for real-time imaging and quantification of NO in neural stem cells during activation regulation†
Mengyu
Liang
,
Zhichao
Liu
*,
Zhonghui
Zhang
,
Yuxiao
Mei
and
Yang
Tian
 *
*
Department of Chemistry, School of Chemistry and Molecular Engineering, East China Normal University, Dongchuan Road 500, Shanghai 200241, China. E-mail: ytian@chem.ecnu.edu.cn; zcliu@chem.ecnu.edu.cn
First published on 21st March 2022
Abstract
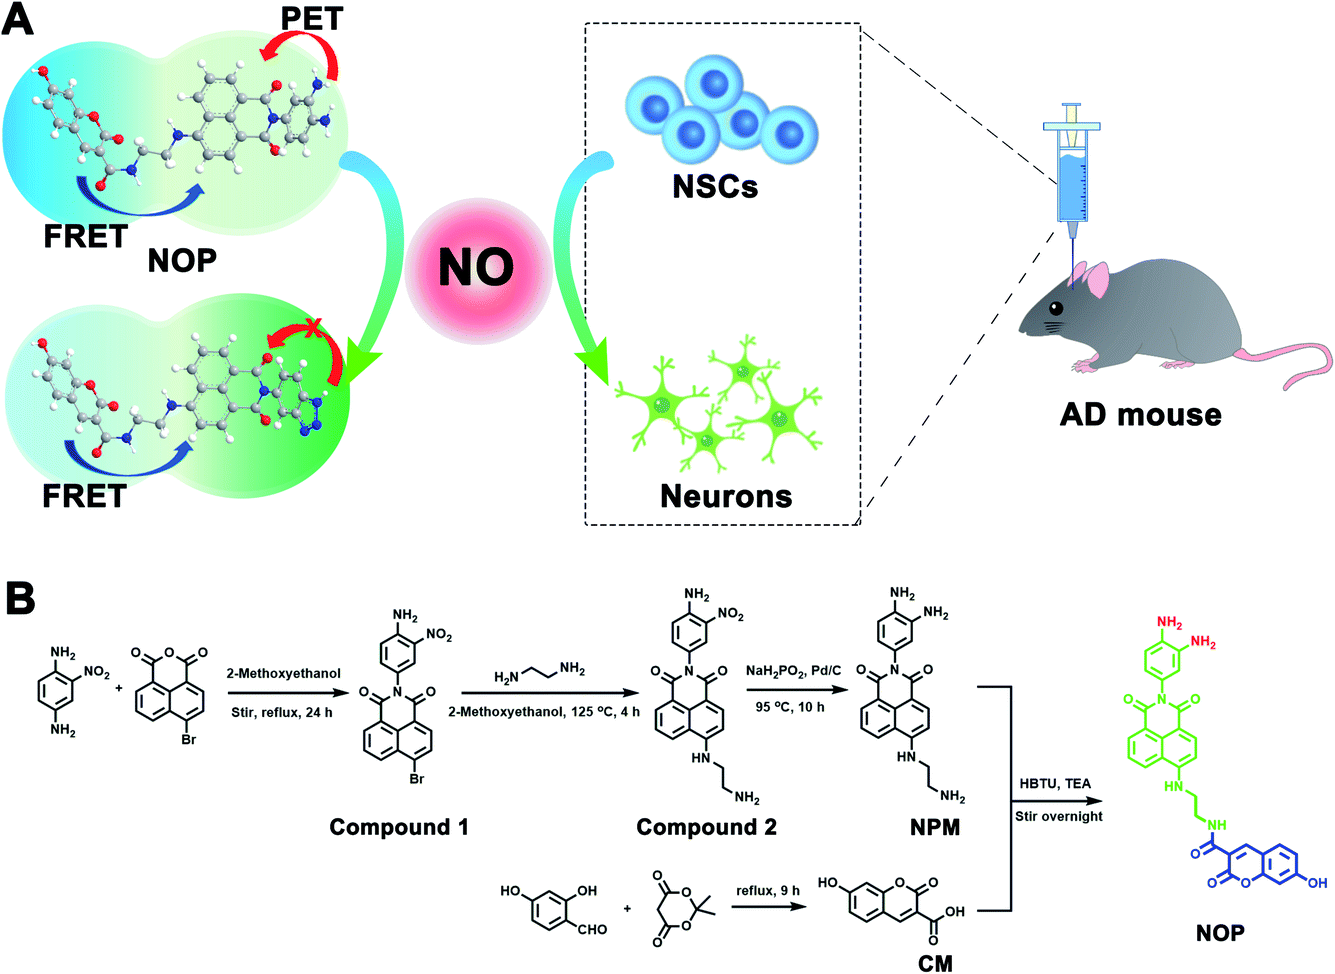
Developing a novel tool capable of real-time monitoring and accurate quantification of NO is critical to understanding its role in physiological and pathological processes. Herein, a two-photon ratiometric fluorescent probe (NOP) was developed for real-time imaging and quantification of NO based on fluorescence resonance energy transfer-photoinduced electron transfer (FRET-PET). In this developed probe, coumarin (CM) and naphthalimide with o-phenylenediamine (NPM) were rationally designed as a fluorescent donor and acceptor, respectively, to enable a ratiometric fluorescence response to NO. The developed NO probe demonstrated good detection linearity with the concentration of NO in the range of 0.100–200 μM, with a detection limit of 19.5 ± 1.00 nM. Considering the advantages of high selectivity, good accuracy and rapid dynamic response (<15 s), the developed NO probe was successfully applied for real-time imaging and accurate quantification of NO in neural stem cells (NSCs) and different regions of mouse brain tissue with a penetration depth of 350 μm. Using this powerful tool, it was found that NO regulated the activation and differentiation of quiescent NSCs (qNSCs). In addition, NO-induced differentiation of qNSCs into neurons was found to be dose-dependent: 50.0 μM NO caused about 50.0% of qNSCs to differentiate into neurons. Moreover, different regions of the mouse brain were observed to be closely related to the concentration of NO, and the concentration of NO in the DG region was found to be lower than that in the S1BF, CA1, LD and CPu of the Alzheimer's disease (AD) mouse brain. The symptoms of AD mice were significantly improved through the treatment with NO-activated NSCs in the DG region.
Introduction
Nitric oxide (NO), an important neuromodulator, involves many kinds of cell functions, including neurotransmission, growth, proliferation and differentiation.1–4 The homeostasis of NO is closely related to various physiological and pathological processes. Excessive and unregulated NO in cells is associated with many diseases, such as neurodegenerative diseases like Alzheimer's disease (AD), Parkinson's disease, inflammation and cardiovascular disease.5–8 Therefore, it is of great significance to develop a capable tool, for the quantification of NO with high selectivity and accuracy, especially in complex biological environments such as living cells and tissues.To this end, a series of non-invasive fluorescence methods have been developed for the determination of NO with high temporal and spatial resolution.9–12 In particular, fluorescent probes combined with two-photon excitation have aroused great interest for real-time imaging of intracellular NO, due to the deeper penetration depth (>300 μm) and reduced cellular autofluorescence than one-photon excitation.13–16 However, almost all of the two-photon fluorescent probes for NO are single emission, which makes them difficult to use for quantitative analysis of NO in living organisms. Our group has developed a series of novel ratiometric probes with dual-signal output, for sensing and quantifying chemical species such as reactive oxygen species (ROS), metal ions, and pH in living cells, tissues, and in vivo.17–25 Nevertheless, due to the lack of spectrally matched fluorescent donor–acceptor pairs with remarkable two-photon emission properties, and new NO-specific recognition ligands, it is challenging work to develop a two-photon ratiometric fluorescent probe, for selective real-time imaging and accurate quantification of NO, to understand the critical role of NO in physiological and pathological processes, especially in live cells and brain tissues.
Herein, a two-photon ratiometric fluorescent probe (named NOP) was designed and synthesized for selective and accurate determination of NO based on fluorescence resonance energy transfer-photoinduced electron transfer (FRET-PET), in which coumarin (CM) was designed as a donor and a naphthalimide with o-phenylenediamine (NPM) was used as a fluorescent acceptor for specific recognition of NO (Scheme 1A). The developed NO probe showed two separated fluorescence emissions at around ∼455 and ∼535 nm under a two-photon excitation of 700 nm. In addition, the NO probe exhibited high selectivity and accuracy, which displayed good linearity with the concentration of NO from 0.100–200 μM with the detection limit (LOD) down to 19.5 ± 1.00 nM. Taking advantage of the developed two-photon ratiometric fluorescent probe with a rapid dynamic response (<15 s) and good biocompatibility, the present probe was successfully applied for real-time imaging and accurate quantification of NO in neural stem cells (NSCs) and brain tissues. By using the developed probe, it was found that the concentration of NO in activated NSCs (aNSCs) was higher than in quiescent NSCs (qNSCs), and the activation of qNSCs induced by the epidermal growth factor and basic fibroblast growth factor was regulated by NO. In addition, NO-induced differentiation of qNSCs into neurons was found to be dose-dependent; 50 μM NO was found to effectively promote the activation and differentiation of qNSCs into neurons. From two-photon microscope images of NO in the brain tissues, it was discovered that the concentration of NO was different in different brain regions, and the concentration of NO in the hippocampus DG (DG) was observed to be lower than that in the primary somatosensory cortex (S1BF), hippocampus CA1 (CA1), caudate putamen (CPu), and laterodorsal thalamic nucleus (LD) of the AD mouse brain. More importantly, the memory and cognitive ability of AD mice were significantly improved through treatment with NO-activated NSCs in the DG region.
 | ||
| Scheme 1 (A) Illustration of the working principle for the developed NO probe (NOP). (B) Synthesis route for the NOP. | ||
Results and discussion
Design, synthesis and characterization of the NO probe
First, a two-photon ratiometric fluorescent probe was designed and synthesized for the selective determination of NO based on FRET-PET, named NOP. As shown in Scheme 1B, the NOP consists of two parts: one is naphthalimide with o-phenylenediamine (NPM) as the fluorescent acceptor for the specific recognition of NO, and the other part is coumarin (CM) set as the fluorescent donor. The NOP and intermediates were characterized by nuclear magnetic resonance (NMR) and mass spectroscopy (MS) (Fig. S1–S15, ESI†). In addition, the Fourier transform infrared (FT-IR) spectrum confirmed that the NOP contains typical functional groups of –NH2 (3336 and 1568 cm−1), –OH (3068 cm−1) and C![[double bond, length as m-dash]](https://www.rsc.org/images/entities/char_e001.gif) O (1754 cm−1), respectively (Fig. 1A). These results proved the successful synthesis of the NOP.
O (1754 cm−1), respectively (Fig. 1A). These results proved the successful synthesis of the NOP.
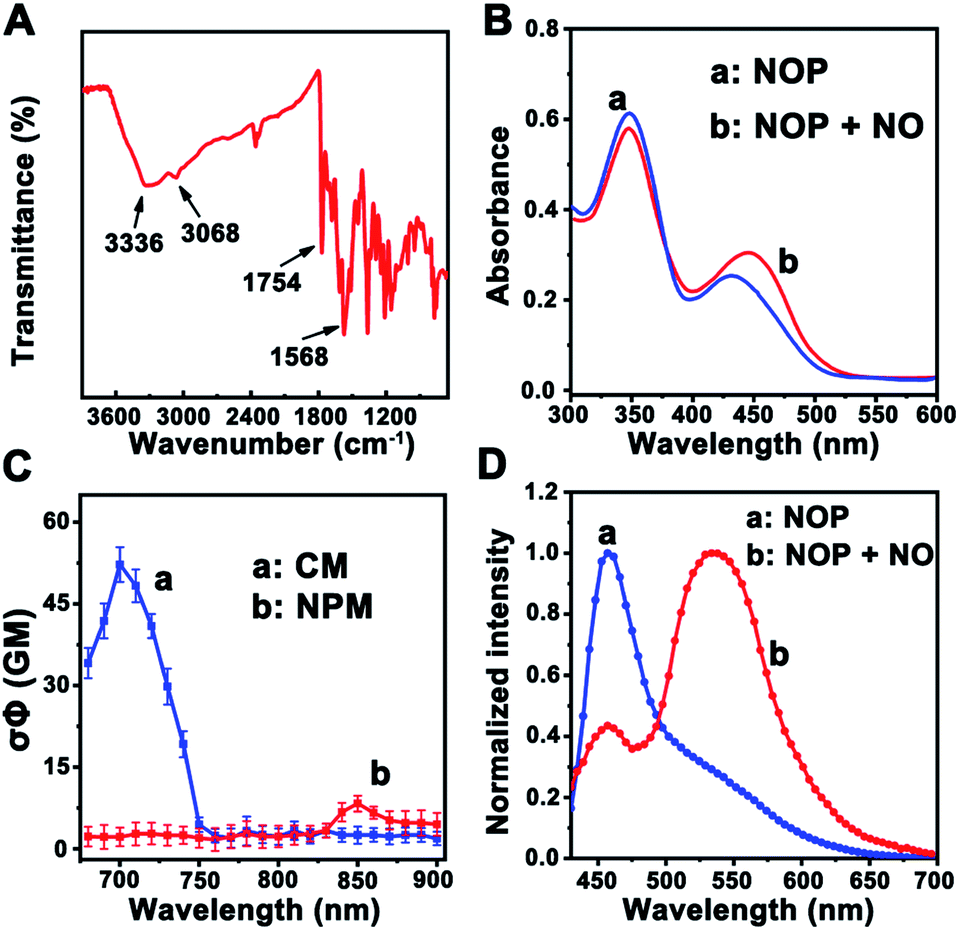 | ||
| Fig. 1 (A) FT-IR spectrum of the developed NOP. (B) UV-vis absorption spectra of the NOP in the absence (a) and in the presence (b) of NO (50.0 μM), respectively. (C) Two-photon action spectra of CM (a) and NPM (b), respectively. (D) TPF emission spectra of the NOP before (a) and after (b) addition of NO (200.0 μM) under excitation at 700 nm. | ||
In addition, the UV-vis absorption spectrum of the NOP (10 μM) showed two apparent peaks at around 350 nm and 430 nm (Fig. 1B), which can be attributed to the n → π* transition of CM and NPM, respectively. After the NOP was reacted with NO, the absorption peak that belongs to NPM was red-shifted to ∼445 nm. This observation can be attributed to the conjugate extension, resulted from the formation of benzotriazole through the reaction between NPM and NO.26 It should be noted that the absorption of CM was obviously decreased. On the other hand, the two-photon action spectra of CM and NPM were measured. As shown in Fig. 1C, the maximum two-photon action cross section (σΦ) value of CM was calculated to be 53.0 ± 3.20 GM (rhodamine 6G in methanol as the standard) under the excitation of a 700 nm laser, while a weak σΦ value was calculated for NPM (7.5 ± 1.0 GM). Thus, the optimal two-photon excitation wavelength for the NOP was selected as 700 nm. As expected, with excitation at 700 nm, the NOP displayed a strong two-photon fluorescence (TPF) emission at around 455 nm and a weak TFP emission at around 535 nm (Fig. 1D). Interestingly, after the NOP was reacted with NO, the TPF intensity of the NOP at around 455 nm was decreased, while that of the NOP at around 535 nm was obviously increased, demonstrating a ratiometric response of the NO probe toward NO.
Analytical performance of the developed NO probe toward NO
Next, the ability of the NOP for the determination of NO was further estimated in cell lysates. As shown in Fig. 2A, TPF intensity of the NOP at around 455 nm (Fblue: 440–490 nm) was gradually decreased with increasing concentrations of NO from 0 to 320 μM, while that intensity at around 535 nm (Fgreen: 520–600 nm) was obviously increased. After subtracting the background fluorescence at ∼440–490 nm and ∼520–600 nm (Fig. S16, ESI†), the intensity ratio between Fgreen and Fblue (Fgreen/Fblue) exhibited good linearity with the NO concentration in the range of 0.100–200 μM (Fig. 2B). The obtained detection linear range was wider than that of previously reported fluorescent NO probes.10–12,27,28 The detection limit was estimated as 19.5 ± 1.00 nM (S/N = 3, n = 5), lower than most previously reported ratiometric fluorescence NO probes (Table S1, ESI†). In addition, the developed NO probe showed rapid dynamics toward NO, with a response time of 15.0 ± 1.00 s (Fig. 2C), which was faster than the reported fluorescent NO probes.10,11,29–31 The rapid dynamic response contributes to real-time sensing and imaging of NO in living cells. Moreover, no obvious (<5.0%) fluorescence decrease was observed for the NOP after it was exposed to a Xe lamp (90 W) for 2.5 h (Fig. 2D), demonstrating the long-term photostability of the developed NO probe. These results proved that this probe can be used for the ratiometric determination of NO with high stability and a rapid response.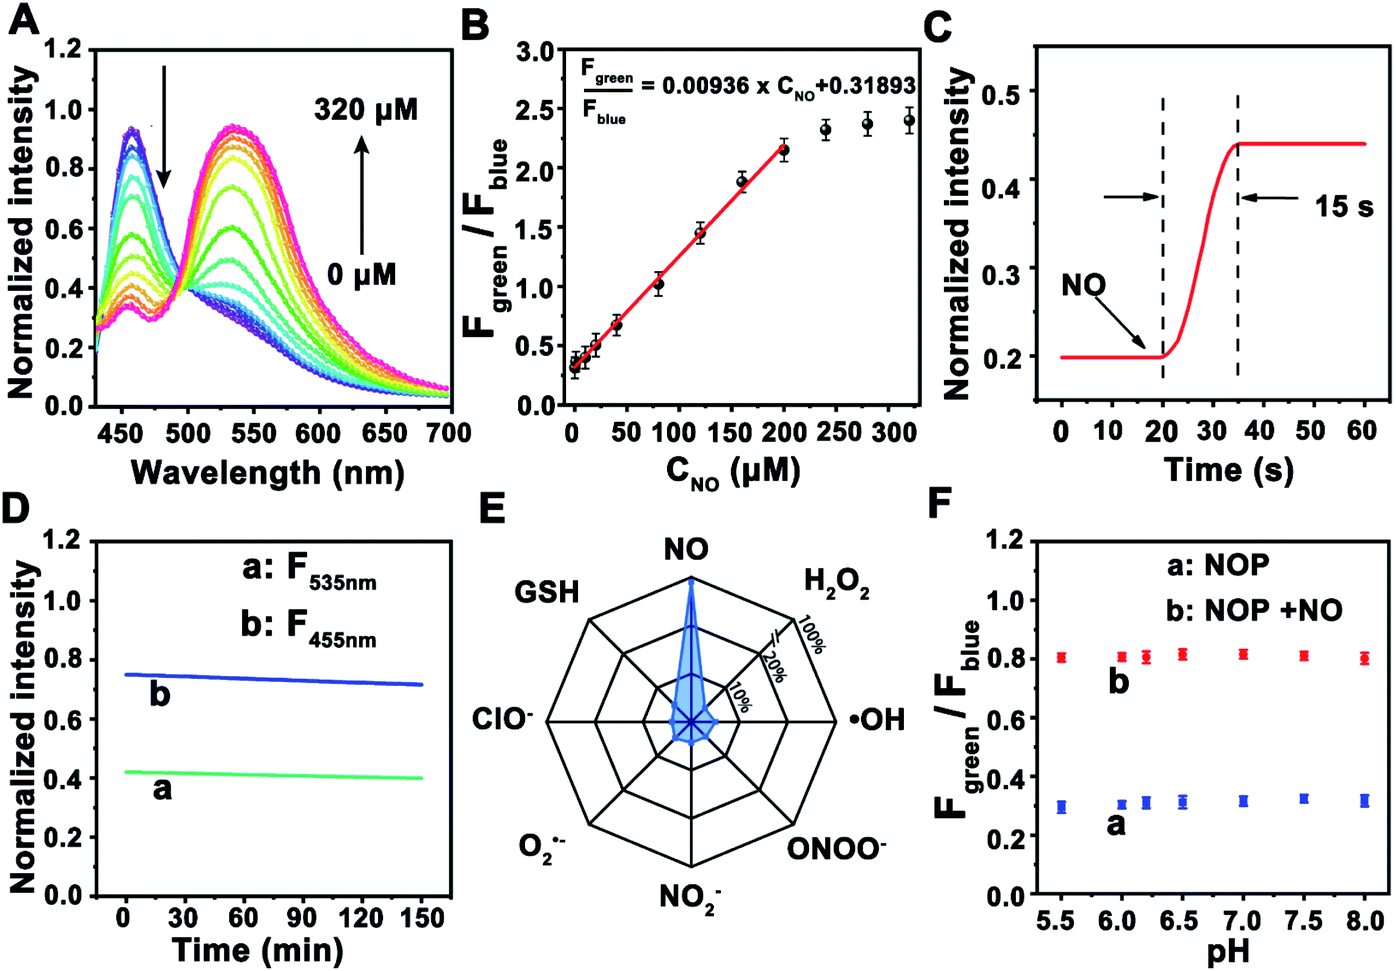 | ||
| Fig. 2 (A) TPF emission spectra of the NOP with the addition of different concentrations of NO (0, 0.1, 10.0, 20.0, 40.0, 80.0, 120.0, 160.0, 200.0, 240.0, 280.0, and 320.0 μM) in cell lysates. (B) Calibration curve between Fgreen/Fblue and various concentrations of NO (n = 5, S. D.). (C) Response time of the NOP with the addition of NO (50 μM). (D) Photostability of the NOP at 455 nm (F455nm) and 535 nm (F535nm) after the NOP was exposed to a Xe lamp (90 W). (E) Selectivity tests of the NOP toward common RNS (100 μM) and ROS (100 μM). (F) Fgreen/Fblue values of the NOP at pH 5.0–8.0 in the absence (a) and in the presence (b) of NO (50 μM) (n = 5, S. D.). | ||
Considering that there are many types of reactive nitrogen species/reactive oxygen species (RNS/ROS) as well as the complex environment in cells, the selectivity of the NOP toward common RNS, ROS, metal ions, amino acids and neurotransmitters was further evaluated. As shown in Fig. 2E, no apparent interference (<4.2%) was observed from RNS/ROS (100 μM) including H2O2, ˙OH, ClO−, O2˙−, ONOO−, and NO2−. Meanwhile, seldom signal effect (<2.4%) was found from metal ions such as K+ (100 mM), Ca2+ (10 mM), Na+ (50 mM), Mg2+, Mn2+, Fe3+, Cu2+, amino acids (100 μM) and neurotransmitters (50 μM) including 5-HT, NA, AA, UA and DA (Fig. S17, ESI†). Moreover, the competition test results demonstrated that these potential interferences had a negligible influence (<2.0%) on the fluorescence responses of the NOP toward NO (Fig. S17, ESI†). Furthermore, no apparent change (<4.7%) was observed in the fluorescent signal of the NOP between pH 5.0–8.0 in the absence and in the presence of NO (Fig. 2F). The results further demonstrated that the developed NO probe was suitable for NO sensing with high selectivity.
Fluorescence mechanism of the NOP toward NO
Then, the sensing mechanism of the NOP toward NO was investigated. As shown in Fig. 3A, the fluorescence emission peak of CM was observed at around 455 nm, which exhibits sufficient spectral overlap with the absorption of NPM in the absence or in the presence of NO. In addition, with the addition of NO, the fluorescence lifetime of CM was shortened from 5.1 ns (100.0%) to 3.6 ns (100.0%) (Fig. 3B), while that of NPM was prolonged from 2.7 ns (τ1: 1.6 ns, 94.5%; τ2: 7.1 ns, 5.5%) to 5.9 ns (τ1: 1.7 ns, 34.0%; τ2: 6.5 ns, 66.0%) (Fig. 3C), proving FRET occurred between CM and NPM of the NOP molecule. The FRET efficiency of the NOP was calculated to be 0.54 ± 0.0100 (n = 10, S. D.) and 0.81 ± 0.0100 (n = 10, S. D.) in the absence and in the presence of NO (200 μM), respectively (Fig. S18, ESI†).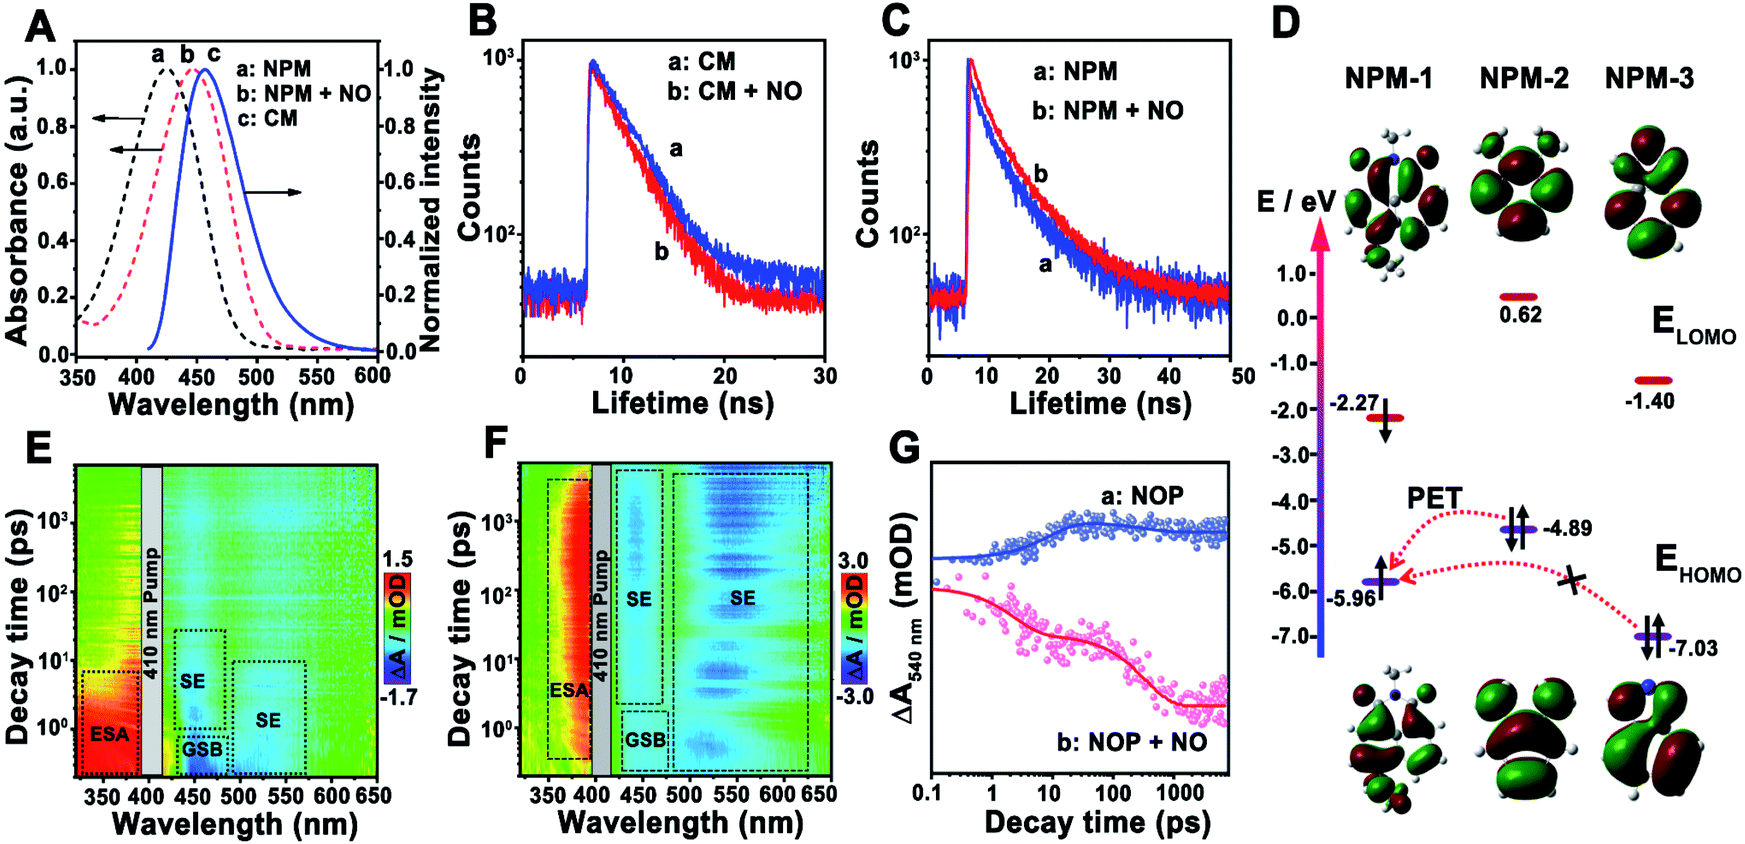 | ||
| Fig. 3 (A) Absorption spectra of NPM in the absence (a) and in the presence (b) of NO, respectively, and the fluorescence emission spectrum of CM (c). (B) Fluorescence lifetime decay curves of the NOP collected from 440–490 nm in the absence (a) and in the presence (b) of NO (50 μM). (C) Fluorescence lifetime decay curves of the NOP collected from 520–600 nm in the absence (a) and in the presence (b) of NO (50 μM). (D) EHOMO and ELUMO of NPM-1, NPM-2 and NPM-3 obtained by DFT calculations, respectively. (E and F) Broadband transient absorption spectra of the NOP in the absence (E) and in the presence (F) of NO (50 μM), respectively. (G) Kinetics at 540 nm extracted from the TA spectra of the NOP in the absence (a) and in the presence (b) of NO (50 μM), respectively. | ||
On the other hand, the highest occupied molecular orbital (HOMO) and the lowest unoccupied molecular orbital (LUMO) of different parts of the fluorescent acceptor (NPM-1, NPM-2 and NMP-3) in the NOP molecule were calculated by density functional theory (DFT) calculations (Fig. S19, ESI†). As shown in Fig. 3D, the energy levels of the HOMO (EHOMO) and LUMO (ELUMO) of NPM-1 were calculated to be −5.96 eV and −2.27 eV, respectively. Since the EHOMO of NPM-2 was −4.89 eV, photoinduced electron transfer (PET) may occur between NPM-2 and NPM-1. As demonstrated in the ultrafast transient absorption (TA) spectra of the NOP, an obvious excited-state absorbance (ESA) at around 350 nm and a ground state beaching (GSB) at around 450 nm were found for the NOP (Fig. 3E). Meanwhile, a strong stimulated emission (SE) signal at around 440 nm and a weak SE signal at around 540 nm were also observed, which belong to the fluorescence emission of CM and NPM, respectively. Moreover, as shown by the kinetic results of NOP in Fig. 3G, the SE signal of the NOP at around 540 nm was quickly established within 8.9 ± 1.4 ps and decayed slowly (>7.0 ns), confirming that PET occurred between NPM-2 and NPM-1, further causing the suppression of the fluorescence emission of NPM. However, after the NOP was reacted with NO, NPM-2 in the NOP molecule was formed as NPM-3, and the EHOMO of NPM-3 was decreased to −7.03 eV. Thus, the PET process between NPM-3 and NPM-1 may be prevented. As shown by the result in Fig. 3F, a strong SE signal belonging to the fluorescence emission of NPM was observed at around 540 nm in the presence of NO, accompanied by two decay lifetimes of 2.4 ± 0.10 ps (43.6%) and 343.6 ± 10.50 ps (56.4%) (Fig. 3G), confirming that the PET process was prevented between NPM-3 and NMP-1, which recovered the fluorescence emission of NPM. These results demonstrated that FRET-PET was the fluorescence mechanism of the developed NO probe toward NO.
Real-time imaging and quantification of NO during the activation of neural stem cells (NSCs)
Before applying the developed NO probe for biosensing of NO in living cells, the cytotoxicity and biocompatibility of the NOP were estimated by using 3-(4,5-dimethyl-2-thiazolyl)-2,5-diphenyl-2H-tetrazolium bromide (MTT) and flow cytometry analysis. Cell viability was higher than 91.0 ± 2.00% even after the cells were incubated with the NOP (90 μM) for 48 h (Fig. S20, ESI†). Meanwhile, the flow cytometry results indicated that few apoptotic cells (<6.8%) were detected after the cells were incubated with the NO probe (90 μM) for 48 h (Fig. S21, ESI†). In addition, no apparent trauma was observed for brain tissues even after the brain tissues were incubated with 90 μM NOP for 60 min (Fig. S22, ESI†). These results proved the low cytotoxicity and good biocompatibility of the developed NO probe in live cells and brain tissues. On the other hand, the co-localization experimental results showed that the NOP entered cells and was mainly located in the cytoplasm of quiescent NSCs (qNSCs), with a Pearson's correlation coefficient of 0.92 (Fig. 4A). It should be noted that the used qNSCs were confirmed by western blot (Fig. S23, ESI†). Importantly, the developed NO probe remained stable in qNSCs for at least 10 h with the fluorescence signal decreasing by less than 4.2% (Fig. 4B and S24, ESI†), demonstrating the high stability of the NOP in cells. | ||
| Fig. 4 (A) Colocalization images of qNSCs incubated with the NOP and CellTracker Red. (B) Fluorescence signal of the NOP obtained from qNSCs after incubating with the NOP for different times. (n = 50, S. D.) (C) Fluorescence images of NSCs collected from the blue (440–490 nm), green (520–600 nm) and Fgreen/Fblue channels stimulated with EGF and bFGF for 0, 30, 60, 90, 120, 180, 240, 330 s, and 300 s in the presence of cPITO. (D) Summarized data for the Fgreen/Fblue value obtained from (C). (n = 50, S. D.) (E) FACS results of qNSCs before (a) and after (b) being stimulated by EGF and bFGF for 300 s and (c) 300 s in the presence of cPTIO, respectively. EGFR and CD133 are characteristic proteins of aNSCs and NSCs, respectively. (n = 5, S. D.) (F) Fluorescence imaging of qNSCs collected from blue (440–490 nm), green (520–600 nm) and Fgreen/Fblue channels treated with the NO probe after qNSCs were stimulated with different concentrations of NO (0, 10, 30, 50, and 70 μM in the presence of cPTIO) for 300 s, and then the stimulated qNSCs were cultured for 24 h. (G) Summarized data for the Fgreen/Fblue value obtained from (F). (n = 50, S. D.) (H) FACS results of qNSCs after being stimulated with different concentrations of NO (0, 10, 30, 50, and 70 μM in the presence of cPTIO) for 300 s, and then the stimulated qNSCs were cultured for 24 h. (n = 5, S. D.) Tuji is a characteristic protein of neurons and DAPI is used to characterize living cells. | ||
Subsequently, the NO probe was used for imaging and quantification of NO in qNSCs. With the increasing concentrations of exogenous NO from 0 to 100 μM, the fluorescence intensity of qNSCs collected from the green channel (Fgreen: 520–600 nm) was gradually increased, while that collected from the blue channel (Fblue: 440–490 nm) obviously decreased (Fig. S25, ESI†). The fluorescence intensity ratio of the green channel to the blue channel (Fgreen/Fblue) was increased from 0.39 ± 0.020 to 1.44 ± 0.0500, indicating that our developed NO probe can be used for intracellular NO detection (Fig. S25, ESI†). Interestingly, the concentration of endogenous NO in qNSCs was estimated to be 7.5 ± 0.20 μM (n = 50, S. D.) based on the ratiometric quantitative analysis.
Since only active NSCs (aNSCs) can differentiate into neurons, it is very important to study the mechanism of qNSC activation.32–34 Nevertheless, studying the activation process of qNSCs is still challenging, due to the rapid activation process of qNSCs. Taking advantage of the developed NO probe with rapid dynamic response and high selectivity, the concentration of NO was further quantified during the activation of qNSC induced by the epidermal growth factor (EGF) and basic fibroblast growth factor (bFGF). As shown in Fig. 4C, after the qNSCs were stimulated by EGF and bFGF, the fluorescence intensity of the green channel obviously increased within 240 s, while that of the blue channel changed oppositely. The intensities of both channels remained stable after qNSCs were stimulated by EGF and bFGF for 300 s. The results indicated a fast increase of NO in qNSCs during the stimulation. Based on the ratiometric quantitative analysis, the concentration of NO in qNSCs was increased to 14.5 ± 0.300 μM (n = 50, S. D.) after being stimulated by EGF and bFGF for 300 s (Fig. 4D). Meanwhile, the fluorescence-activated cell sorting (FACS) results showed that 41.4 ± 1.70% of qNSCs (n = 5, S. D.) were transformed into aNSCs after being stimulated by EGF and bFGF for 300 s, suggesting that NO plays an important role in the activation of qNSCs (Fig. 4E). As expected, seldom signal increase (<8.2%) was observed for NO in qNSCs in the presence of cPTIO (a NO scavenger) after being stimulated by EGF and bFGF for 300 s. To our surprise, only 9.3 ± 1.5% of qNSCs (n = 5, S. D.) were transformed into aNSCs after qNSCs were stimulated by EGF and bFGF for 300 s in the presence of cPTIO. These results strongly proved that EGF and bFGF induced activation of qNSCs was regulated by NO.
Then, different concentrations of NO were directly used to activate qNSCs through continuous stimulation for 300 s, and thereafter to wait for the differentiation of qNSCs. It should be noted that the concentrations of stimulated NO showed no apparent neurotoxicity (cell viability higher than 80.0%) on qNSCs even after stimulation for 24 h (Fig. S26, ESI†). As shown in Fig. 4F, after qNSCs were stimulated with different concentrations of NO, the fluorescence intensity of the blue channel in qNSCs gradually decreased while that of the green channel increased obviously, indicating that the concentration of endogenous NO in qNSCs was increased with the stimulation of exogenous NO. Interestingly, with the increasing concentration of NO, the morphology of qNSCs gradually changed from round to a slender shape with abundant synapses, suggesting that qNSCs were activated and differentiated into neurons by the stimulation of NO. Taking advantage of ratiometric quantitative analysis, the concentration of NO in neurons was estimated to be 30.9 ± 1.00 μM (n = 50, S. D.) (Fig. 4G). Moreover, as shown by the FACS results in Fig. 4H, qNSCs stimulated with 50 μM NO produced better differentiation efficiency (50.0 ± 5.00%) than with other concentrations. No apparent change was observed in the NO concentration or morphology for qNSCs, even after qNSCs were stimulated by NO (70 μM) in the presence of cPTIO, while only 5.0 ± 0.50% (n = 5, S. D.) of qNSCs were observed to differentiate into neurons. The results were further confirmed by FACS analysis through using the NeuN protein as a characteristic marker for the identification of neurons (Fig. S27, ESI†). All these results strongly proved that qNSCs were effectively activated and differentiated into neurons by NO stimulation.
Two-photon fluorescence imaging and regulation of NO in the AD mouse brain
Benefiting from the good two-photon performance of the developed probe, the NOP was further used for biosensing of NO in brain tissues. As shown in Fig. 5A, the penetration depth of the developed NOP excited at 700 nm reached 350 μm, which was obviously deeper than that excited by one-photon excitation at 405 nm (∼150 μm). Then, the developed NO probe was used to evaluate the levels of NO in different regions of the AD (APP/PS1) and normal (C57BL/6) mouse brain, including the primary somatosensory cortex (S1BF), hippocampus CA1 (CA1), hippocampus DG (DG), caudate putamen (CPu), and laterodorsal thalamic nucleus (LD) (Fig. S28, ESI†). As shown by the results in Fig. 5B, the pseudocolor of the Fgreen/Fblue channel changed from orange to red in the regions of the S1BF, CA1, DG, CPu, and LD, demonstrating that the concentrations of NO in these brain regions of the AD mouse brain were higher than those in the normal mouse brain. According to the summarized data in Fig. 5C, the concentrations of NO in the areas of the S1BF and CA1 in the AD mouse brain were increased by 37.5 ± 0.300% and 36.0 ± 0.400%, higher than those in the CPu (27.1 ± 0.200%), LD (27.8 ± 0.300%) and DG (25.2 ± 0.400%), of the normal mouse brain. The higher concentration of NO in these brain regions of the AD mouse brain may arise from the high level of oxidative stress.35,36 Interestingly, the concentration of NO in the DG area of the AD mouse brain was only 12.0 ± 0.600 μM, which was obviously lower than that in the S1BF (37.0 ± 0.400 μM), CA1 (35.2 ± 0.200 μM), CPu (27.7 ± 0.500 μM) and LD (26.4 ± 0.300 μM). Since the concentration of NO in qNSCs was lower than that in neurons (Fig. S29, ESI†), and the amount of NSCs in the DG area was higher than that in other brain areas,37,38 the lower concentration of NO in the DG area may be ascribed to the higher number of NSCs in the DG area than in other regions of the AD mouse brain.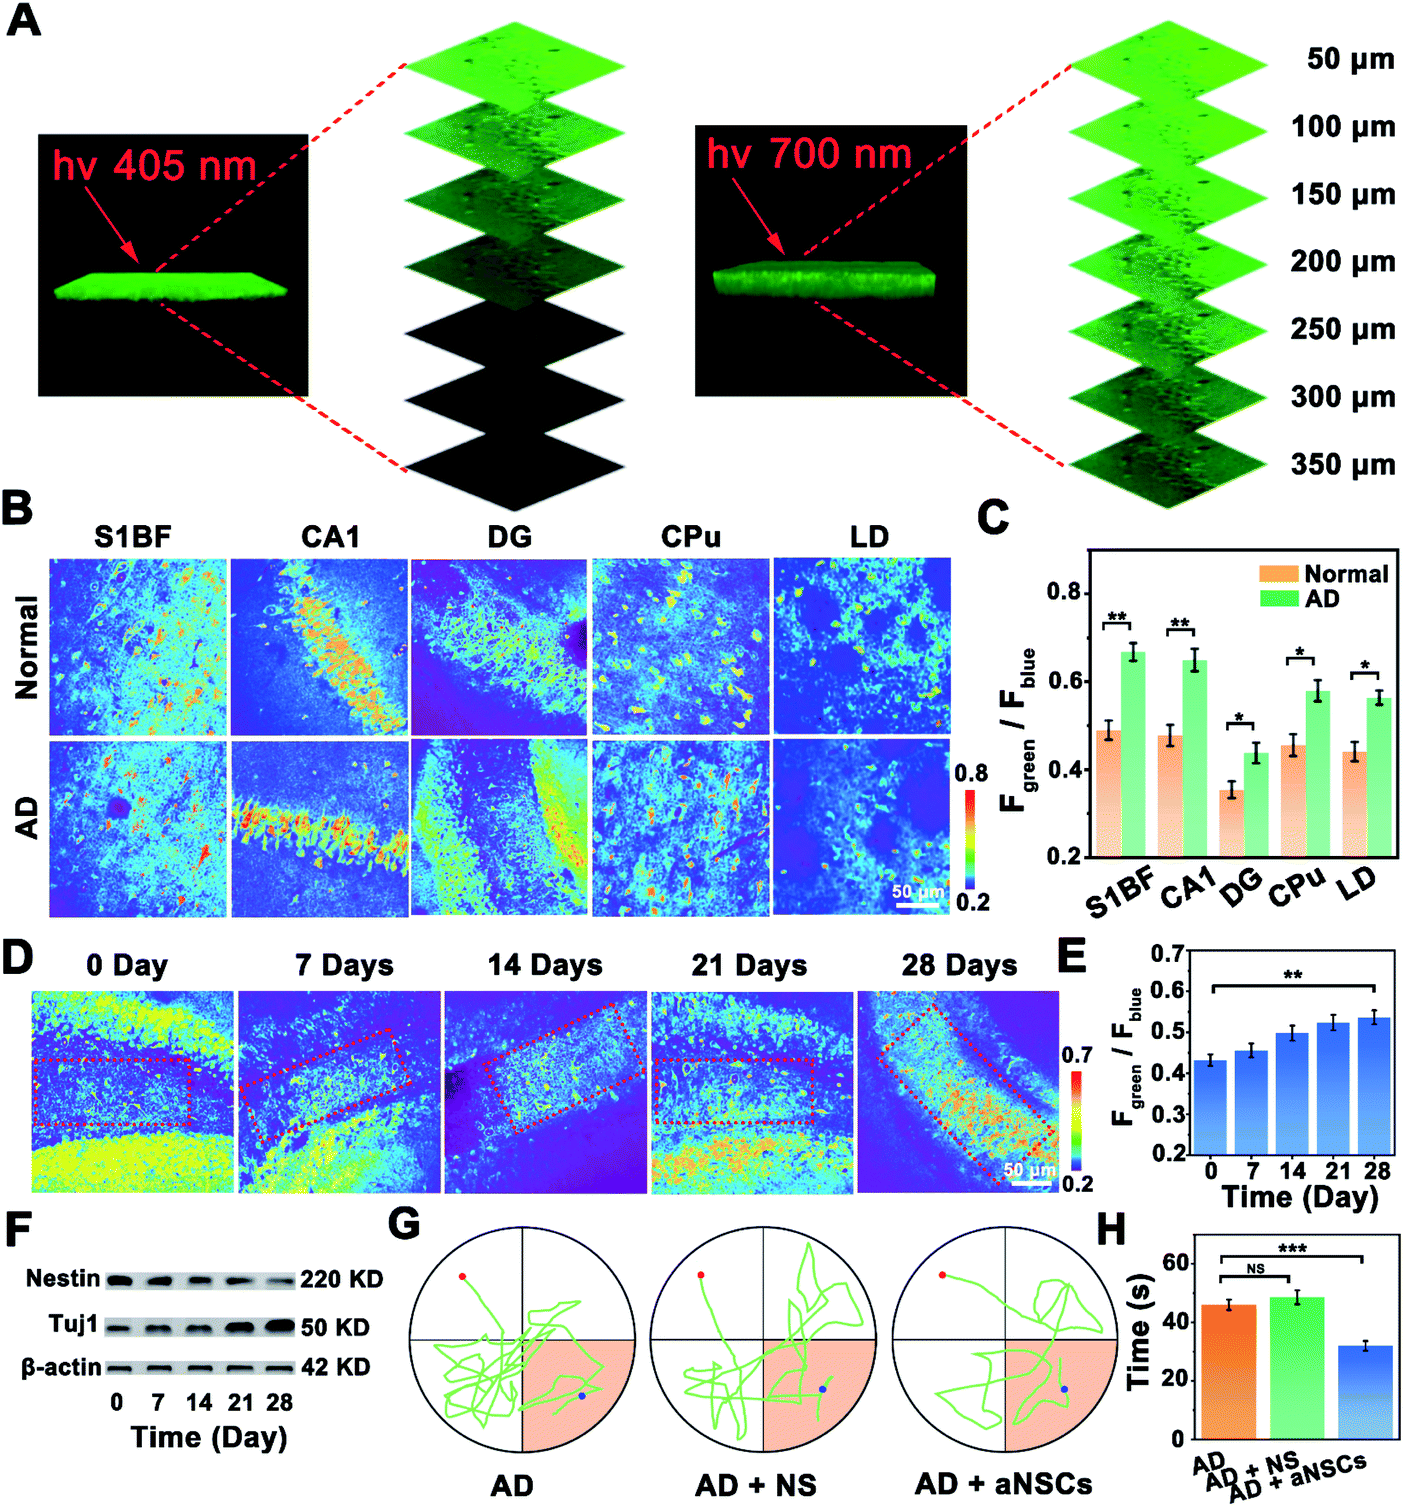 | ||
| Fig. 5 (A) One-photon and two-photon 3D images of the hippocampus in brain tissue labelled with the NO probe under the excitation at 405 nm and 700 nm, respectively. (B) Confocal fluorescence images of different brain regions obtained from normal and AD mice, respectively. (C) Summarized data for the Fgreen/Fblue value obtained from (B). (n = 20, S. D.) (D) Confocal fluorescence images of the DG area treated with aNSCs for different times (0, 7, 14, 21 and 28 days). (E) Summarized data for the Fgreen/Fblue value obtained from (D). (n = 20, S. D.) (F) Western blot of DG treated with aNSCs for different times (0, 7, 14, 21 and 28 days). (G) Trajectories of the untreated AD mouse and AD mouse treated with normal saline (NS) or aNSCs, respectively. (H) The time to arrive at the platform collected from the untreated AD mouse and AD mouse treated with NS or aNSCs. (n = 20, S. D.). | ||
Considering that neuron loss is the main feature of AD, increasing the number of neurons would help to improve the symptoms of AD.39,40 Then, aNSCs were obtained by activating qNSCs with 50 μM NO, which were further injected into the DG area of the AD mouse brain. As shown in Fig. 5D, the number of neurons in the DG area (boxed area) was increased apparently, while the level of NO in the DG area of the AD mouse brain was gradually increased to 23.6 ± 0.300 μM, after the AD mice were treated with aNSCs for 28 days (Fig. 5E). Interestingly, the changes were also observed around the injection area (outside the boxed area), which may have resulted from the migration and differentiation of aNSCs.41–43 In addition, as shown by the western-blot (WB) results in Fig. 5F, the concentration of nestin (characteristic protein of NSCs) in the DG area of the AD mouse brain was decreased by 40.0 ± 3.00% (n = 20, S. D.), while that of Tuj1 (characteristic protein of neurons) increased by 36.0 ± 3.00% (n = 20, S. D.). Moreover, the FACS results further confirmed that the amount of neurons in the DG area increased from 1.4 ± 0.30% (n = 5, S. D.) to 15.6 ± 3.00% (n = 5, S. D.), after aNSCs were injected into the DG area of the AD mouse brain for 28 days (Fig. S30, ESI†). All these results demonstrated that the aNSCs injected into the AD mouse brain were clearly differentiated into neurons. More importantly, behavioural experiments were further used to evaluate the symptomatic improvement of AD mice. Compared with the untreated AD mice, the water maze experiment showed that the trajectory analysis of the AD mice became directional (Fig. 5G), and the time to reach the platform was significantly shortened (Fig. 5H), after the AD mice were treated with aNSCs for 28 days. These results verified that the symptoms of AD mice were significantly improved through the treatment of NO-activated aNSCs in the DG region.
Conclusions
In summary, a FRET-PET based two-photon ratiometric fluorescent probe was rationally designed and developed, with two separated emissions under two-photon excitation at 700 nm, for real-time monitoring and accurate quantification of NO in living cells and deep brain tissues. The developed NOP exhibited high selectivity, good accuracy, and rapid dynamic response toward NO, which were successfully applied for real-time monitoring and accurate quantification of NO in NSCs during activation and differentiation, as well as in different brain regions with a thickness of up to 350 μm. It was found that NO plays a critical role in the activation and differentiation of qNSCs, and the differentiation efficiency of qNSCs into neurons induced by NO was dose-dependent. Moreover, based on the finding that the concentration of NO in the DG region was significantly lower than that in the S1BF, CA1, CPu and LD regions of the AD mouse brain, the symptoms of AD mice were significantly improved through the treatment of NO-activated NSCs. This work has successfully developed a reliable tool for real-time imaging and accurate quantification of NO, which has also provided a methodology to design and synthesize two-photon ratiometric probes for real-time monitoring and quantifying of biological molecules in living cells, tissues, and even brains. The investigation may also shed light on the development of AD treatment strategies through regulating the concentration of NO.Experimental section
Synthesis of the fluorescent NO probe
Compound 1: 2-nitro-p-phenylenediamine (1.5 g, 9.8 mmol) and 4-bromo-1,8-naphthalene anhydride (2.7 g, 9.8 mmol) were dissolved in 40 mL 2-methoxy ethanol. After the mixture was refluxed for 24 h, the mixture was further cooled and filtered, and then the precipitate was washed several times with ethanol to obtain brown compound 1 (yield: 85%).Compound 2: the mixture of ethylenediamine (1.5 g, 25.1 mmol) and compound 1 (0.50 g, 1.22 mmol) was first dissolved in 25 mL 2-methoxy ethanol. After the mixture was reacted at 125 °C for 4 h, it was poured into 150 mL of pre-prepared ice water and filtered to get the crude products. The crude products were washed with ethanol and were further purified by column chromatography (MeOH![[thin space (1/6-em)]](https://www.rsc.org/images/entities/char_2009.gif) :CH2Cl2 = 1:4) to get compound 2 (yield: 80%).
:CH2Cl2 = 1:4) to get compound 2 (yield: 80%).
Naphthalimide (NPM): compound 2 (0.25 g, 0.64 mmol) and the Pd/C catalyst (10% Pd) were dissolved in 15 mL DMF. Then, the solution was mixed with sodium hypophosphate solution (NaH2PO2) (8.49 M, 10 mL) at 55 °C in a nitrogen atmosphere. After the mixture was stirred for 10 hours at 95 °C, the mixture was poured into 150 mL of cold dichloromethane (CH2Cl2) and filtered to obtain the crude products. The crude products were washed with ethanol and were further purified by column chromatography to get NPM (yield: 77%).
Coumarin (CM): the mixture of 2,4-dihydroxybenzaldehyde (1.5 g, 13.7 mmol) and 2,2-dimethyl-1,3-dioxane-4,6-dione (3.0 g, 22.2 mmol) in 40 mL ultrapure water was heated to reflux and stirred for 9 hours. Then the mixture was filtered and extracted with methanol to obtain coumarin (CM) (yield: 88%).
NOP: NPM (0.25 g, 0.69 mmol), CM (0.60 g, 2.91 mmol), HBTU (1.0 g, 2.6 mmol) and triethylamine (0.6 mL) were dissolved in anhydrous dichloromethane (CH2Cl2, 20 mL). After stirring for 12 h at room temperature, the solvent was removed by rotary evaporation, and the crude products were further purified by column chromatography to get the NOP (yield: 55%).
Primary culture of mouse neural stem cells
All animal experiments were performed according to the guidelines of the Care and Use of Laboratory Animals formulated by the Ministry of Science and Technology of China and were approved by the Animal Care and Use Committee of East China Normal University, Shanghai, China (approval no. m+ R20190304). Quiescent neural stem cells (qNSCs) were obtained as previously reported.18 In brief, pregnant C57BL/6 mice (∼17 days) were anesthetized with halothane, and the brain of embryonic mice was obtained for separating qNSCs. Firstly, the brains were removed rapidly and immersed in ice-cold phosphate-buffered saline (PBS) (Ca2+- and Mg2+-free). Secondly, brain tissues were incubated with papain for 15 min at 37 °C, and separated with a fire-polished glass pipette. The qNSC suspension was plated in poly-D-lysine-coated 33 mm dishes with a density of 1 × 10⁶ cells per dish. Finally, qNSCs were cultured with the DMEM/F12 medium with B-27 and N-2 supplements and glucose in a humidified incubator (5% CO2, 37 °C). The cells were used for all the assays about 7 days later.Two-photon confocal fluorescence imaging
The neurobasal medium in the dishes was replaced by Hanks' balanced salt solution (HBSS) containing the NOP (10 μM) and incubated for 20 min. Thereafter, the qNSCs were washed twice with HBSS to remove the unabsorbed NOP. Then, different concentrations of NO (0, 10, 30, 50, and 100 μM) were incubated with qNSCs in HBSS before imaging. For comparison, 100 μM NO was also incubated with qNSCs in HBSS in the presence of 2-(4-carboxyphenyl)-4,4,5,5-tetramethyl-imidazoline-1-oxyl-3-oxide potassium (cPTIO) (150 μM).For real-time imaging of NO in qNSCs during activation, qNSCs were first incubated with 10 μM NOP for 20 min, then the qNSCs were washed twice with HBSS to remove the unabsorbed NOP. After that, confocal fluorescence imaging of NO in qNSCs was conducted under the stimulation of the epidermal growth factor (EGF) and basic fibroblast growth factor (bFGF) in the absence and in the presence of cPTIO (150 μM).
For imaging of NO in qNSC after differentiation, qNSCs were first stimulated using different concentrations of NO (0, 10, 30, 50, and 70 μM) for 5 min. For comparison, qNSCs were also stimulated using 70 μM NO in the presence of cPTIO (150 μM). Then, the cell culture medium was replaced with the DMEM/F12 medium with B-27 and N-2 supplements and glucose and further cultured for 24 h. Subsequently, qNSCs were incubated with 10 μM NOP for 20 min, and then washed twice with HBSS to remove the unabsorbed NOP. After that, confocal fluorescence imaging was conducted under the excitation at 700 nm.
Preparation and confocal imaging of brain tissue slices
All fresh brain tissue slices were prepared according to the methods previously reported. Firstly, the AD mice (APP/PS1) or normal mice (C57BL/6) were anesthetized with halothane and the brains were quickly separated. Then, the fresh brain tissues with a thickness of about 300 μm were obtained on a Leica VT3000 vibrating blade microtome (Germany). All operations were performed on ice-cold artificial cerebrospinal fluid (aCSF) containing KCl (3.0 mM), NaCl (124.0 mM), CaCl2 (0.1 mM), MgSO4 (8.0 mM), NaH2PO4 (1.24 mM), NaHCO3 (26.0 mM) and D-glucose (10.0 mM), with an atmosphere containing 95% O2 and 5% CO2. Secondly, the brain tissues were incubated with 10 μM NOP in aCSF for 1 h at 37 °C, with a continuous supplement of 95% O2 and 5% CO2. The treated brain tissues were washed three times with aCSF to remove the unabsorbed NOP. Finally, the confocal imaging of the stained brain tissue slices was obtained under the excitation at 700 nm.The treatment and behavioural assessment of AD mice
qNSCs were first activated using 50 μM NO, and the obtained activated NSCs (aNSCs) (∼105 cells) were injected into the DG area (AP = −1.30 mm, L = 1.54 mm anterior to the bregma, and V = 2.3 mm from the surface of the skull) of the AD mouse brain. The aNSC treated AD mice were kept in a normal environment at room temperature, with a normal supply of drinking water and feed. For comparison, normal saline (NS) treated AD mice and untreated AD mice were kept under the same conditions. Then, brain tissues were obtained according to the above method on 0, 7, 14, 21, and 28 days, respectively, and the concentration changes of NO in AD mouse brain were estimated.On the other hand, after the AD mice were treated for 28 days, the spatial learning and memory ability of the AD mice were tested by using a Morris water maze with a diameter of 1.5 meters. The tank of the Morris water maze was evenly divided into four quadrants. The movement trajectory and the time taken to reach the platform by the mice were captured by using a high-definition camera located directly above the tank. The obtained data were analyzed by using SuperMaze software. All mice were trained to reach the platform from the same starting point in the Morris water maze for 5 days (4 times a day, 60 seconds at a time) before the start of treatment experiments.
Data availability
The data supporting the findings of this study are available within the article and in the ESI.†Author contributions
Z. C. Liu and Y. Tian designed the experiments, wrote the manuscript, and were responsible for the whole work. M. Y. Liang performed the experiments and wrote the manuscript. Z. H. Zhang helped with cell culture. Y. X. Mei helped with molecular synthesis. All the authors discussed the results and commented on the manuscript.Conflicts of interest
There are no conflicts to declare.Acknowledgements
This work was supported by the National Natural Science Foundation of China (22004037, 21635003, 21827814 and 21811540027) and the Innovation Program of Shanghai Municipal Education Commission (201701070005E00020). The authors also thank the Materials Characterization Center of East China Normal University for help with fluorescence imaging.Notes and references
- J. R. Tejedo, R. Tapia-Limonchi, S. Mora-Castilla, G. M. Cahuana, A. Hmadcha, F. Martin, F. J. Bedoya and B. Soria, Cell Death Dis., 2010, 1, e80 CrossRef CAS PubMed.
- B. P. Carreira, M. I. Morte, A. Inacio, G. Costa, J. Rosmaninho-Salgado, F. Agasse, A. Carmo, P. Couceiro, P. Brundin, A. F. Ambrosio, C. M. Carvalho and I. M. Araujo, Stem Cells, 2010, 28, 1219–1230 CrossRef CAS PubMed.
- P. Pacher, J. S. Beckman and L. Liaudet, Physiol. Rev., 2007, 87, 315–424 CrossRef CAS PubMed.
- N. Peunova and G. Enuikolopov, Nature, 1995, 375, 68–73 CrossRef CAS PubMed.
- G. T. Liberatore, V. Jackson-Lewis and S. Vukosavic, Nat. Med., 1999, 5, 1403–1409 CrossRef CAS PubMed.
- N. Asiimwe, S. G. Yeo, M. S. Kim, J. Jung and N. Y. Jeong, Oxid. Med. Cell. Longevity, 2016, 2016, 7205747 Search PubMed.
- C. Farah, L. Y. M. Michel and J. L. Balligand, Nat. Rev. Cardiol., 2018, 15, 292–316 CrossRef CAS PubMed.
- Y. Chen, P. Gao, L. Huang, X. Tan, N. Zhou, T. Yang, H. Qiu, X. Dai, S. Michael, Q. Tu, N. Huang, Z. Guo, J. Zhou, Z. Yang and H. Wu, Nat. Commun., 2021, 12, 7079–7093 CrossRef CAS PubMed.
- Z. B. Qu, X. Zhou, M. Zhang, J. Shen, Q. Li, F. Xu, N. Kotov and C. Fan, Adv. Mater., 2021, 33, e2007900 CrossRef PubMed.
- Z. Mao, W. Feng, Z. Li, L. Zeng, W. Lv and Z. Liu, Chem. Sci., 2016, 7, 5230–5235 RSC.
- Y. Li, W. Wu, J. Yang, L. Yuan, C. Liu, J. Zheng and R. Yang, Chem. Sci., 2016, 7, 1920–1925 RSC.
- H. Yu, Y. Xiao and L. Jin, J. Am. Chem. Soc., 2012, 134, 17486–17489 CrossRef CAS PubMed.
- P. Gao, W. Pan, N. Li and B. Tang, Chem. Sci., 2019, 10, 6035–6071 RSC.
- Z. Yu, W. Pan, N. Li and B. Tang, Chem. Sci., 2016, 7, 4237–4244 RSC.
- W. Zhang, J. Zhang, P. Li, J. Liu, D. Su and B. Tang, Chem. Sci., 2019, 10, 879–883 RSC.
- J. Zhou and H. Ma, Chem. Sci., 2016, 7, 6309–6315 RSC.
- Z. Liu, H. Pei, L. Zhang and Y. Tian, ACS Nano, 2018, 12, 12357–12368 CrossRef CAS PubMed.
- Z. Zhang, Z. Liu and Y. Tian, iScience, 2020, 23, 101344 CrossRef CAS PubMed.
- W. Wang, F. Zhao, M. Li, C. Zhang, Y. Shao and Y. Tian, Angew. Chem., Int. Ed., 2019, 58, 5256–5260 CrossRef CAS PubMed.
- H. Dong, Q. Zhou, L. Zhang and Y. Tian, Angew. Chem., Int. Ed., 2019, 58, 13948–13953 CrossRef CAS PubMed.
- Y. Liu, Z. Liu, F. Zhao and Y. Tian, Angew. Chem., Int. Ed., 2021, 60, 14429–14437 CrossRef CAS PubMed.
- Z. Wu, M. Liu, Z. Liu and Y. Tian, J. Am. Chem. Soc., 2020, 142, 7532–7541 CrossRef CAS PubMed.
- L. Ge, Z. Liu and Y. Tian, Chem. Sci., 2020, 11, 2215–2224 RSC.
- J. Liu, Z. Liu, W. Wang and Y. Tian, Angew. Chem., Int. Ed., 2021, 60, 21351–21359 CrossRef CAS PubMed.
- Z. Liu, Z. Zhang, Y. Liu, Y. Mei, E. Feng, Y. Liu, T. Zheng, J. Chen, S. Zhang and Y. Tian, Angew. Chem., Int. Ed., 2022, 61, e202111630 CAS.
- C. Yu, Y. Wu, F. Zeng and S. Wu, J. Mater. Chem. B, 2013, 1, 4152–4159 RSC.
- Q. Han, J. Liu, Q. Meng, Y. L. Wang, H. Feng, Z. Zhang, Z. P. Xu and R. Zhang, ACS Sens., 2019, 4, 309–316 CrossRef CAS PubMed.
- S. J. Li, D. Y. Zhou, Y. Li, H. W. Liu, P. Wu, J. Ou-Yang, W. L. Jiang and C. Y. Li, ACS Sens., 2018, 3, 2311–2319 CrossRef CAS PubMed.
- H. He, Z. Ye, Y. Xiao, W. Yang, X. Qian and Y. Yang, Anal. Chem., 2018, 90, 2164–2169 CrossRef CAS PubMed.
- W. Hu, M. Xie, H. Zhao, Y. Tang, S. Yao, T. He, C. Ye, Q. Wang, X. Lu, W. Huang and Q. Fan, Chem. Sci., 2018, 9, 999–1005 RSC.
- Z. Mao, H. Jiang, X. Song, W. Hu and Z. Liu, Anal. Chem., 2017, 89, 9620–9624 CrossRef CAS PubMed.
- O. Basak, C. Giachino, E. Fiorini, H. R. Macdonald and V. Taylor, J. Neurosci., 2012, 32, 5654–5666 CrossRef CAS PubMed.
- T. H. Cheung and T. A. Rando, Nat. Rev. Mol. Cell Biol., 2013, 14, 329–340 CrossRef CAS.
- P. Codega, V. Silva-Vargas, A. Paul, A. R. Maldonado-Soto, A. M. Deleo, E. Pastrana and F. Doetsch, Neuron, 2014, 82, 545–559 CrossRef CAS PubMed.
- D. A. Butterfield and B. Halliwell, Nat. Rev. Neurosci., 2019, 20, 148–160 CrossRef CAS PubMed.
- C. Cheignon, M. Tomas, D. Bonnefont-Rousselot, P. Faller, C. Hureau and F. Collin, Redox Biol., 2018, 14, 450–464 CrossRef CAS PubMed.
- A. Fontan-Lozano, S. Morcuende, M. A. Davis-Lopez de Carrizosa, B. Benitez-Temino, R. Mejias and E. R. Matarredona, Front. Oncol., 2020, 10, 602217 CrossRef.
- F. H. Gage, Science, 2000, 287, 1433–1438 CrossRef CAS PubMed.
- T. Arendt, M. K. Bruckner, B. Mosch and A. Losche, Am. J. Pathol., 2010, 177, 15–20 CrossRef PubMed.
- C. Stadelmann, T. L. Deckwerth, A. Srinivasan, C. Bancher, W. Brück, K. Jellinger and H. Lassmann, Am. J. Pathol., 1999, 155, 1459–1466 CrossRef CAS.
- S. Yun, T. Shin, J. Lee, M. Cho, I. Kim, J. Kim and K. Jung, Nano Lett., 2018, 18, 838–845 CrossRef CAS PubMed.
- L. Danielyan, et al. , EBioMedicine, 2020, 60, 102989 CrossRef PubMed.
- X. Liu, L. Yang and L. Zhao, World J. Stem Cells, 2020, 12, 787–802 CrossRef PubMed.
Footnote |
| † Electronic supplementary information (ESI) available: NMR spectra and MS spectra; selectivity and competition tests of NOP; cytotoxicity and apoptosis assay; long-term co-localization experimental; the MTT test of NO toward NSCs and histology aligned to the Allen Brain Atlas. See DOI: 10.1039/d2sc00326k |
| This journal is © The Royal Society of Chemistry 2022 |