
 Open Access Article
 This Open Access Article is licensed under a Creative Commons Attribution-Non Commercial 3.0 Unported Licence
Vibronic effects accelerate the intersystem crossing processes of the through-space charge transfer states in the triptycene bridged acridine–triazine donor–acceptor molecule TpAT-tFFO†
Jeremy M.
Kaminski
 a,
Angela
Rodríguez-Serrano
a,
Fabian
Dinkelbach
a,
Hector
Miranda-Salinas
b,
Andrew P.
Monkman
b and
Christel M.
Marian
*a
a,
Angela
Rodríguez-Serrano
a,
Fabian
Dinkelbach
a,
Hector
Miranda-Salinas
b,
Andrew P.
Monkman
b and
Christel M.
Marian
*a
aInstitute of Theoretical and Computational Chemistry, Heinrich-Heine-University Düsseldorf, D-40204 Düsseldorf, Germany. E-mail: christel.marian@hhu.de
bDept of Physics, OEM Research Group, Durham University, Durham, DH1 3LE, UK. E-mail: a.p.monkman@durham.ac.uk
First published on 20th May 2022
Abstract
Quantum chemical studies employing combined density functional and multireference configuration interaction methods suggest five excited electronic states to be involved in the prompt and delayed fluorescence emission of TpAT-tFFO. Three of them, a pair of singlet and triplet charge transfer (CT) states (S1 and T1) and a locally excited (LE) triplet state (T3), can be associated with the (Me → N) conformer, the other two CT-type states (S2 and T2) form the lowest excited singlet and triplet states of the (Me → Ph) conformer. The two conformers, which differ in essence by the shearing angle of the face-to-face aligned donor and acceptor moieties, are easily interconverted in the electronic ground state whereas the reorganization energy is substantial in the excited singlet state, thus explaining the two experimentally observed time constants of prompt fluorescence emission. Forward and reverse intersystem crossing between the singlet and triplet CT states is mediated by vibronic spin–orbit interactions involving the LE T3 state. Low-frequency vibrational modes altering the distance and alignment of the donor and acceptor π-systems tune the S1 and T3 states (likewise S2 and T3) into and out of resonance. The enhancement of intersystem crossing due to the interplay of vibronic and spin–orbit coupling is considered a general feature of organic through-space charge-transfer thermally activated delayed fluorescence emitters.
1 Introduction
Recently, Kaji and co-workers1 presented combined experimental and theoretical studies of TpAT-tFFO, a thermally activated delayed fluorescence (TADF) emitter constituted by 9,9-dimethyl-9,10-dihydroacridine as a donor (A), 2,4-diphenyl-1,3,5-triazine as an acceptor (T) and triptycene (Tp) as a bridge connecting the subunits A and T in a tilted face-to-face (tFF) configuration with optimal (O) distance (Fig. 1).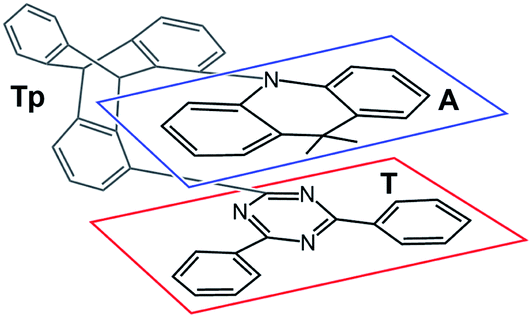 | ||
| Fig. 1 Chemical structure TpAT-tFFO with its donor (A, blue box), acceptor (T, red box), and linker (Tp, unframed) subunits. | ||
A key feature of a TADF emitter is an efficient reverse intersystem crossing (rISC) from the triplet manifold to the first excited singlet state by which triplet as well as singlet excitons can be harvested in an organic light-emitting diode (OLED). In principle, therefore internal quantum efficiencies of up to 100% can be reached in a TADF OLED. Because of the through-space configuration of the donor and acceptor moieties in TpAT-tFFO (dDA = 4.72 Å), the spatial overlap between HOMO and LUMO is very small which in turn leads to a minuscule energy separation between the lowest excited singlet and triplet states. While a small singlet–triplet energy gap (ΔEST < 0.1 eV) is favorable for thermally activated processes such as rISC, the negligible spatial overlap of the hole and particle densities results in a moderate S1 → S0 transition dipole moment in accordance with the comparably low fluorescence rate constant of kF = 1.1 × 10⁶ s−1 deduced from experiment.1 With ISC and rISC rate constants of kISC = 5.2 × 10⁷ s−1 and krISC = 1.2 × 10⁷ s−1, respectively, at room temperature (RT) in doped film, the ISC and rISC processes are an order of magnitude faster than prompt fluorescence in this molecule, i.e., the excited singlet and triplet populations can largely equilibrate before emitting delayed fluorescence with a radiative lifetime of 4.1 μs.1
Newer time-resolved measurements in various solvents and host matrices by Monkman and coworkers, described in detail in a forthcoming publication,2 suggest the excitation decay kinetics to be even more involved. Two components for the decay of prompt fluorescence with different time constants but essentially identical emission wavelengths are observed followed by delayed fluorescence in degassed solution at RT (Fig. 2). In mCBP host, in addition strong long-lived phosphorescence emission is seen at 20 K. While the absolute S1 and T1 energies change from host to host, their energy separation ΔEST stays surprisingly constant at about 0.016 ± 0.002 eV.2 These intriguing experimental observations call for a detailed quantum chemical study of the TpAT-tFFO donor–acceptor complex that can shed light on its excited-state decay processes.
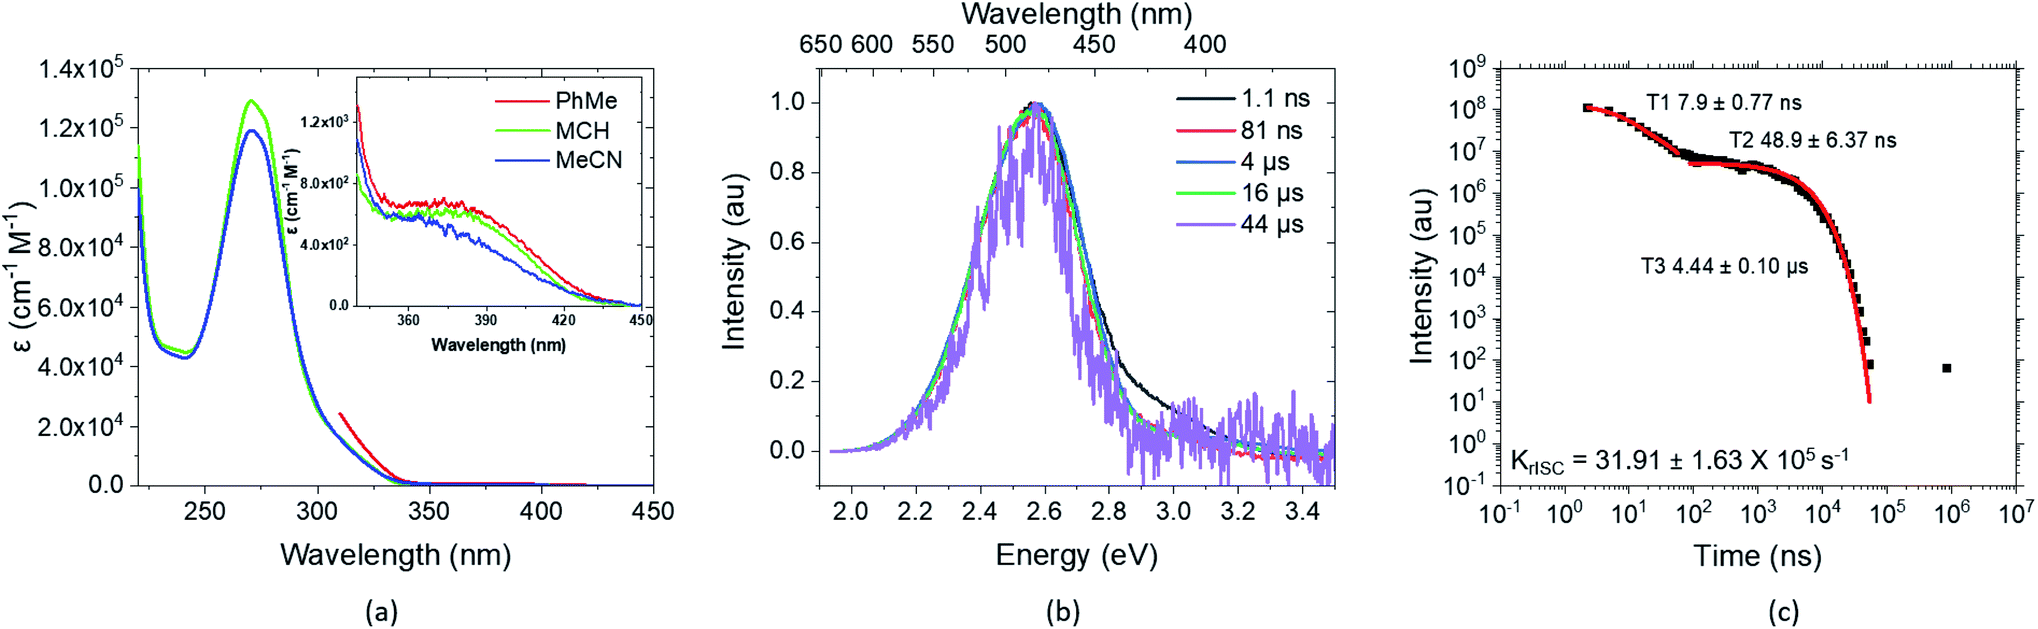 | ||
| Fig. 2 Experimental key results on the photophysics of TpAT-tFFO, presented in detail in ref. 2. (a) Extinction coefficients in different solvents and close-up of the direct CT absorption band in the inset, (b) time-resolved spectral frames of the PhMe degassed solution at different times and (c) decay, lifetimes and krISC of the same PhMe solution (all solution concentrations are 20 μM L−1). | ||
Because ISC and rISC between singlet and triplet charge-transfer (CT) states of equal electronic structure are orbitally forbidden, spin–vibronic coupling with a nearby locally excited (LE) triplet state has been argued to be essential for enhancing the radiationless 1CT ↭ 3CT transitions in both, through-bond and through-space donor–acceptor complexes.1,3–12 Quantum chemical calculations on TpAT-tFFO in the framework of time-dependent density functional theory (TDDFT)1 suggest the presence of a 3LE state on the T acceptor in close energetic proximity of the lowest-lying 1CT and 3CT states. The results of this study further indicate that a tilted face-to-face (tFF) alignment of A and T gives rise to stronger spin–orbit coupling (SOC) between 1CT and 3LE (0.61 cm−1) than the parallel face-to-face (pFF) alignment (0.05 cm−1) of the donor and acceptor moieties while the SOC between 1CT and 3CT vanishes (0.00 cm−1) in both conformations. Therefore, spin–vibronic effects are expected to play an essential role in the ISC and rISC transitions of this TADF emitter. This three-state model can, however, not explain the bi-exponential decay of the prompt fluorescence observed in the newer time-resolved experiments by the Monkman group.2 To elucidate the mechanisms underlying the considerably fast ISC and rISC of TpAT-tFFO found in experiment, we have characterized the electronic structures of its low-lying singlet and triplet states in the framework of density functional theory (DFT) and multi-reference configuration interaction (MRCI) methods and explored their interactions by means of associated spin–orbit coupling and property programs. The chosen computational protocol has proven to yield energies and rate constants that are sufficiently accurate to provide valuable insights into the kinetics of competitive radiative and nonradiative decay processes.13–17
2 Computational methods
Electronic ground-state geometries of the TpAT-tFFO emitter were optimized using the Turbomole program package18 and DFT at the PBE0-D3(BJ)/def2-SV(P) level of theory19,20 including Grimme's dispersion correction (D3) together with Becke and Johnson (BJ) damping.21,22 Time-dependent DFT (TDDFT) was used for the optimization of the excited singlet states23–26 while the Tamm–Dancoff approximation (TDA) was utilized for the optimization of the excited triplet states.27 Analytic harmonic vibrational frequencies were computed by means of Gaussian16.28Vertical and adiabatic excitation energies and optical electronic properties were calculated using the DFT/MRCI method.29–31 Up to 25 roots at the respective ground-state geometries and 10 roots at the excited-state geometries were determined for each singlet and triplet manifold in DFT/MRCI employing closed-shell BH-LYP32,33 orbitals as the one-particle basis. The parametrization of the Hamiltonian reported in Lyskov et al.34 for the tight configuration selection threshold of 0.8Eh was employed (DFT/MRCI-R2016), which is specially designed for large multichromophoric systems. Fragment-based analyses of the singlet and triplet DFT/MRCI wavefunctions were performed by an extended version of the TheoDORE tool box.17,35 Mutual spin–orbit coupling matrix elements (SOCMEs) between target singlet and triplet states were calculated with the spin–orbit coupling kit (SPOCK) developed in our group.36–38 Here, the SOC is described by using the Breit–Pauli Hamiltonian and the atomic spin–orbit mean-field approximation.39,40 Rate constants for ISC and rISC between excited singlet and triplet states were determined in the framework of Fermi's golden rule approximation and a time-dependent Fourier transform approach as implemented in the VIBES program.41,42 Temperature effects were accounted to the rate constants by assuming a Boltzmann distribution in the initial electronic state. In the Franck–Condon (FC) approximation, the rate constant for the Sa ↝ Tb ISC at a given temperature T is computed as the sum of squared electronic SOCMEs between the initial singlet state Sa at its minimum geometry Q0 and the three triplet sublevels Tbα, multiplied by the Boltzmann and FC weighted density of vibrational states according to41
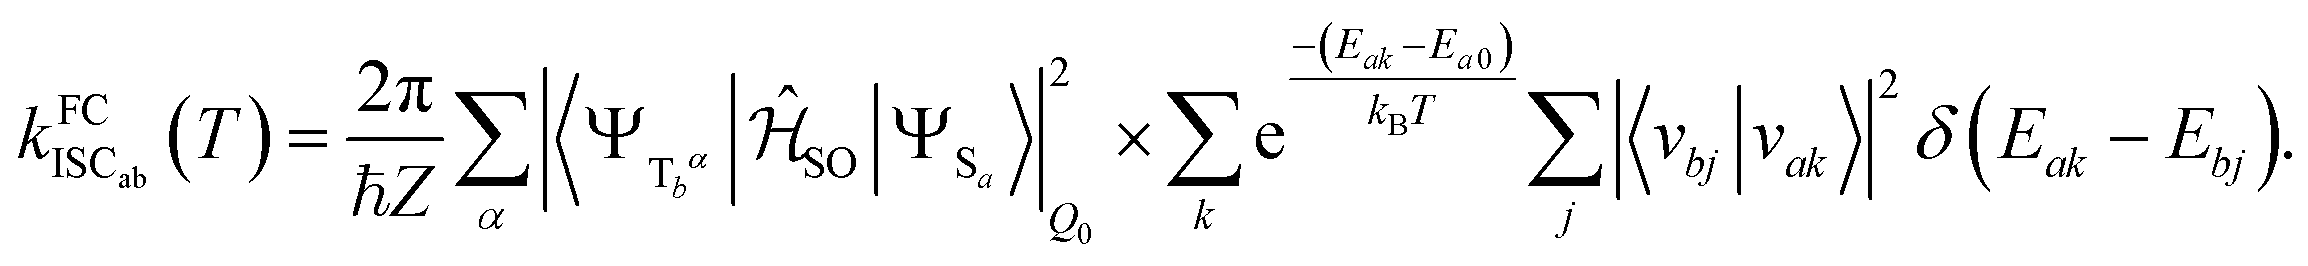 | (1) |
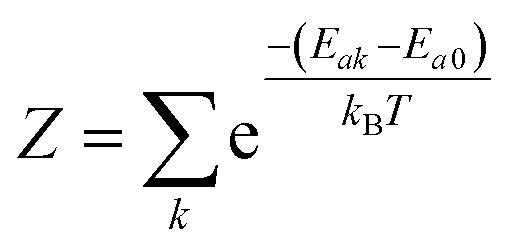 the partition function of the initial state. In the Herzberg–Teller (HT) approximation, the SOC is expanded as a function of the normal coordinates Q of the initial state about Q0 and the expansion is terminated after the linear term.8,43,44
 | (2) |
Squaring this expression yields a pure FC term, a mixed FC/HT term and a HT/HT term. Similar formulas result for the reverse Sa ↜ Tb process. The SOCME gradients in eqn (2) were determined by averaged two-point finite difference techniques. To this end, the nuclear framework was deflected from the respective minimum geometry in positive and negative directions of the dimensionless vibrational normal modes utilizing a step size of 0.1 units. Phase corrections were applied as described in earlier work.17
To check whether vibronic effects accelerate fluorescence as well, electric dipole transition moments and their numerical derivatives were employed to compute fluorescence in FC and HT approximation. Because the HT spectra are not properly normalized in the VIBES program, we made use of the closure relation for FC factors to normalize the HT spectrum and to determine fluorescence rate constants according to
 | (3) |
3 Computational results
3.1 Ground state
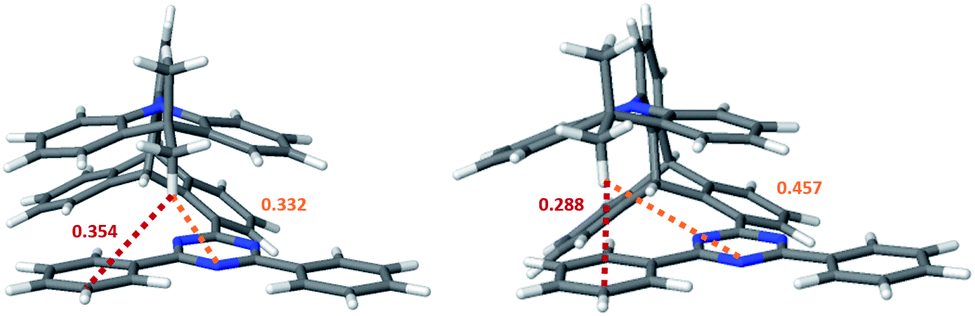 | ||
| Fig. 3 Nuclear arrangements at the two ground state minima of TpAT-tFFO optimized at PBE0-D3(BJ)/def2-SV(P) level of theory (left: S0(Me → N); right: S0(Me → Ph)). Distances between the proximal methyl hydrogen atom of the A donor and the triazine (orange) or phenyl (red) rings of the T acceptor are given in nm. | ||
 | ||
| Fig. 4 Vertical absorption spectra at the two ground state minima of TpAT-tFFO at the DFT/MRCI-R2016 level of theory in vacuo (red: S0(Me → N), blue: S0(Me → Ph)). The experimental UV-vis absorption spectrum of TpAT-tFFO (green) was recorded in MCH solution at RT. For details. See ref. 2. | ||
The shapes and positions of the experimental bands appear to be rather insensitive with respect to the solvent polarity as seen when comparing the spectral signatures of TpAT-tFFO in methyl cyclohexane (MCH), toluene (PhMe) and acetonitrile (MeCN) solution.1,2 The absorption spectrum recorded in toluene breaks off at about 300 nm where the solvent starts to absorb. At longer wavelength it is very similar to the spectra in other solvent environments. Similar observations were made for the quantum chemical modeling of the absorption. Test calculations on TpAT-tFFO in toluene solution led to nearly identical results as in vacuo, so that solvent effects have been neglected in the following. Note, however, the strong solvent-dependent Stokes shifts of the experimental emission wavelengths,2 typical for CT transitions in liquid solution where the solvent shell can reorganize and adapt to the altered polarity of the solute in the excited state. In more rigid environments, where this reorganization is hindered at the time scale of the experiment, the experimental onset energies exhibit a much smaller variation.
3.2 Excited states
The optimization of the first two excited singlet states (S1 and S2, both CT states) and the first three excited triplet states (T1 and T2: CT states, T3: LE state) yielded the desired minima on the potential energy surface (PES). Note, however, that the energetic order of the states may vary from geometry to geometry. To avoid confusion, we have kept the state designations used in the FC region of the (Me → N) conformer. For example, the locally excited triplet state is the third triplet state at the ground-state geometry. Hence, the 3LE state is named T3 and it retains this name irrespective of the energetic order at other geometries. Difference densities visualizing the characters of the electronic states at their respective minimum geometries are displayed in Fig. 5.
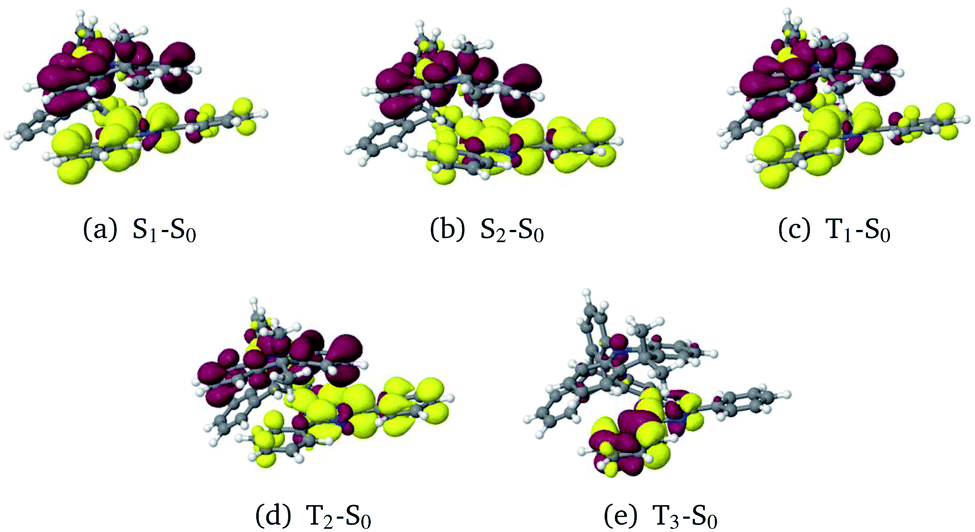 | ||
| Fig. 5 Difference densities (±0.001) of the excited states at their optimized geometries. Areas losing electron density in comparison to the electronic ground state are shown in red, areas gaining electron density in yellow. | ||
In general, the geometry relaxation in the excited states leads to mild changes in the tilted alignment between A and T (up to 3.0°). In detail, some dihedral angles between the triazine molecular plane and the benzene moieties of A change. Furthermore, a distortion of the triazine moiety itself resulting from bond length alterations with respect to the electronic ground states can be made out in all excited state structures. To provide an overview over the particular displacements of the minimum geometries, we constructed overlays of the ground and excited state structures such that their Tp bridges exhibit minimal root mean square deviations (Fig. 6). With regard to their minimum nuclear arrangements, the electronic states can be grouped into two clusters: S0(Me → N), S1(CT), T1(CT) and T3(LE) exhibit similar relative orientations of the A and T subunits whereas S2(CT′) and T2(CT′) more closely resemble the S0(Me → Ph) conformer.
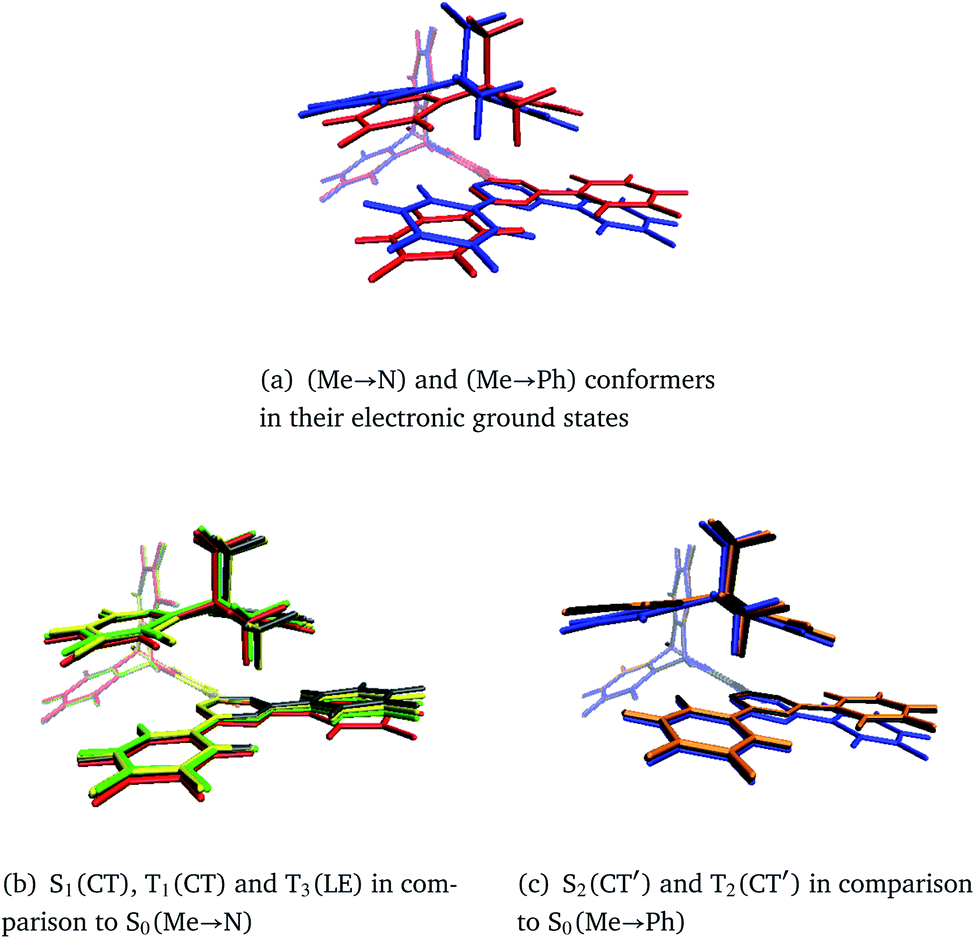 | ||
| Fig. 6 Overlays of TpAT-tFFO molecular frames visualizing the coordinate displacements of the respective minimum nuclear arrangements while minimizing the root mean squares deviations of the Tp bridges. The following color codes have been used: red: S0(Me → N), blue: S0(Me → Ph), gray: S1(CT), yellow: T1(CT), green: T3(LE), orange: S2(CT′), black: T2(CT′). Details of the electronic structure data can be found in Tables S1–S8 and Fig. S3–S26.† | ||
Surprisingly, the energies of the S1(CT) and S2(CT′) states are nearly degenerate after structural relaxation to their respective minima on the PES (Table 1). In contrast, they are separated vertically by more than 0.5 eV (Fig. S27†). In terms of a Marcus-type model, a substantial reorganization energy has to be overcome for a transition between their potential energy wells. A similar picture is obtained for the corresponding excited T1(CT) and T2(CT′) states. On an absolute scale, the calculated adiabatic 1CT and 3CT energies are in good agreement with experimental on-set energies of the singlet and triplet transitions in various host matrices (Table 1). Note, however, that the calculated adiabatic ΔEST values of 0.09 eV (S1–T1) and 0.15 eV (S2–T2) are significantly larger than the singlet–triplet energy gaps derived experimentally (0.016 ± 0.002 eV) on the basis of temperature-dependent measurements in the solid state.
| State | ΔE00 | ZPVE | Experimental on-sets2 | ||
|---|---|---|---|---|---|
| S1 | CT | 2.97 | −0.11 |

|
2.853 (UGH-3), 2.818 (mCBP), 2.893 (CzSi), 2.943 (zeonex) |
| S2 | CT′ | 2.98 | −0.12 | ||
| T1 | CT | 2.88 | −0.11 |

|
2.839 (UGH-3), 2.800 (mCBP), 2.877 (CzSi), 2.930 (zeonex) |
| T2 | CT′ | 2.83 | −0.12 | ||
| T3 | LE | 2.99 | +0.04 | ||
The potential energy scheme in Fig. S27† implies the existence of conical intersections between the CT and CT′ states which have been located at energies approximately 0.15 eV above the respective minima. Optimization of the T3(LE) energy brings this state adiabatically into near degeneracy with the excited singlet states (0.01 eV above). Due to the closer geometric resemblance of the S1 and T3 structures, their reorganization energy is much smaller than for the S2 and T3 pair of states. While being in qualitative agreement with the scheme proposed by Kaji and co-workers on the basis of their experimental and theoretical data, the results of our computational study paint a more intricate picture of the excited-state processes in TpAT-tFFO.
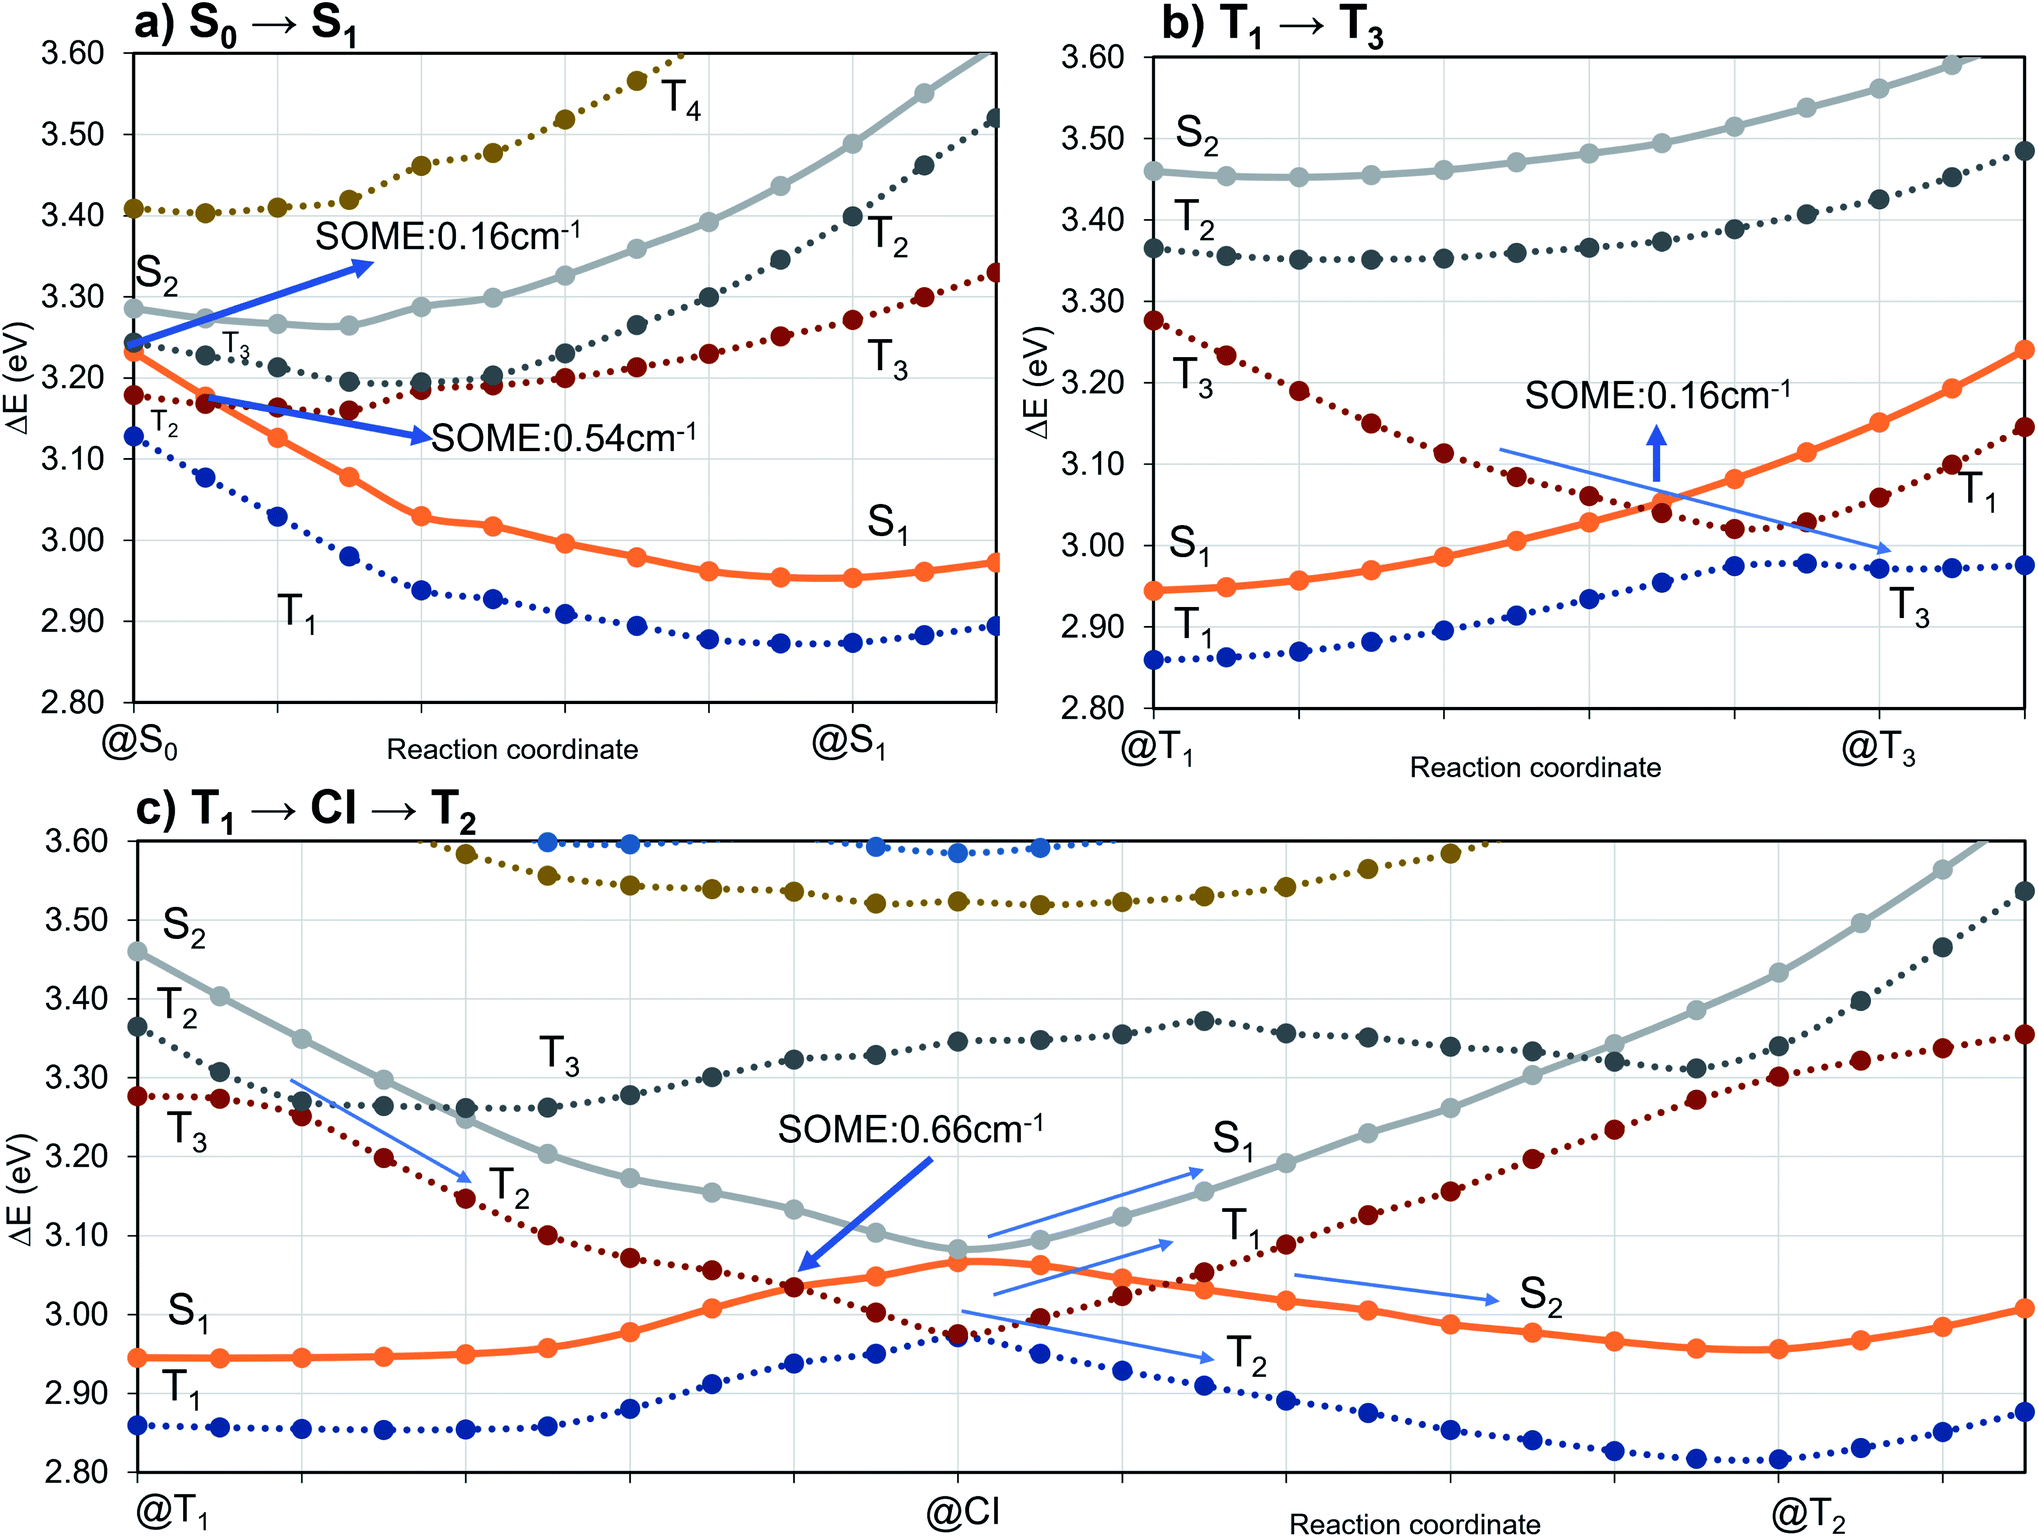 | ||
| Fig. 7 DFT/MRCI energy profiles along linear interpolated pathways (LIPs) between target electronic state minima. Dashed lines correspond to triplet state PESs while solid lines correspond to singlet states. | ||
To investigate the importance of the tilted face-to-face alignment of the donor and acceptor units for the photophysics of TpAT-tFFO, the molecular frame was deflected along selected vibrational modes of the Me → N conformer, namely vibrational mode 1 (Fig. S1†), which transforms the two ground state conformers into one another, and the vibrational modes 9 and 12 (Fig. 8), which are low-frequency modes that move the donor–acceptor π-systems closer to or further away from one another. Even small distortions along these modes are sufficient to reach a crossing between S1(CT) and T3(LE) (Fig. S2, S29 and S30†) while the ground-state energy increases only slightly. Additionally, these vibrational motions have large impact on the oscillator strengths of the S1 ← S0 and S2 ← S0 processes. We therefore expect dynamic processes beyond the FC approximation to play an important role.
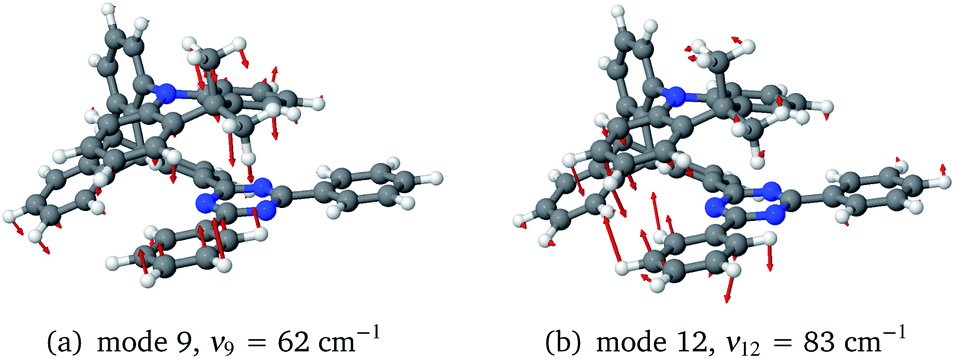 | ||
| Fig. 8 Low-frequency ground-state vibrational modes of the (Me → N) conformer moving the donor–acceptor π-systems closer to one another (positive deflection) or further away (negative deflection). | ||
The peak positions of the experimental fluorescence spectra in liquid solution at RT are seen to vary substantially for different solvents (Fig. 9). The strong Stokes shift of the emission in MeCN in comparison to MCH solution is caused, for example, by the electrostatic interactions of the very polar CT state of the solute and the reorganized polar solvent environment. The fact that even the spectrum in toluene is red shifted is mostly attributed to π-stacking interactions between the solute and the solvent. Both, solvent reorganization and π-stacking effects are not included in our computational model. It is therefore not surprising that the peak positions of the computed S1 → S0 and S2 → S0 transitions do not agree well with the measured peak maxima in liquid solution (Fig. 9). The fact that the computed spectra show more pronounced tails in the long wavelength region than the experimental fluorescence spectrum is a consequence of the harmonic oscillator approximation that is not well obeyed by transitions involving higher vibrational levels of the electronic ground state.
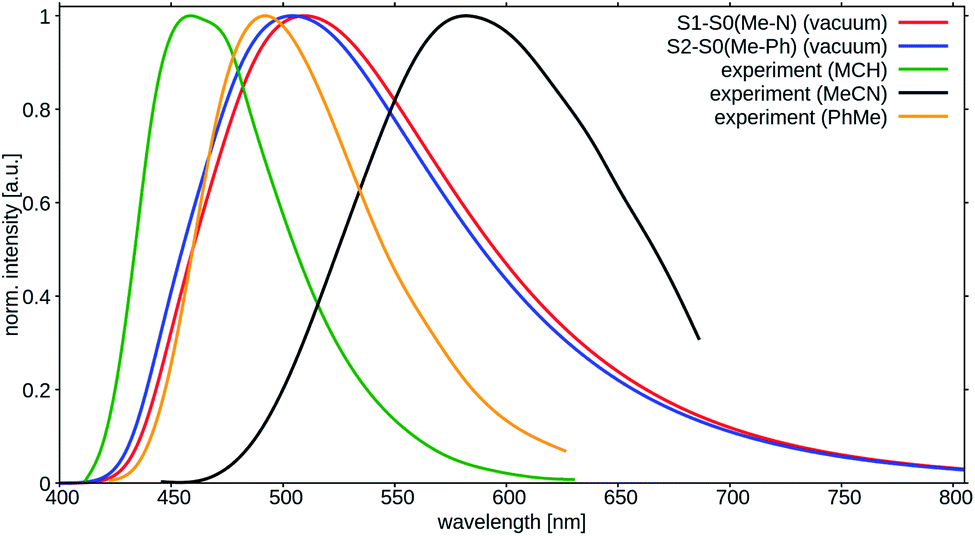 | ||
| Fig. 9 Calculated room temperature fluorescence spectra of TpAT-tFFO (red: S1 → S0 (Me → N), blue: S2 → S0 (Me → Ph)) in comparison to experimental emission spectra in methyl cyclohexane (green), toluene (gold) and acetonitrile (black).2 | ||
Much better agreement is found when the calculated adiabatic excitation energies of the isolated molecules are compared with the experimental on-sets of the emission spectra in rigid matrices that prevent the reorganization of the solvent cage (Table 1).
In order to rationalize the long-time component of the emission observed experimentally at 20 K,2 phosphorescence rate constants of the three low-lying triplet states were computed in FC approximation. Because vibronic interactions had only a moderate effect on the fluorescence and the computational costs for evaluating them are substantial, we refrained from computing phosphorescence in HT approximation. Component-averaged phosphorescence rate constants of kFCP ≈ 0.4 × 10⁻¹ s−1 (T1), kFCP ≈ 1.0 × 10⁻¹ s−1 (T2), and kFCP ≈ 8.3 × 10⁻¹ s−1 (T3) were obtained corresponding to radiative lifetimes of 25 s, 10 s, and about 1 s, respectively. Looking only at the numbers, one might be tempted to attribute the emission on the 100 millisecond time scale to phosphorescence emission from the LE T3 state that forms a shallow minimum on the first excited triplet energy surface. The LIPs in Fig. 7b suggest, however, strong nonadiabatic interactions between the T3 and T1 state in their crossing region energetically and geometrically close to the T3 minimum. Moreover, motions altering the tilted face-to-face of the donor and acceptor moieties (compare Fig. S30†) lead to crossings between T2 and T3. It can therefore be assumed that a triplet population in the T3 potential well rapidly relaxes via internal conversion to the lower-lying T1 or T2 states. Hence, phosphorescence is expected to originate from the 3CT states and not from the 3LE state. In addition to phosphorescence, T1(CT) ↝ S0 and T2(CT′) ↝ S0 nonradiative deactivation of the triplet population will occur, explaining the difference between the observed phosphorescence decay times (100 ms regime) and the much larger theoretical lifetime values (10 s regime) which correspond to purely radiative processes.
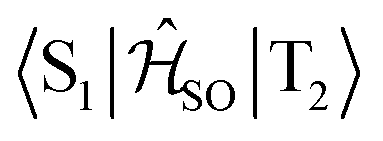
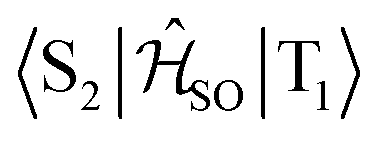
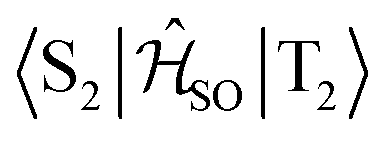
| Interacting states | @S1 | @S2 | @T1 | @T2 | @T3 |
|---|---|---|---|---|---|
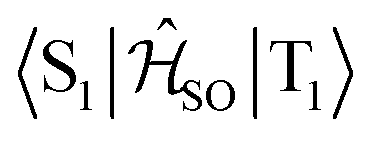
|
0.027 | — | 0.039 | — | — |
|
0.760 | — | — | 0.666 | — |

|
0.170 | — | — | — | 0.142 |
|
— | 0.581 | 0.750 | — | — |
|
— | 0.082 | — | 0.087 | — |
|
— | 0.348 | — | — | 0.299 |
The inclusion of vibrational SOC commonly enhances transitions between states with the same orbital character because they can get more mixed through displacements along the vibrational modes. In this way, ISC and rISC processes can indirectly borrow intensity from El-Sayed allowed transitions and are accelerated. Although the derivative couplings of the S1(CT) ↭ T1(CT) and S2(CT′) ↭ T2(CT′) transitions are tiny (Fig. S35 and S36†), the HT terms increase the rate constants of these processes by an order of magnitude in comparison to the FC approximation. In general, the SOCME gradients for transitions between states with similar minimum nuclear arrangements are small in comparison to those for transitions between states belonging to different geometry clusters (Fig. S35–S39†). The largest SOCME gradients are found for vibrational modes located mainly on the triazine acceptor unit of TpAT-tFFO. Contrary to the expectations, the fastest ISC is calculated for the transition from S2(CT′) to T2(CT′) which is associated with the largest energy gap (Table 3). In addition, the S1(CT) ↜ T3(LE) rISC rate constant reaches values of the order of 107 s−1. The avoided crossing along the LIP connecting the minima of the T1(CT) and T3(LE) potentials (Fig. 7b) suggests that the T3(LE) state in turn interacts with the T1(CT) state via nonadiabatic coupling and thus can act a mediator in the S1(CT) ↜ T3(LE) ↜ T1(CT) rISC process. A strong coupling between the T2(CT′) and T3(LE) pair of states is observed when the π-systems of A and T are tilted (mode 12, Fig. 8 and S30†). T3 may therefore act as a mediator of the S2(CT′) ↜ T3(LE) ↜ T2(CT′) rISC process as well.
| Process/temperature | ISC/20 K | ISC/300 K | rISC/20 K | rISC/300 K |
|---|---|---|---|---|
| S1(CT) ↭ T1(CT) | 4.3 × 10⁵ | 8.8 × 10⁵ | — | 2.3 × 10|4 |
| S1(CT) ↭ T2(CT′) | 2.6 × 10² | 3.6 × 10⁵ | — | 1.7 × 10³ |
| S1(CT) ↭ T3(LE) | — | 1.9 × 10⁴ | 6.5 × 10⁶ | 6.8 × 10⁶ |
| S2(CT′) ↭ T1(CT) | — | 1.4 × 10⁵ | — | 5.2 × 10³ |
| S2(CT′) ↭ T2(CT′) | 3.3 × 10⁶ | 6.5 × 10⁶ | — | 3.4 × 10⁴ |
| S2(CT′) ↭ T3(LE) | — | 1.2 × 10³ | 2.7 × 10⁵ | 8.4 × 10⁵ |
The cause of the largest uncertainties regarding the computed ISC and rISC rate constants relates to the magnitude of the singlet–triplet energy separation. The ΔEST values are somewhat overestimated by our quantum chemical calculations (Table 1) and therefore diminish the vibrational overlaps in the weak coupling case with nested PESs of the initial and final states. S1 ↭ T1 and S2 ↭ T2 belong to this coupling case. The results of various test calculations employing energy-shifted singlet and triplet potentials with gaps ranging from 0.02 to 0.17 eV are displayed in Fig. 10.
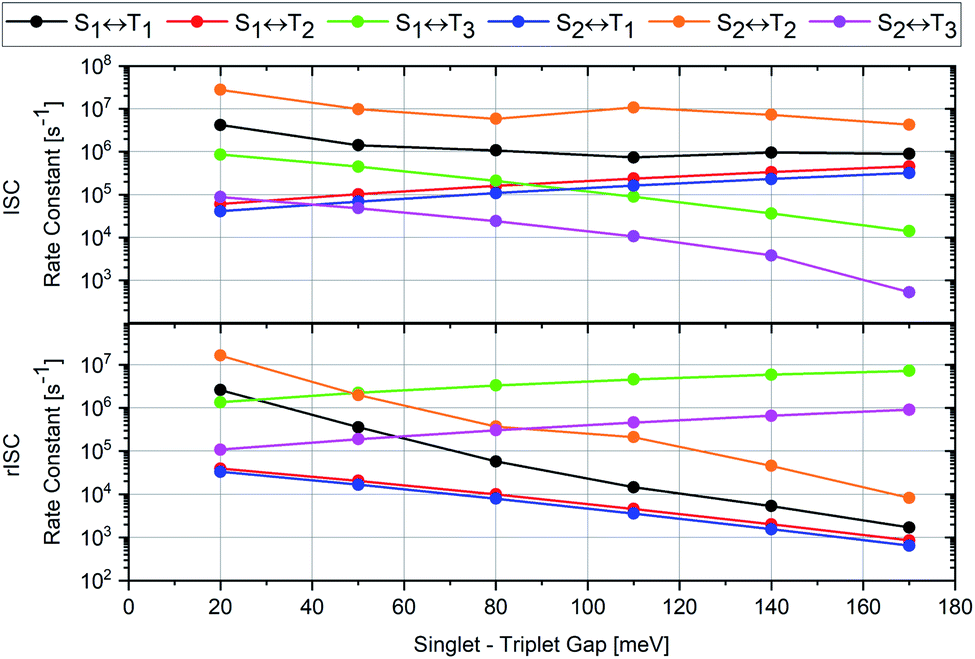 | ||
| Fig. 10 Variation of the computed rate constants for ISC (upper panel) and rISC (lower panel) at 300 K with the adiabatic singlet–triplet energy separation of the initial and final states. Note the logarithmic scale of the ISC and rISC rate constants. The corresponding numerical data may be found in Tables S15 and S16.† | ||
Following the energy gap law of the weak coupling case,9,45 the rate constants of the S1 ↝ T1 and S2 ↝ T2 ISC transitions increase by roughly one order of magnitude when ΔEST is decreased to 0.02 eV, a value closer to the experimental estimates. As may be expected, the corresponding S1 ↜ T1 and S2 ↜ T2 rISC processes are affected even more strongly. Their rate constants are substantially enhanced when the singlet–triplet gap is reduced to 0.02 eV. Inverse trends are observed for the S1 ↝ T2 and S2 ↝ T1 ISC transitions which belong to the strong coupling case with substantial geometry displacements in at least some normal coordinates. Their rate constants are reduced by about one order of magnitude when the diminished. The corresponding S1 ↜ T2 and S2 ↜ T1 rISC rate constants increase, but to a much lesser extent than those of the S1 ↜ T1 and S2 ↜ T2 rISC transitions. The S1(CT) ↝ T3(LE) and S2(CT′) ↝ T3(LE) ISC transitions, which are uphill processes, benefit from the reduction of the energy gap as well, but remain slower than the S1 ↭ T1 and S2 ↭ T2 ISC transitions. The corresponding downhill S1(CT) ↜ T3(LE) and S2(CT′) ↜ T3(LE) rISC processes are less strongly affected by the potential energy shifts. Their rate constants are reduced when the singlet–triplet gap gets smaller. In both directions, the S1 ↭ T3 transitions are preferred over the S2 ↭ T1 transitions, despite their smaller electronic SOCMEs (Table 2). These examples once again underscore that is not sufficient to rely solely on the magnitude of the electronic SOCME when identifying possible ISC and rISC pathways. To get the whole picture, the inclusion of vibrational factors and vibronic interactions is mandatory for modelling ISC and rISC in donor–acceptor compounds.
4 Conclusions
All in all, the results of our quantum chemical studies support a kinetic model for the emission decay of TpAT-tFFO involving five electronically excited states which are coupled by spin–orbit and vibronic interactions. Three of these states, a pair of singlet and triplet CT states (S1 and T1) and a LE triplet state (T3), can be associated with the (Me → N) conformer of TpAT-tFFO. To avoid confusion, the other two CT-type states that form the lowest excited singlet and triplet states, respectively, of the (Me → Ph) conformer, have been named S2 and T2 because they are the second of their kind at the ground-state geometries of both conformers. The two conformers differ in essence by the tilt angle formed by the nearly parallel A donor and T acceptor moieties with the Tp bridge. While the two conformers are easily interconverted in the electronic ground state – given that the environment does not sterically hinder the transformation – this is not the case in the excited state where the reorganization energy is substantial. For this reason, dual fluorescence emission may occur.Fig. 11 summarizes the most important findings with regard to the excitation decay mechanism. The emission energies of the two excited singlet potential energy wells are nearly identical, but the radiative rate constant of the (Me → N) conformer is somewhat larger than the one of the (Me → Ph) conformer. This explains why only one emission band but two different prompt fluorescence time constants have been observed experimentally.
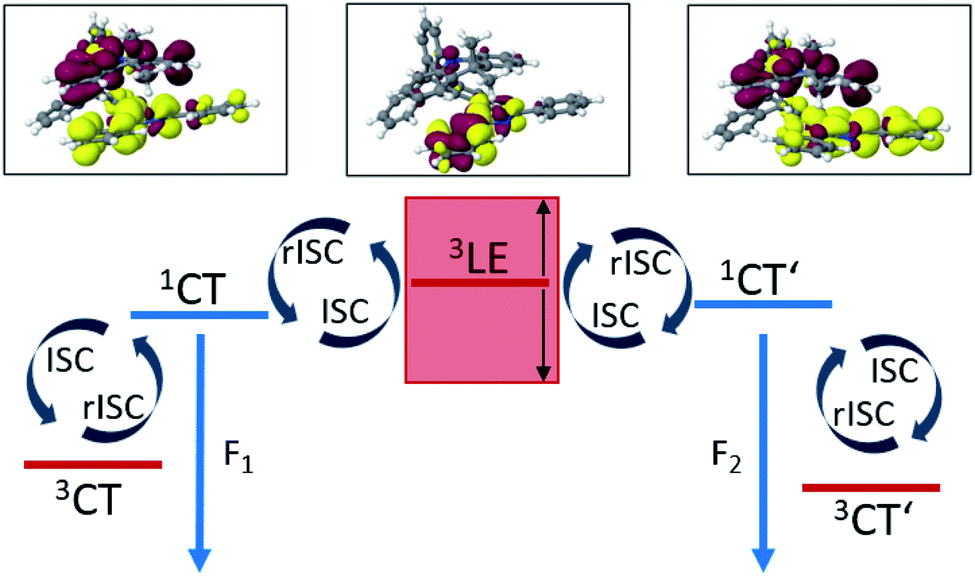 | ||
| Fig. 11 Schematic excitation decay mechanism of the nearly degenerate (Me → N) and (Me → Ph) conformers of TpAT-tFFO. ISC and rISC processes are promoted by vibronic spin–orbit coupling. Low-frequency vibrations that diminish the distance between donor and acceptor π-systems tune the first excited singlet CT states of the conformers and the LE T3 state into and out of resonance. | ||
Like in many donor–acceptor compounds, the ISC and rISC processes between the CT states of TpAT-tFFO are markedly accelerated by spin-vibronic interactions with a nearby LE triplet acceptor state, T3, located slightly above the S1 and S2 minima according to our calculations. While the computed ISC and rISC rate constants are sensitive with respect to the singlet–triplet energy separations, it is clear that S1(CT) ↝ T1(CT) and S2(CT′) ↝ T2(CT′) ISC outcompete prompt fluorescence. For singlet–triplet energy gaps larger than 0.05 eV, rISC is fastest for the S1(CT) ↜ T3(LE) transition which is a slight downhill process. The avoided crossing of the T1(CT) and T3(LE) potentials suggests that the T3(LE) and T1(CT) states are strongly coupled by nonadiabatic interactions and that thus the T3(LE) state can act a mediator in the S1(CT) ↜ T3(LE) ↜ T1(CT) rISC process at RT. The interconversion of the CT′ states is promoted by the T3(LE) state as well. Low-frequency vibrational modes that alter the tilt angle and the interplanar distance of the donor and acceptor moieties play a decisive role in the nonadiabatic coupling of these triplet states. If the energy gaps between the lowest-lying 1CT and 3CT states of the (Me → N) and (Me → Ph) conformers, S1(CT)–T1(CT) and S2(CT′)–T2(CT′), are reduced to 0.02 eV, as suggested by the experimental data, the vibronically enhanced S1(CT) ↭ T1(CT) and S2(CT′) ↭ T2(CT′) mechanisms prevail at RT.
At cryogenic temperatures, the S1(CT) ↝ T1(CT) and S2(CT′) ↝ T2(CT′) ISC are still competitive with fluorescence whereas the corresponding rISC processes are not. T1(CT) → S0 and T2(CT′) → S0 phosphorescence is held accountable for the long-time component of the emission observed experimentally at 20 K.
Turning our focus from the specific situation in TpAT-tFFO to more general aspects of the decay mechanism inherent to organic through-space charge transfer TADF emitters, our results suggest that the interplay between vibronic and spin–orbit effects is a key feature increasing the ISC and rISC probabilities in this class of chromophores. In particular, low-frequency shearing and breathing motions have the potential to alter the interplanar spacing of the donor and acceptor units and hence the energetic position of the singlet and triplet CT states in relation to low-lying triplet LE states. Intersections of the CT and LE potentials along these modes offer easy and efficient pathways for the interconversion of spin multiplicities in these light-element compounds despite the relatively small size of the spin–orbit coupling in comparison to transition metal complexes.
Data availability
Cartesian coordinates of all optimized minimum structures can be obtained upon request from the authors.Author contributions
Jeremy M. Kaminski and Angela Rodríguez-Serrano (computational investigation, preparation of images and writing), Fabian Dinkelbach (software development and computational setup), Hector Miranda Salinas (experimental investigation and preparation of images), Andrew P. Monkman and Christel M. Marian (conceptualization, funding acquisition, project administration, supervision and writing).Conflicts of interest
There are no conflicts to declare.Acknowledgements
This research was funded by the Deutsche Forschungsgemeinschaft (DFG, German Research Foundation) – 396890929/GRK 2482 and MA1051/17-1. HMS acknowledges the Mexican National Council for Science and Technology, CONACYT for his studentship (2019-000021-01EXTF-00308). APM acknowledges the EPSRC for funding under grant number EP/T02240X/1.Notes and references
- Y. Wada, H. Nakagawa, S. Matsumoto, Y. Wakisaka and H. Kaji, Nat. Photonics, 2020, 14, 643–649 CrossRef CAS.
- H. Miranda-Salinas, A. Rodriguez-Serrano, J. M. Kaminski, F. Dinkelbach, C. M. Marian and A. P. Monkman, to be published. Originally, a back-to-back publication of the experimental and theoretical studies on TpAT-tFFO in Chem. Science had been intended.
- B. T. Lim, S. Okajima, A. Chandra and E. Lim, Chem. Phys. Lett., 1981, 79, 22–27 CrossRef CAS.
- M. Etherington, J. Gibson, H. F. Higginbotham, T. J. Penfold and A. P. Monkman, Nat. Commun., 2016, 7, 13680 CrossRef CAS PubMed.
- J. Gibson, A. P. Monkman and T. J. Penfold, ChemPhysChem, 2016, 17, 2956–2961 CrossRef CAS PubMed.
- C. M. Marian, J. Phys. Chem. C, 2016, 120, 3715–3721 CrossRef CAS.
- I. Lyskov and C. M. Marian, J. Phys. Chem. C, 2017, 121, 21145–21153 CrossRef CAS.
- T. J. Penfold, E. Gindensperger, C. Daniel and C. M. Marian, Chem. Rev., 2018, 118, 6975–7025 CrossRef CAS PubMed.
- C. M. Marian, Annu. Rev. Phys. Chem., 2021, 72, 617–640 CrossRef CAS PubMed.
- Q. Li, J. Hu, J. Lv, X. Wang, S. Shao, L. Wang, X. Jing and F. Wang, Angew. Chem., Int. Ed., 2020, 59, 20174–20182 CrossRef CAS PubMed.
- S. Kumar, L. G. Franca, K. Stavrou, E. Crovini, D. B. Cordes, A. M. Z. Slawin, A. P. Monkman and E. Zysman-Colman, J. Phys. Chem. Lett., 2021, 12, 2820–2830 CrossRef CAS PubMed.
- Y. Song, M. Tian, R. Yu and L. He, ACS Appl. Mater. Interfaces, 2021, 13, 60269–60278 CrossRef CAS PubMed.
- V. Rai-Constapel, T. Villnow, G. Ryseck, P. Gilch and C. M. Marian, J. Phys. Chem. A, 2014, 118, 11708–11717 CrossRef CAS PubMed.
- T. Villnow, G. Ryseck, V. Rai-Constapel, C. M. Marian and P. Gilch, J. Phys. Chem. A, 2014, 118, 11696–11707 CrossRef CAS PubMed.
- R. Mundt, T. Villnow, C. T. Ziegenbein, P. Gilch, C. Marian and V. Rai-Constapel, Phys. Chem. Chem. Phys., 2016, 18, 6637–6647 RSC.
- M. Bracker, C. M. Marian and M. Kleinschmidt, J. Chem. Phys., 2021, 155, 014102 CrossRef CAS PubMed.
- A. Rodríguez-Serrano, F. Dinkelbach and C. M. Marian, Phys. Chem. Chem. Phys., 2021, 23, 3668–3678 RSC.
- TURBOMOLE V7.0 2015, A development of University of Karlsruhe and Forschungszentrum Karlsruhe GmbH, TURBOMOLE GmbH, 1989–2007, since 2007; available from, https://www.turbomole.com Search PubMed.
- J. P. Perdew, K. Burke and M. Ernzerhof, Phys. Rev. Lett., 1996, 77, 3865–3868 CrossRef CAS PubMed.
- C. Adamo and V. Barone, J. Chem. Phys., 1999, 110, 6158–6170 CrossRef CAS.
- S. Grimme, J. Antony, S. Ehrlich and H. Krieg, J. Chem. Phys., 2010, 132, 154104 CrossRef PubMed.
- S. Grimme, S. Ehrlich and L. Goerigk, J. Comput. Chem., 2011, 32, 1456–1465 CrossRef CAS PubMed.
- E. Runge and E. K. U. Gross, Phys. Rev. Lett., 1984, 52, 997–1000 CrossRef CAS.
- M. A. L. Marques and E. K. U. Gross, A Primer in Density Functional Theory, Springer, Berlin, Heidelberg, 2003, pp. 144–184 Search PubMed.
- A. Dreuw and M. Head-Gordon, J. Am. Chem. Soc., 2004, 126, 4007–4016 CrossRef CAS PubMed.
- F. Furche and R. Ahlrichs, J. Chem. Phys., 2002, 117, 7433–7447 CrossRef CAS.
- S. Hirata and M. Head-Gordon, Chem. Phys. Lett., 1999, 314, 291–299 CrossRef CAS.
- M. J. Frisch, G. W. Trucks, H. B. Schlegel, G. E. Scuseria, M. A. Robb, J. R. Cheeseman, G. Scalmani, V. Barone, G. A. Petersson, H. Nakatsuji, X. Li, M. Caricato, A. V. Marenich, J. Bloino, B. G. Janesko, R. Gomperts, B. Mennucci, H. P. Hratchian, J. V. Ortiz, A. F. Izmaylov, J. L. Sonnenberg, D. Williams-Young, F. Ding, F. Lipparini, F. Egidi, J. Goings, B. Peng, A. Petrone, T. Henderson, D. Ranasinghe, V. G. Zakrzewski, J. Gao, N. Rega, G. Zheng, W. Liang, M. Hada, M. Ehara, K. Toyota, R. Fukuda, J. Hasegawa, M. Ishida, T. Nakajima, Y. Honda, O. Kitao, H. Nakai, T. Vreven, K. Throssell, J. A. Montgomery Jr, J. E. Peralta, F. Ogliaro, M. J. Bearpark, J. J. Heyd, E. N. Brothers, K. N. Kudin, V. N. Staroverov, T. A. Keith, R. Kobayashi, J. Normand, K. Raghavachari, A. P. Rendell, J. C. Burant, S. S. Iyengar, J. Tomasi, M. Cossi, J. M. Millam, M. Klene, C. Adamo, R. Cammi, J. W. Ochterski, R. L. Martin, K. Morokuma, O. Farkas, J. B. Foresman and D. J. Fox, Gaussian 16, Revision A.03, Gaussian, Inc, Wallingford CT, 2016 Search PubMed.
- S. Grimme and M. Waletzke, J. Chem. Phys., 1999, 111, 5645–5655 CrossRef CAS.
- C. M. Marian, A. Heil and M. Kleinschmidt, Wiley Interdiscip. Rev.: Comput. Mol. Sci., 2019, 9, e1394 Search PubMed.
- M. Kleinschmidt, C. M. Marian, M. Waletzke and S. Grimme, J. Chem. Phys., 2009, 130, 044708 CrossRef PubMed.
- A. D. Becke, J. Chem. Phys., 1993, 98, 1372–1377 CrossRef CAS.
- C. Lee, W. Yang and R. G. Parr, Phys. Rev. B: Condens. Matter Mater. Phys., 1988, 37, 785–789 CrossRef CAS PubMed.
- I. Lyskov, M. Kleinschmidt and C. M. Marian, J. Chem. Phys., 2016, 144, 034104 CrossRef PubMed.
- F. Plasser, J. Chem. Phys., 2020, 152, 084108 CrossRef CAS PubMed.
- M. Kleinschmidt, J. Tatchen and C. M. Marian, J. Comput. Chem., 2002, 23, 824–833 CrossRef CAS PubMed.
- M. Kleinschmidt and C. M. Marian, Chem. Phys., 2005, 311, 71–79 CrossRef CAS.
- M. Kleinschmidt, J. Tatchen and C. M. Marian, J. Chem. Phys., 2006, 124, 124101 CrossRef PubMed.
- B. A. Heß, C. M. Marian, U. Wahlgren and O. Gropen, Chem. Phys. Lett., 1996, 251, 365–371 CrossRef.
- B. Schimmelpfennig, Atomic mean-field integral program AMFI, University of Stockholm, 1996 Search PubMed.
- M. Etinski, J. Tatchen and C. M. Marian, Phys. Chem. Chem. Phys., 2014, 16, 4740 RSC.
- M. Etinski, J. Tatchen and C. M. Marian, J. Chem. Phys., 2011, 134, 154105 CrossRef PubMed.
- J. Tatchen, N. Gilka and C. M. Marian, Phys. Chem. Chem. Phys., 2007, 9, 5209 RSC.
- M. Etinski, V. Rai-Constapel and C. M. Marian, J. Chem. Phys., 2014, 140, 114104 CrossRef PubMed.
- R. Englman and J. Jortner, Mol. Phys., 1970, 18, 145–164 CrossRef CAS.
Footnote |
| † Electronic supplementary information (ESI) available: Details of the electronic structure data, TDDFT energies, scans along normal modes and linearly interpolated paths, spin–orbit coupling matrix elements and their derivatives with respect to normal modes. See https://doi.org/10.1039/d1sc07101g |
| This journal is © The Royal Society of Chemistry 2022 |