
 Open Access Article
 This Open Access Article is licensed under a
 Creative Commons Attribution 3.0 Unported Licence
Generating 3D molecules conditional on receptor binding sites with deep generative models†
Matthew
Ragoza
 *a,
Tomohide
Masuda
b and
David Ryan
Koes
c
*a,
Tomohide
Masuda
b and
David Ryan
Koes
c
aIntelligent Systems Program, University of Pittsburgh, Pittsburgh, PA 15213, USA. E-mail: mtr22@pitt.edu
bDepartment of Computational and Systems Biology, University of Pittsburgh, Pittsburgh, PA 15213, USA. E-mail: tmasuda@pitt.edu
cDepartment of Computational and Systems Biology, University of Pittsburgh, Pittsburgh, PA 15213, USA. E-mail: dkoes@pitt.edu
First published on 7th February 2022
Abstract
The goal of structure-based drug discovery is to find small molecules that bind to a given target protein. Deep learning has been used to generate drug-like molecules with certain cheminformatic properties, but has not yet been applied to generating 3D molecules predicted to bind to proteins by sampling the conditional distribution of protein–ligand binding interactions. In this work, we describe for the first time a deep learning system for generating 3D molecular structures conditioned on a receptor binding site. We approach the problem using a conditional variational autoencoder trained on an atomic density grid representation of cross-docked protein–ligand structures. We apply atom fitting and bond inference procedures to construct valid molecular conformations from generated atomic densities. We evaluate the properties of the generated molecules and demonstrate that they change significantly when conditioned on mutated receptors. We also explore the latent space learned by our generative model using sampling and interpolation techniques. This work opens the door for end-to-end prediction of stable bioactive molecules from protein structures with deep learning.
1. Introduction
Chemical space is enormous, but the subset of molecules that have desirable biological activity is much smaller. Drug discovery typically requires searching through this space for molecules that bind to a specific target, such as a protein implicated in a disease. Thus the search for new drugs involves an alternating procedure of (1) sampling compounds from promising regions of chemical space and (2) screening them for activity against the biological target. The difficulty of searching chemical space for novel therapeutics has lead to the development of computational methods that sample and screen compounds in silico before they are validated experimentally. To reduce the time and cost of drug development, there is growing recognition of the need for new algorithms for sampling compounds with a high chance of success and predicting their biological activity through virtual screening.Given that the structure of biomolecules determines their function, leveraging the three-dimensional (3D) structure of the target when screening drug candidates has the potential to improve prediction quality.1 The increasing availability of structural data in public repositories like the Protein Data Bank2 has led to the widespread adoption of machine learning in structure-based drug discovery. Machine learning allows complex nonlinear models of protein–ligand binding to be learned automatically from structural features. Furthermore, the impressive performance of deep learning in computer vision and natural language processing has inspired researchers to apply these methods to biological structures as well. Deep neural networks can learn highly abstract functions from structural data with minimal featurization. This is recently exemplified by AlphaFold, a deep learning model capable of predicting the 3D structures of proteins with high accuracy directly from their amino acid sequence and evolutionary information.3 Despite the utility of deep learning models, it is crucial that they are designed with the appropriate inductive biases and assessed with sufficient cross-validation to avoid overfitting.
Deep learning was first introduced in structure-based drug discovery for scoring the 3D interactions between target proteins (receptors) and small molecules that could potentially bind to them (ligands). Protein–ligand scoring can be formulated as three-dimensional image recognition by training convolutional neural networks (CNNs) on docked protein–ligand poses represented as atomic density grids. This approach has been successfully applied to binding discrimination,4,5 pose ranking,5 and affinity prediction.6,7 Furthermore, grid-based CNN scoring functions have been integrated into ligand pose optimization8 for molecular docking,9 where they outperform traditional scoring functions. Neural networks have also been applied to binding affinity prediction10 and quantum energy estimation11 using atomic coordinate-based representations. Deep learning is now widely regarded as the state-of-the-art in virtual screening.
In contrast, it has only recently become viable to use deep learning to sample molecules with drug-like properties prior to virtual screening. Initial efforts to train deep generative models on molecules12–14 took cues from language modeling by representing molecules with the SMILES string syntax.15 Improvements on these approaches used reinforcement learning to guide the generation process towards desired cheminformatic criteria.16,17 Other work included grammatical constraints that alleviate the tendency for generative models to produce invalid SMILES strings.18,19 Despite these improvements, SMILES strings are not permutation invariant, so they do not capture the notion of chemical similarity. They also lack conformational information, which limits their applicability to structure-based drug discovery.
Molecular graphs have been used as a more natural representation of molecules than SMILES strings. Graphs can be provided as input to message-passing neural networks20 and can be generated as output using fully-connected layers.21 However, assuming that generated bonds are independent can result in invalid valences. Solutions include producing molecules as trees of chemically valid substructures22 or hard-coding valency constraints into the generative process.23,24 Another concern is that comparing molecules in the loss function requires a graph matching algorithm, which is computationally expensive unless approximations are made.21,25 Generative adversarial networks (GANs) avoid this by only comparing molecules implicitly, but they are notoriously difficult to train.26,27 The generation of molecular graphs with deep neural networks can also be biased towards cheminformatic objectives using reinforcement learning.25–27
Most work on deep generative models of molecules have used 2D representations, but contemporary methods can also generate 3D conformations. Early efforts generated different conformers of a single chemical formula using autoregressive models, which output atoms sequentially.28 These have been extended for generating conformers with arbitrary chemical composition,29 simultaneously producing the coordinates and molecular graph,24,30 and generating linker atoms that connect fragments into valid 3D molecules.31 Autoregressive models can be made invariant to rotations and translations by modeling distributions over interatomic distances instead of coordinates. However, they require selecting a canonical atomic ordering due to lack of permutation invariance. On the other hand, non-autoregressive approaches generate distance matrices all at once,32 and have been extended to generating conformers conditioned on a molecular graph.33,34 One challenge of non-autoregressive models is that generating distance matrices requires enforcing the triangle inequality. Another drawback is that the Hungarian algorithm, which has cubic time complexity in the number of atoms, must be applied to compare distance matrices in a permutation agnostic manner.
Atomic density grids can also be used as a 3D representation of molecules for generative modeling. Unlike distance matrices, grids are coordinate frame-dependent. However, they are permutation invariant and can be compared without expensive matching algorithms. Density grids also provide holistic shape information that is not easily accessible from atomistic representations, and is arguably of equal importance for protein–ligand binding as pairwise interactions. The main obstacle to generative modeling with atomic density grids is converting them into discrete molecules. Past work has used Wiener deconvolution to approximate the inverse of the density kernel,35 but this does not lead to an unambiguous set of atoms and bonds. Another group trained an auxiliary captioning network to output SMILES strings based on density grids,36 but this relinquishes the 3D structure generated by the model. Iterative atom fitting and bond inference is the only approach, to our knowledge, that produces 3D molecular structures from atomic density grids.37
The use of protein structure to generate molecules with deep learning an under-explored research area. Preliminary work has generated SMILES strings based on receptor binding site information represented as atomic density grids38 or Coulomb matrices.39 Others used reinforcement learning to guide the sampling of 3D ligands towards high affinity for a target protein30 or conditioned the generation of molecular graphs on density grids of 3D pharmacophores.40 However, generating 3D molecular structures directly from protein binding pockets remains an unsolved challenge.41 To address this, we make the following contributions:
(1) The first demonstration of 3D molecular structure generation with receptor-conditional deep generative models.
(2) Evaluation of the effect on generated molecules of conditioning the generative model on mutated receptors.
(3) Exploration of the latent space learned by the generative model through sampling and interpolation.
2. Methods
2.1. Property-based atom typing
An overview of our methods can be viewed in Fig. 1. First, we assign atom types to molecules using a set of Np atomic property functions p and value ranges for those properties v, which are listed in Table 1. For a given atom a, the atom type vector t ∈![[Doublestruck R]](https://www.rsc.org/images/entities/i_char_e175.gif) NT is created by concatenating Np atomic property vectors p through the following:
NT is created by concatenating Np atomic property vectors p through the following: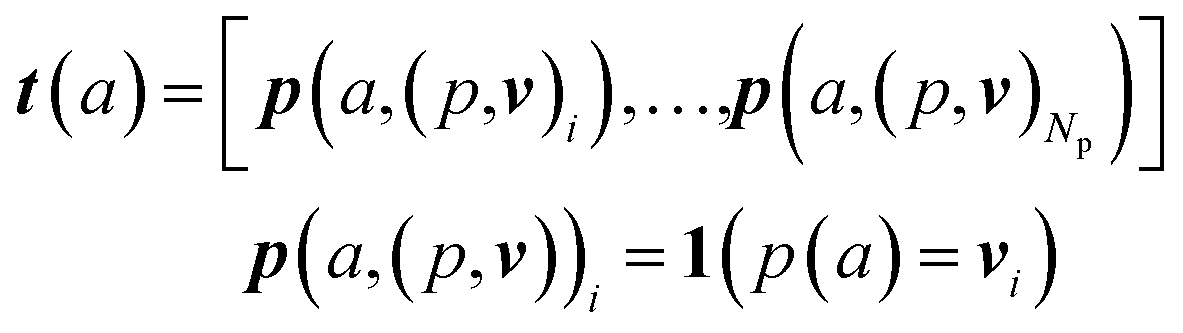 | (1) |
| Atomic property | Value range | Num. values |
|---|---|---|
| Ligand element | B, C, N, O, F, P, S, Cl, Br, I, Fe | 11 |
| Receptor element | C, N, O, Na, Mg, P, S, Cl, K, Ca, Zn | 11 |
| Aromatic | False, true | 2 |
| H-bond acceptor | True | 1 |
| H-bond donor | True | 1 |
| Formal charge | −1, 0, 1 | 3 |
The atomic properties we used were element, aromaticity, H-bond donor and acceptor status, and formal charge. Different element ranges were represented for receptor atoms and ligand atoms, but the value ranges for all other properties were the same. The process we used to construct value ranges for properties and compare different type schemes is described in the supplement.
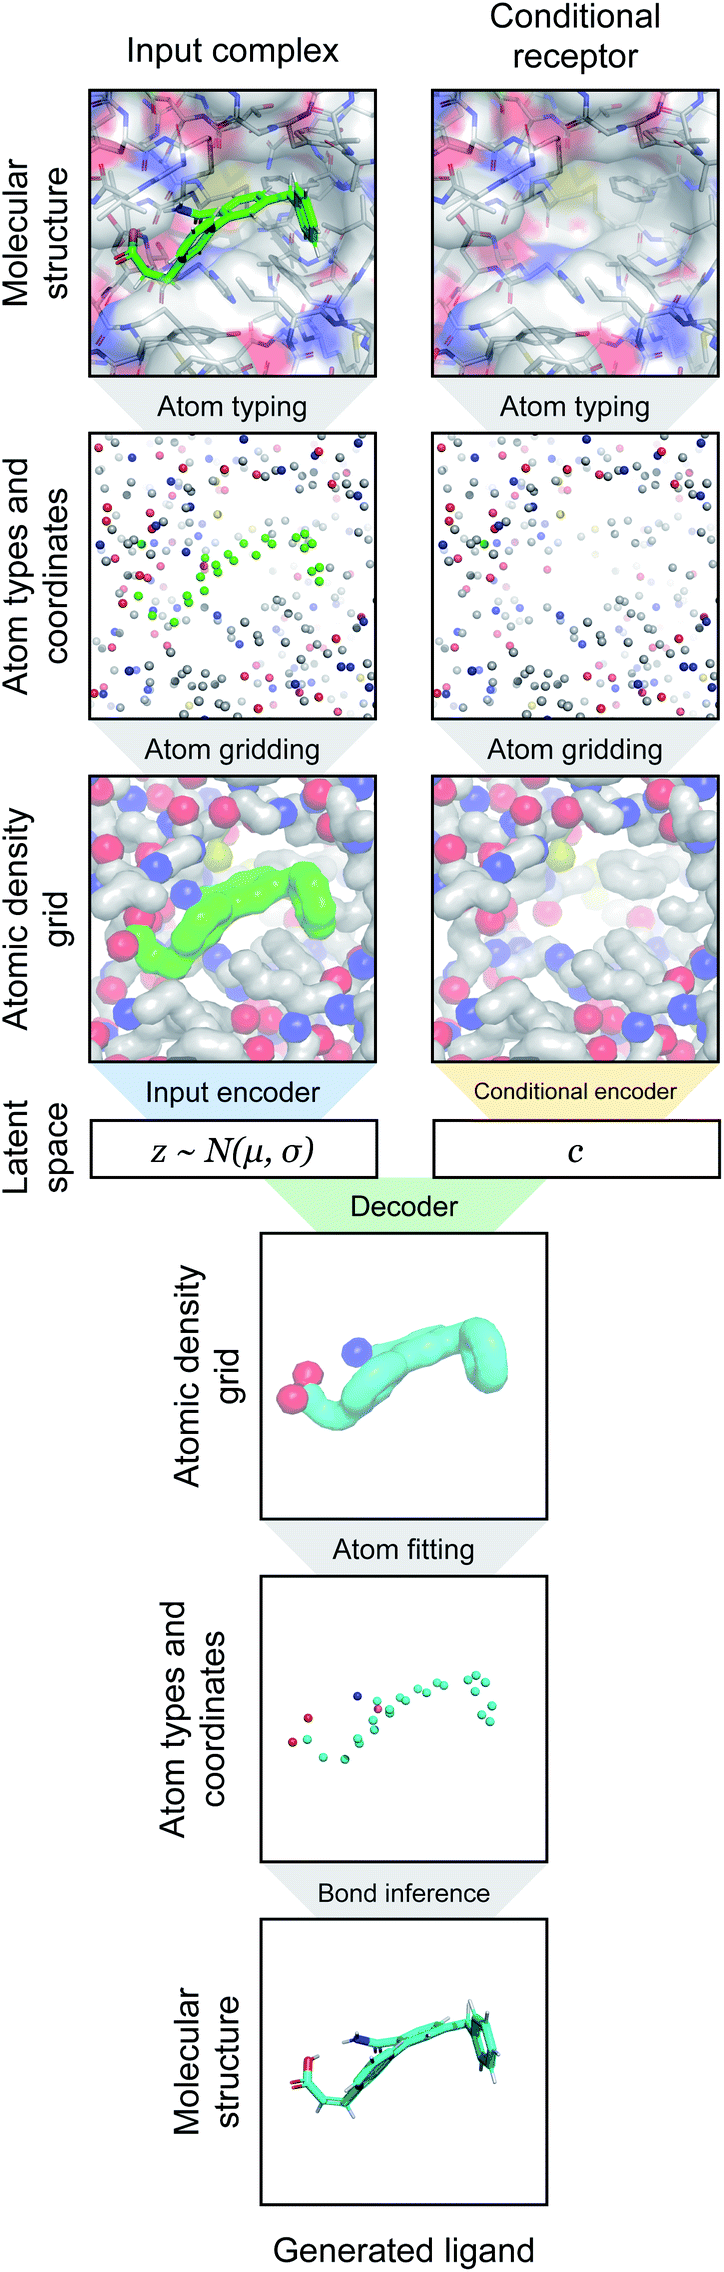 | ||
| Fig. 1 Overview of generative modeling pipeline. First, a docked protein–ligand complex is converted to an atomic density representation through atom typing and gridding operations. Density grids are then provided as input to a conditional variational autoencoder (CVAE). The CVAE input branch encodes the full complex density, while its conditional branch encodes only the receptor density. The complex density is mapped to a probabilistic latent space, which is then sampled as a latent vector z ∼ N(μ, σ). This is combined with the conditional vector c output by the conditional encoder, and together they are provided to the decoder. The decoder generates an output ligand density that is converted into the final 3D molecular structure through atom fitting and bond adding. | ||
2.2. Atomic density grids
After assigning atom type vectors, we convert molecules to an atomic density grid format. Atoms are each represented as continuous densities with a truncated Gaussian shape. The density value of an atom at a grid point is defined by a kernel function f: × → that takes as input the distance d between the atom coordinate and the grid point and the atomic radius r: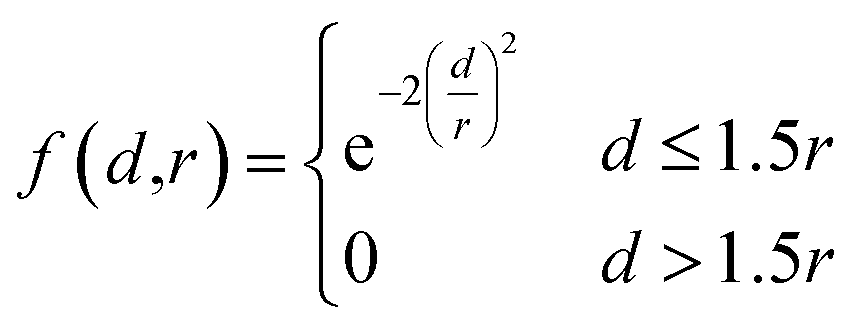 | (2) |
The radius was fixed at r = 1.0 for all atoms in this work. Grid values are computed by summing the density kernel of each atom at each point on a 3D grid, multiplied by the value of the atom's type vector in the corresponding grid channel. A molecule with N atoms and atom type vectors of length NT can be represented as a matrix of atom types T ∈ N×NT and a matrix of atomic coordinates C ∈ N×3. The function that computes atomic density grids g: N×NT × N×3 → NT×NX×NY×NZ is then defined as follows:
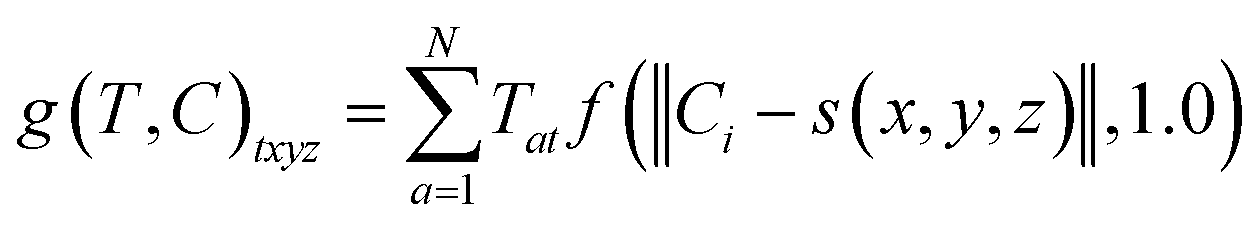 | (3) |
![[Doublestruck Z]](https://www.rsc.org/images/entities/i_char_e17d.gif) 3 → 3 grid indices to spatial coordinates. We center the grids on the input molecule before adding random translations and rotations during both training and evaluation. This is facilitated by computing grids on-the-fly using libmolgrid, a GPU-accelerated molecular gridding library.42
3 → 3 grid indices to spatial coordinates. We center the grids on the input molecule before adding random translations and rotations during both training and evaluation. This is facilitated by computing grids on-the-fly using libmolgrid, a GPU-accelerated molecular gridding library.42
2.3. Atom fitting algorithm
The inverse problem of converting a reference density grid Gref into a discrete 3D molecular structure does not have an analytic solution, so we solve it as the following optimization problem: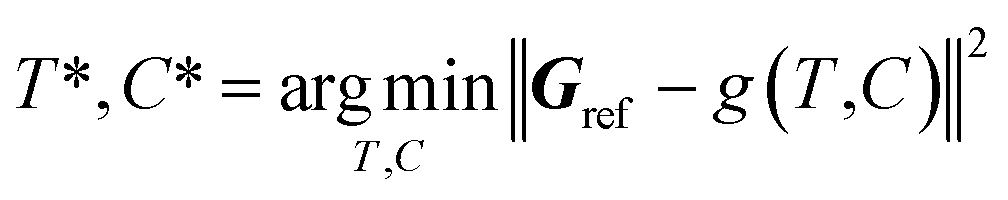 | (4) |
2.4. Bond inference algorithm
We construct valid molecules from the sets of atoms detected by atom fitting using a sequence of inference rules that add bond information and hydrogens while trying to satisfy the constraints defined by the atom types. The algorithm is based on customized bond perception routines implemented in OpenBabel.43,44 An overview of the procedure is shown in Algorithm S1.†2.5. Conditional variational autoencoder
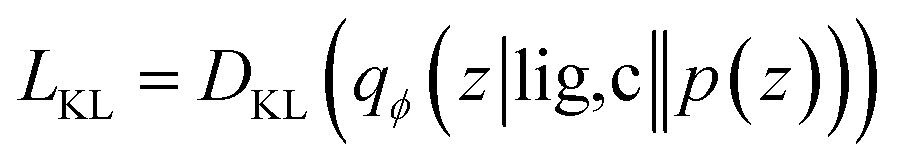
Our generative model is a conditional variational autoencoder (CVAE)45 of atomic density grids with the architecture displayed in Fig. 2. The objective is to learn to sample from the distribution p(lig|rec), where rec is a receptor binding site density and lig is the density of a ligand that binds to it. We assume that there is a latent variable z representing binding interactions that follows a prior distribution we can sample, such as a standard normal distribution. The generative process consists of drawing a sample z ∼ p(z) followed by liggen ∼ pθ(lig|z, c), where pθ is a decoder neural network and c is an encoding of a receptor density rec produced by a conditional encoder network. Training this model by naive maximum likelihood estimation would require computing the latent posterior probability pθ(z|rec, lig), which is intractable. The key is to instead train an input encoder network to learn an approximate model qϕ(z|rec, lig) of the posterior distribution. The training task minimizes two objectives: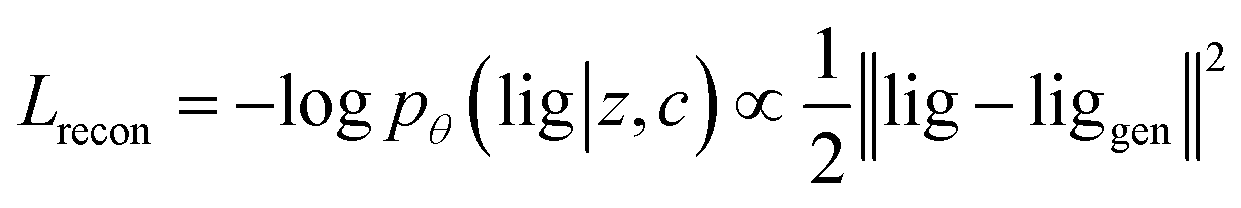 | (5) |
 | (6) |
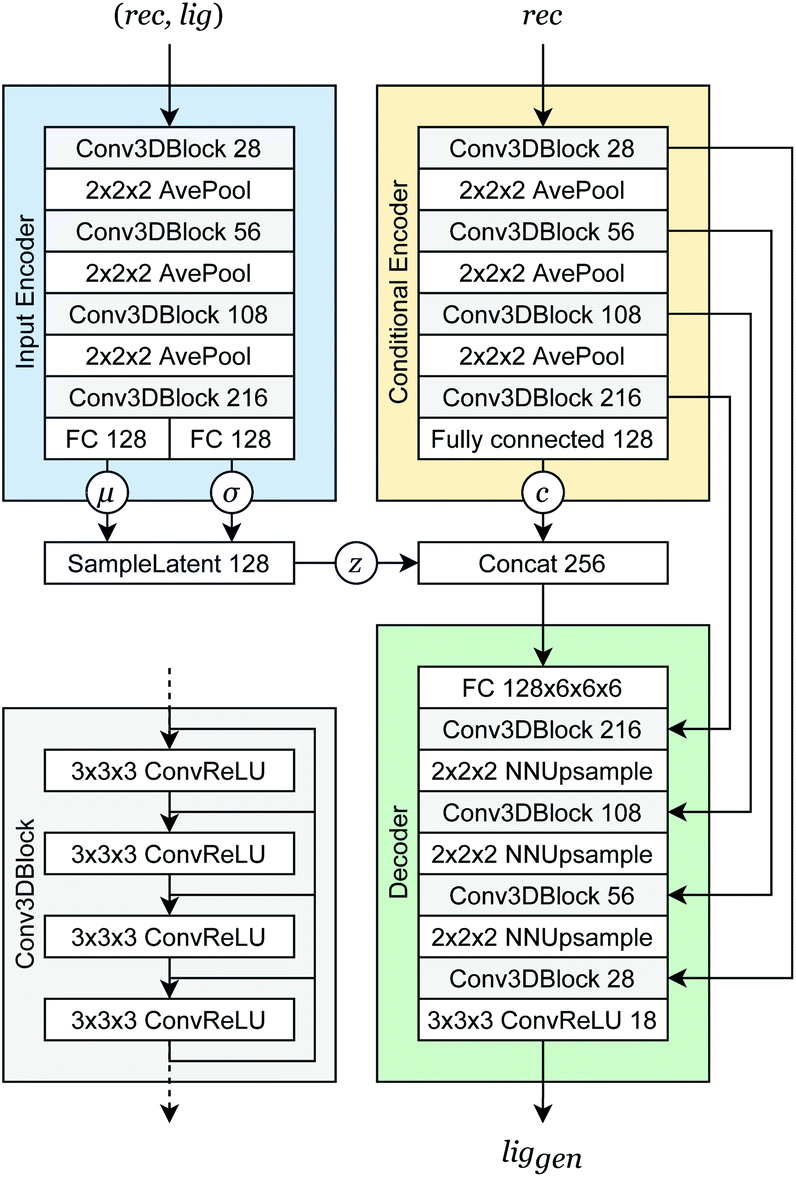 | ||
| Fig. 2 Generative model architecture. The input encoder maps a protein–ligand complex to a set of means and standard deviations defining latent variables, which are sampled to produce a latent vector z. The conditional encoder maps a receptor to a conditional encoding vector c. The latent vector and conditional vector are concatenated and provided to the decoder, which maps them to a generated ligand density grid. The input encoder and conditional encoder consist of 3D convolutional blocks with leaky ReLU activation functions and residual connections46 (see detail of Conv3DBlock), alternated with average pooling. The decoder uses a similar architecture in reverse, with transposed convolutions and nearest-neighbor upsampling instead of pooling. U-Net skip connections47 were included between the convolutional features of the conditional encoder and the decoder to enhance the processing of receptor context. Spectral normalization48 was applied to all learnable parameters during training. The value displayed after module names in the diagram indicates the number of outputs (or feature maps, for convolutional modules). If not specified, the number of outputs did not change from the previous layer. | ||
The reconstruction loss term Lrecon term maximizes the probability that latent samples from the approximate posterior distribution z ∼ qϕ(z|rec, lig) are decoded as realistic ligand densities – specifically, the real ligand density lig that was provided to the input encoder. The Kullback–Liebler divergence term LKL encourages the approximate posterior distribution to match the true prior distribution, p(z) = N(0, 1). The combined effect is that the latent space follows a normal distribution, enabling generative sampling, while the decoded samples are expected to appear realistic in the receptor context. The model is trained by providing real (rec, lig) examples to the encoder to get latent representations of their interactions, then maximizing the likelihood of decoding the latent vectors back to the corresponding ligand densities when conditioned on the cognate receptor density.
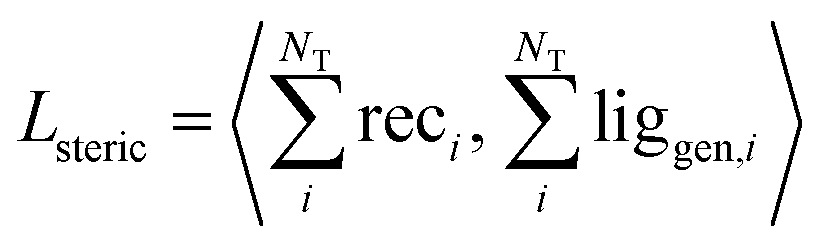 | (7) |
We validated this as a measure of steric clash by checking empirically that real protein–ligand complexes did not have density overlap, owing to our use of a density kernel with a relatively small, fixed atomic radius. We combined the three loss terms with weights into the final loss function like so:
| L = λreconLrecon + λKLLKL + λstericLsteric | (8) |
The loss weights were initialized at λrecon = 4.0, λKL = 0.1, and λsteric = 1.0, though the KL divergence loss weight was gradually ramped up to 1.6 over 200![[thin space (1/6-em)]](https://www.rsc.org/images/entities/char_2009.gif) 000 iterations, starting at iteration 450000. The model was trained using RMSprop with learning rate 10−5 for 1000000 iterations with a batch size of 8.
000 iterations, starting at iteration 450000. The model was trained using RMSprop with learning rate 10−5 for 1000000 iterations with a batch size of 8.
2.6. Training data set
The CrossDocked2020 data set is a massive collection of small molecules docked into cognate and non-cognate receptors.49 An initial set of 18450 bound protein–ligand crystal structures were clustered by pocket similarity and then input to a combinatorial docking procedure. Each ligand was re-docked to its known receptor and cross-docked to every other receptor with a similar pocket. Though noisier than crystallized or re-docked poses, cross-docking greatly increases the amount of training data and captures the distribution of structures that are typically used in drug discovery. The CrossDocked2020 data set has cross-validation splits based on pocket similarity. We used the first split to construct our training and test data sets. We omitted any poses that had root-mean-squared deviation (RMSD) greater than 2 Å from the crystal pose of the ligand in its cognate receptor. We also omitted molecules that could not be sanitized with RDkit.50
2.7. Test target selection
We randomly selected ten targets from the CrossDocked2020 test set to evaluate our model. Each target came from a different pocket cluster, and we only considered targets with at least five unique ligands. We used the top-ranked docked pose of each ligand in the set. The test targets and ligands are shown in Table 2.| PBD ID | Ligand IDs | Num. ligands |
|---|---|---|
| 2ah9 | bgn, udp, udh, cto, ud2, upg | 6 |
| 5lvq | aly, 5wv, 5wz, 2lx, 5ws, 5wu, 2qc, 78y,5wy, 5x0, 5wt, p2l, 82i, 5wx | 14 |
| 5g3n | x28, oap, 8in, 6in, u8d, bhp, i3n, gel | 8 |
| 1u0f | g6p, 6pg, s6p, der, f6p, a5p | 6 |
| 4bnw | 36k, nkh, 36i, j2t, fxe, q7u, 3x3, 9kq, 36p,8m5, 34x, 36e, 36g | 13 |
| 4i91 | cpz, 85d, cae, sne, tmh, 3v4, 82s | 7 |
| 2ati | avf, ave, ihu, 055, 25d, mrd, avd | 7 |
| 2hw1 | tr4, lj9, a4j, tr2, anp, a4g, a3y, a3j, quz,a1y, a2j | 11 |
| 1bvr | xt5, tcu, 3kx, 3ky, 2tk, i4i, uud, geq, 665,nai, nad | 11 |
| 1zyu | adp, skm, anp, acp, s3p, dhk, k2q | 7 |
2.8. Sampling methods
Our model has two distinct sampling modes called posterior and prior sampling. The difference is whether the generative process is biased towards a particular real protein–ligand interaction, or if it is only based on the conditional receptor. With posterior sampling, a real protein–ligand complex is encoded into the latent variable parameters before drawing samples. In contrast, prior sampling draws latent vectors from a standard normal distribution, so it has no intentional bias towards a specific real ligand. Using either method, the latent vectors are combined with the conditional receptor encoding before decoding an output ligand density. The known ligand for the conditional receptor is called the reference molecule, which is the same molecule provided to the input encoder for posterior sampling.We investigated different levels of sampling variance through a setting called the variability factor, denoted λvar. This parameter scales the standard deviations used to sample the latent space:
| z′ = μ + λvarσz | (9) |
We also created a technique for controlling of the amount of bias towards the reference molecule. Instead of using either the posterior or prior distribution, we can sample distributions whose parameters are linearly interpolated between those of the prior and posterior according to a bias factor, referred to as λbias here:
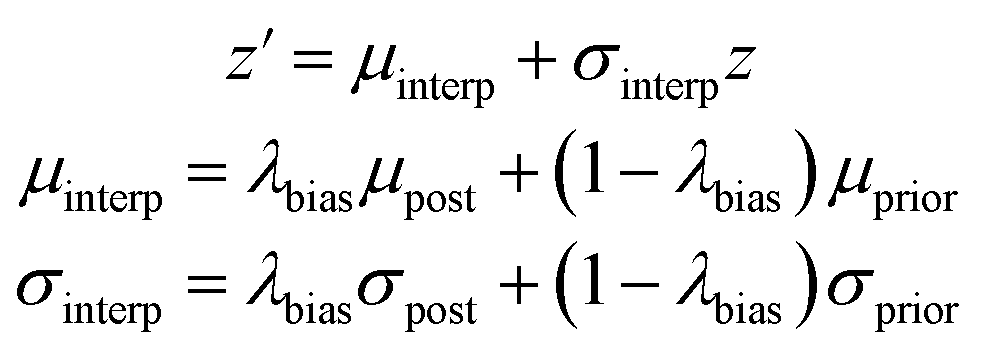 | (10) |
For every sampling method that we evaluated, we generated 100 samples for each protein–ligand complex in the test set.
2.9. Evaluation metrics
We measured the validity, novelty, and uniqueness of the molecules generated from our model, which were defined as follows: a molecule is valid if it consists of a single connected fragment and is able to be sanitized by RDkit, which checks valency constraints and attempts to kekulize aromatic bonds. A molecule is novel if its canonical SMILES string was not in the training set. A molecule is unique if its canonical SMILES string was not generated already in the course of test evaluations. We also relaxed the internal bond lengths and angles of each generated molecule in the context of the binding site by Universal Force Field (UFF) minimization.51 We measured the internal energy and root-mean-squared-deviation (RMSD) of the molecules via UFF minimization. Both real and generated molecules then underwent Vina minimization and scoring with respect to the receptor. Lastly, we estimated the binding affinity of the minimized structures using an ensemble of CNN scoring functions that were trained on the CrossDocked2020 data set. The Vina minimization and CNN affinity prediction were performed using gnina, a deep learning-based molecular docking program.93. Results
3.1. Properties of generated molecules
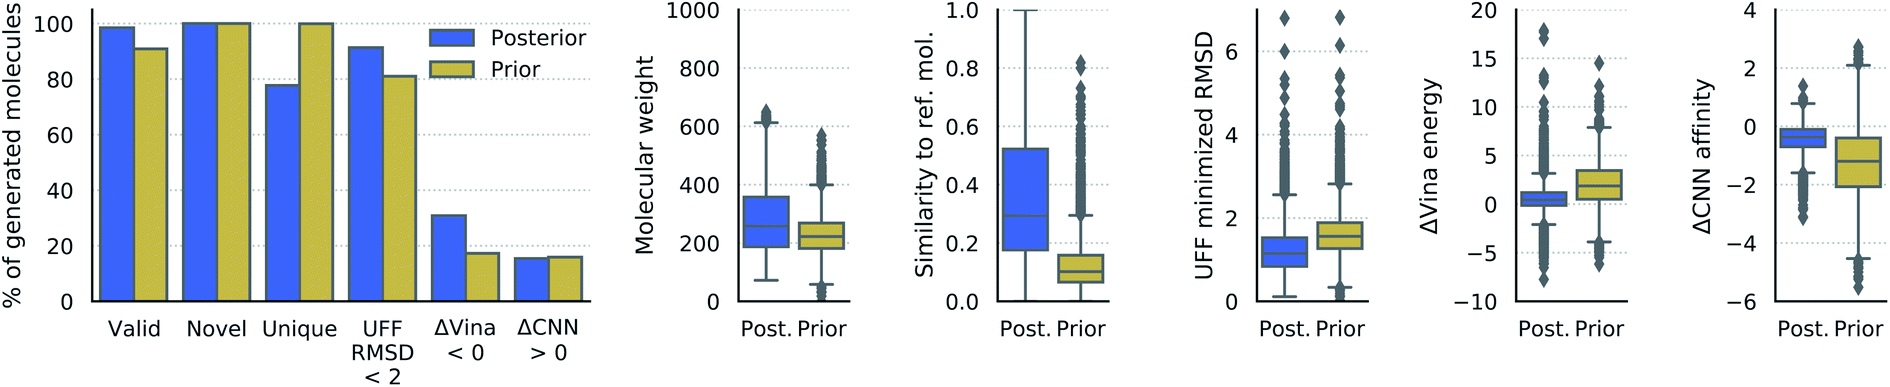 | ||
| Fig. 3 Properties of generated molecules. The percent of generated molecules that were valid, novel, unique, moved less than 2 Å RMSD during UFF minimization, had lower Vina energy, or had higher CNN predicted affinity than the reference molecule. These metrics are reported separately for molecules from posterior and prior sampling. Also shown are the distributions of molecular weight, Tanimoto fingerprint similarity, RMSD from UFF minimization, difference in Vina energy, and difference in CNN affinity. The fingerprint similarity, difference in Vina energy, and difference in CNN affinity were computed with respect to the reference molecule (lower ΔVina energy is better, higher ΔCNN affinity is better). | ||
3.2. Controlling sampling variability and bias
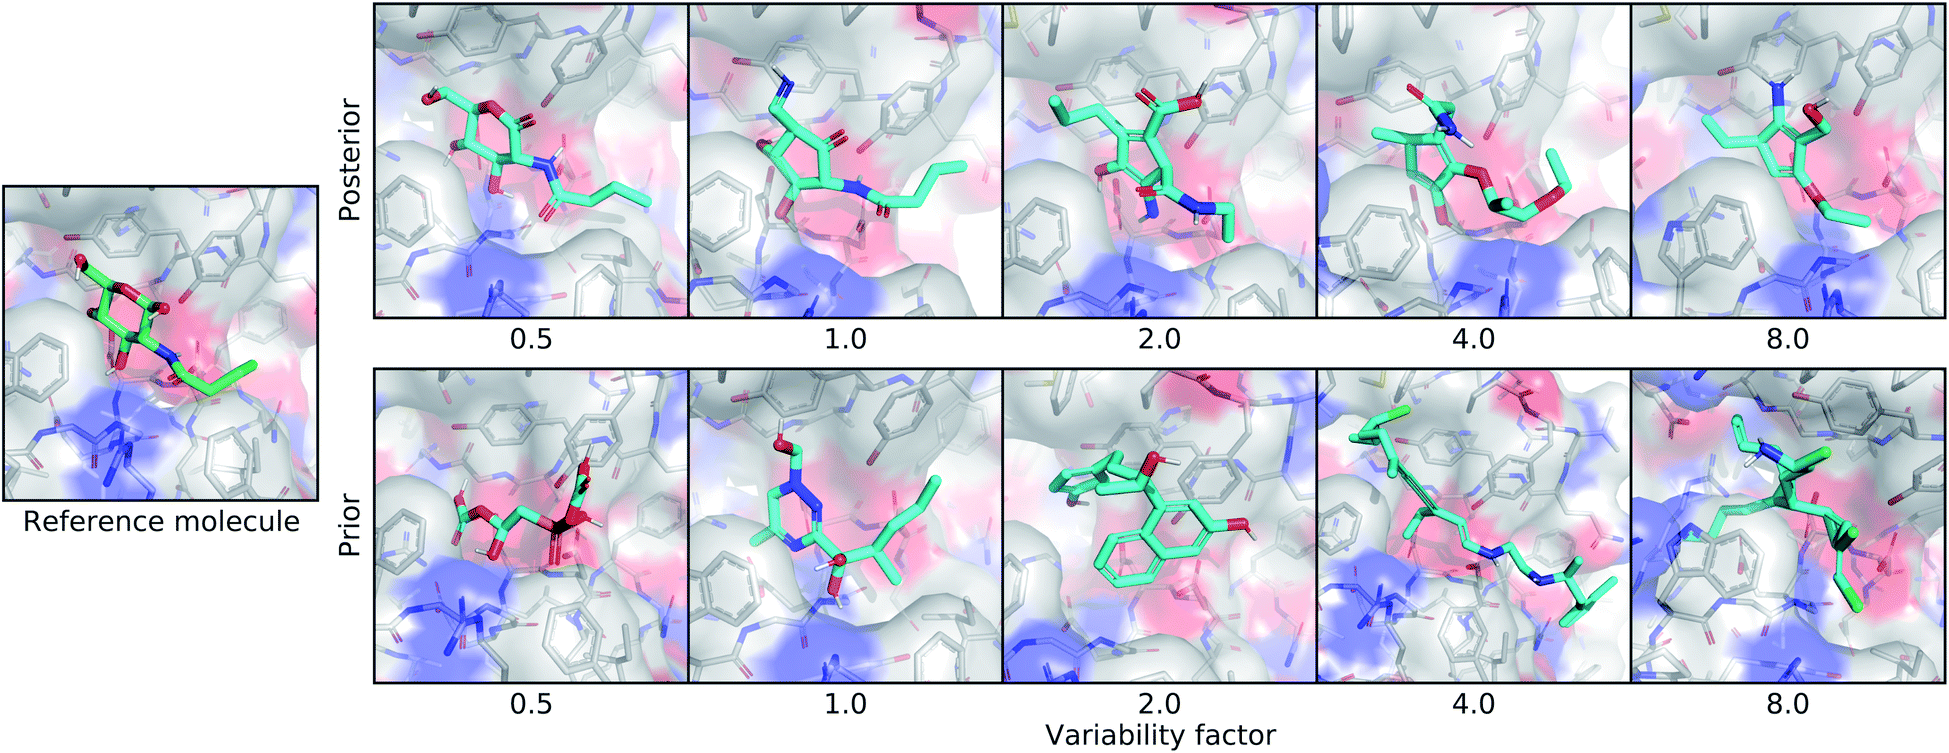 | ||
| Fig. 4 Controlling the variability of generated molecules. This figure depicts the effect of sampling molecules using different multipliers on the standard deviation of the latent distribution. The leftmost image shows the real ligand that was input to the model for posterior sampling. The first row shows posterior molecules sampled using different variability factors. The second row shows prior samples with different variability factors. | ||
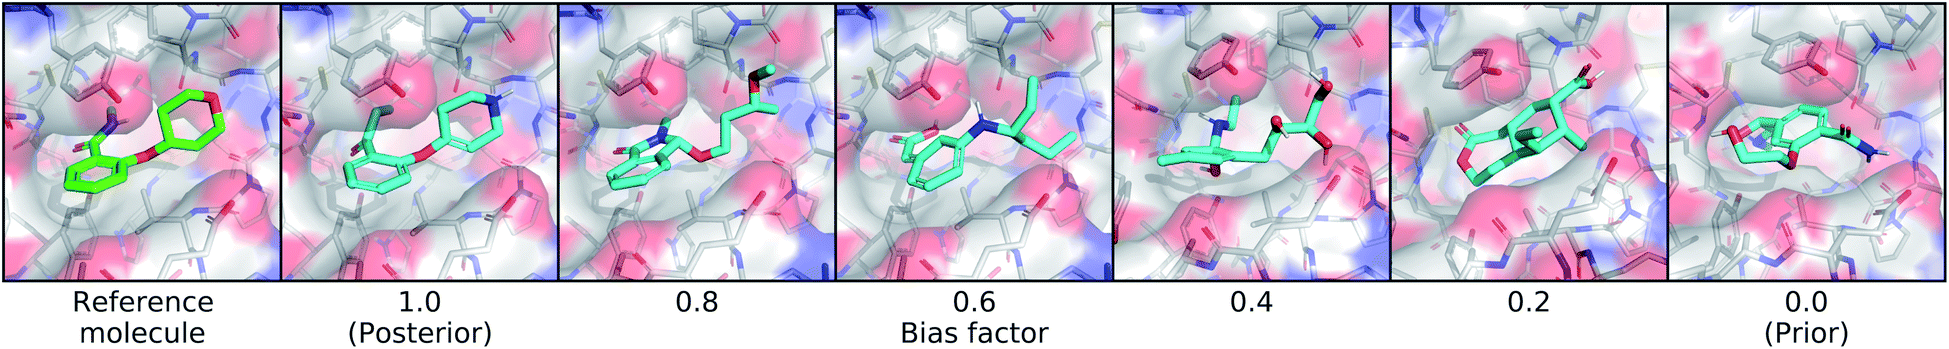 | ||
| Fig. 5 Controlling bias towards the reference molecule. This figure shows the effect of sampling molecules from latent distributions that interpolate between the posterior and prior. On the far left is the real molecule that was used to define the posterior distribution, followed by molecules sampled using different bias factors. A bias a factor of 1.0 indicates the full posterior distribution and 0.0 indicates the full prior distribution. | ||
3.3. Conditioning on mutated receptors
To test the extent that our model uses the conditional receptor when generating molecules, we compared molecules generated from the same reference ligand, but conditioning the generative process on mutated versions of the receptor. Then we compared the molecular similarity, difference in Vina energy, and difference in CNN affinity with respect to the reference molecule. The Vina energy and predicted affinity were calculated using the conditional (i.e. mutant) receptor in this evaluation, for both real and generated molecules. Therefore, these metrics can be used to determine whether the model takes the conditional receptor structure into account or if it generates similar molecules regardless.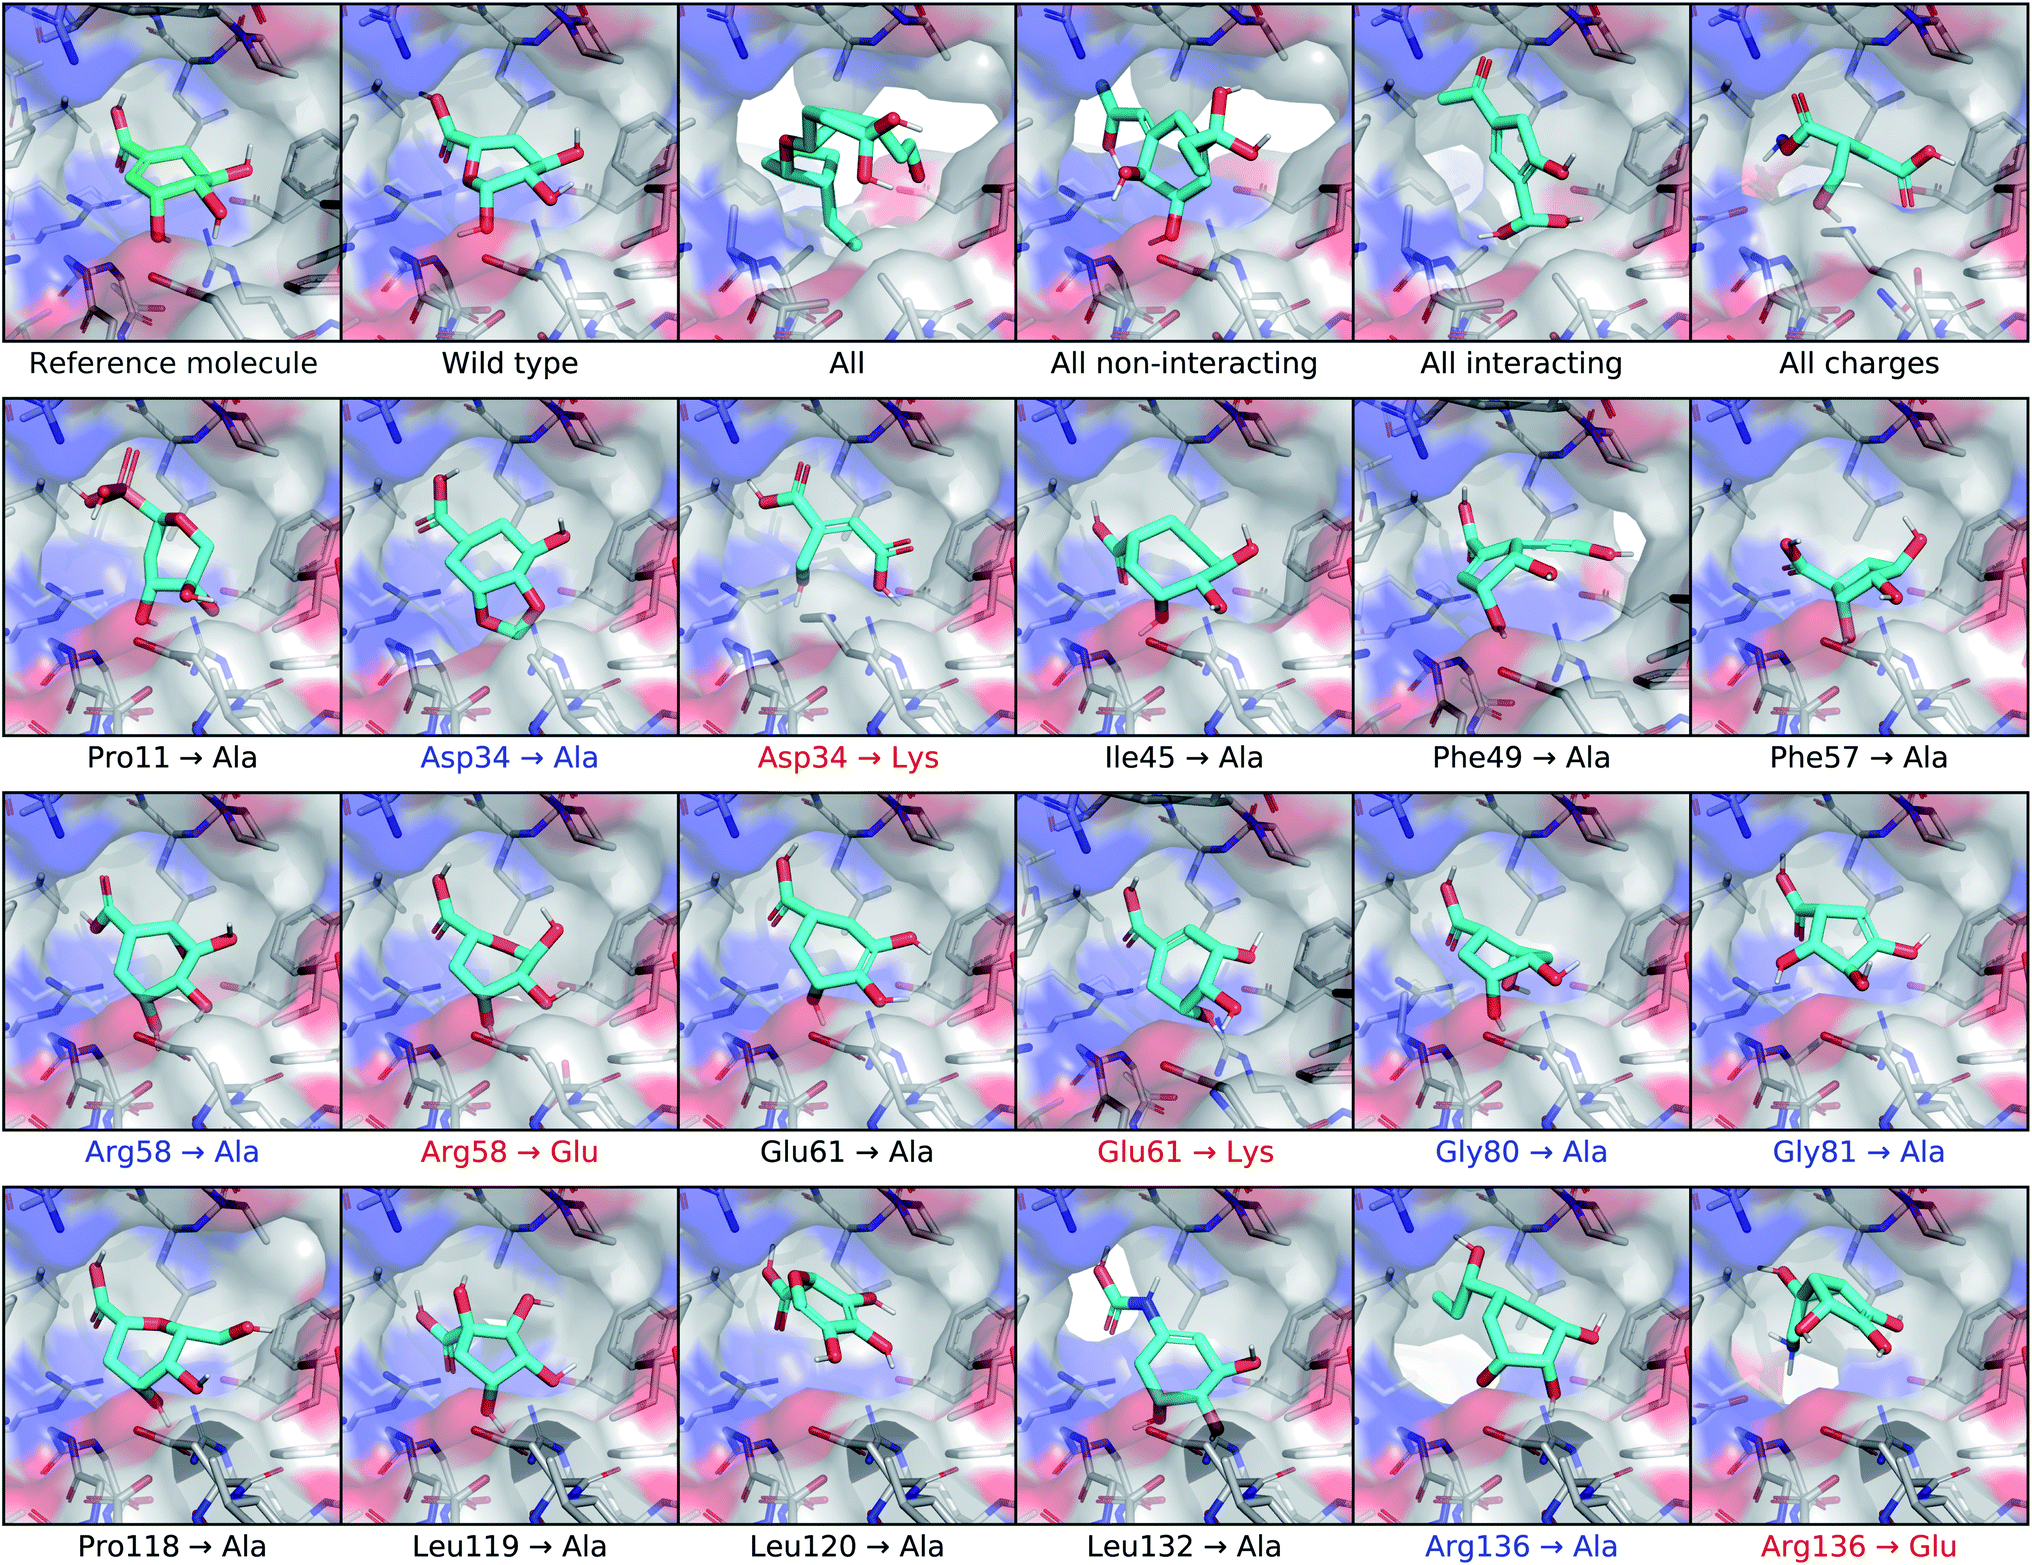 | ||
| Fig. 6 Conditioning generated molecules on shikimate kinase mutants. This figure displays posterior molecules that were generated using shikimate as the input ligand, shown in the top left corner. They were each conditioned on mutated versions of the shikimate kinase receptor. After the reference molecule, the first row shows molecules generated from the cognate receptor (wild type) and four different multi-residue mutants. The next three rows show molecules conditioned on receptors with different single-residue mutations. The mutations highlighted in blue involve residues identified in previous work as making important binding interactions with shikimate. Mutations that inverted the charge of the residue are highlighted in red. | ||
For posterior molecules, the distributions of molecular similarity and change in predicted affinity were significantly different for each of the multi-residue mutations and several single-residue mutations. Modifying the interacting residue Arg136 caused significant differences in all three metrics. Mutating Asp34 to alanine significantly decreased the similarity and increased the change in predicted affinity, but did not decrease the change in Vina energy. Mutating Arg58 to alanine resulted in no significant differences. Interestingly, inverting the charge of either Arg58 or Asp34 only caused significant differences in the molecular similarity, but did not improve the change in Vina energy or predicted affinity. It was also unexpected that mutating the non-interacting residue Phe49 caused significant differences in all three metrics.
We tested for differences in the property distributions of prior molecules generated from mutant receptors, shown in Fig. S14,† in the same way. There were no significant differences in molecular similarity, which was expected since prior molecules are not biased towards the reference molecule. However, there were significant improvements in change in Vina energy and CNN affinity for all multi-residue and Arg136 mutants. Replacing Asp34 or Arg58 with alanine caused significantly higher changes in predicted affinity, but not lower Vina energy. Inverting the charge of Asp34 or Arg58 lead to significantly lower change in Vina energy, but only increased the change in predicted affinity for Arg58.
3.4. Latent space interpolation
We explored the latent space of our model further through interpolation between different known ligands of shikimate kinase. Our test set contained seven different binders for this target, four of which were bound at the shikimate active site. We encoded each of these four ligands with our model to obtain posterior latent vectors, then performed a spherical interpolation in latent space passing through each latent vector, and decoded molecules along the resulting latent trajectory. Each latent vector was decoded using the conditional information from the shikimate kinase receptor, and the center of the conditional grids were interpolated smoothly between the real ligand centers. The resulting interpolation can be viewed in Fig. 7.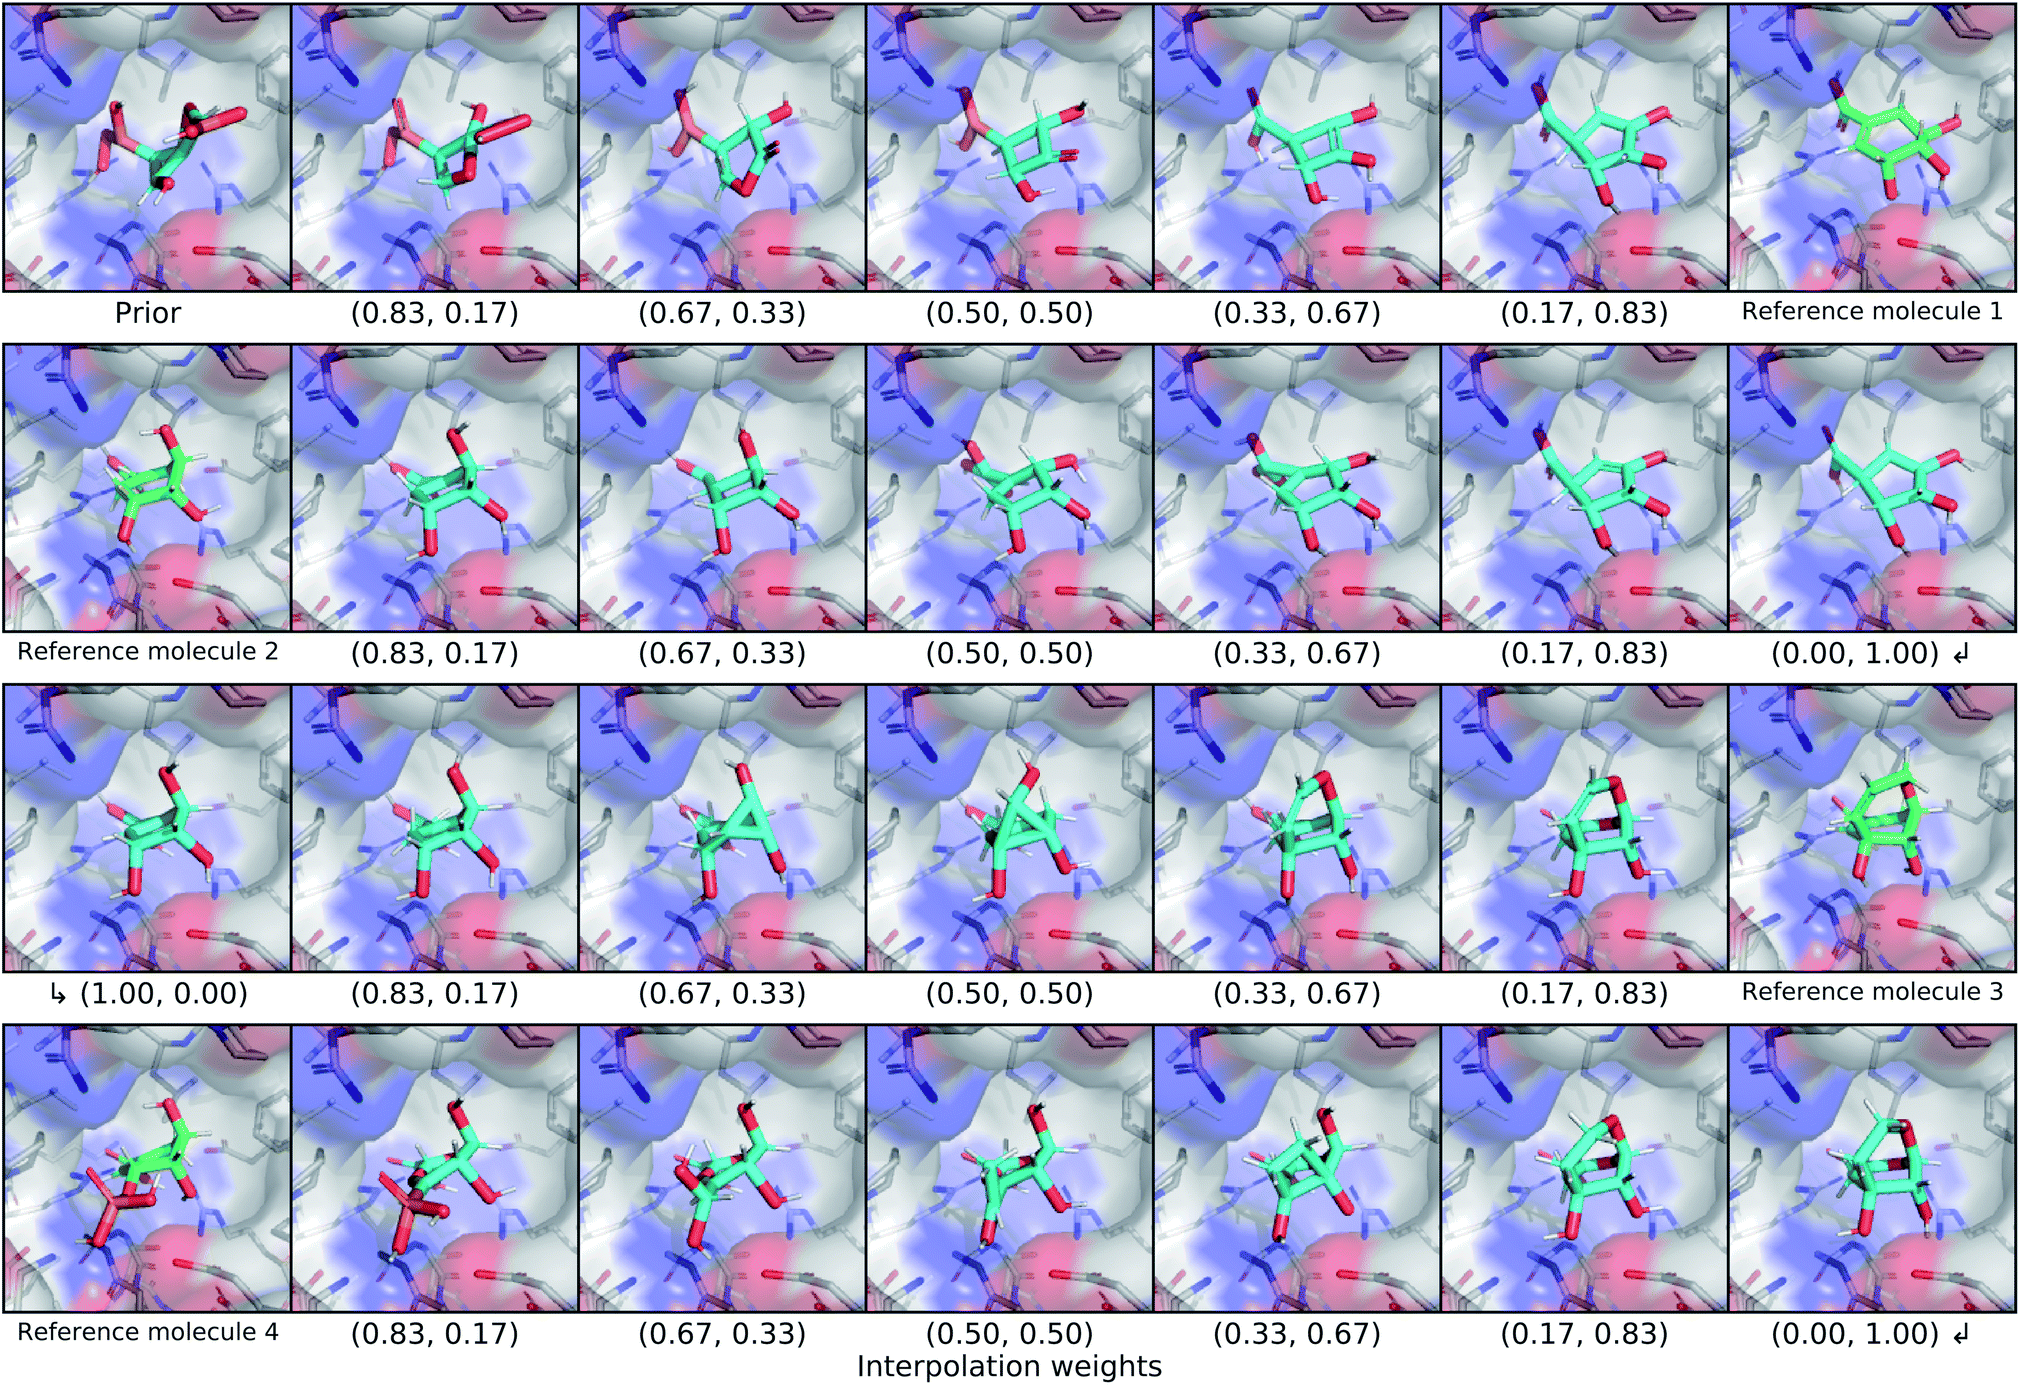 | ||
| Fig. 7 Latent interpolation between shikimate kinase ligands. This figure depicts a series of spherical interpolations in latent space between four different known actives for shikimate kinase. Starting with a prior molecule, each row displays an interpolation to the next ligand in the sequence, with the real molecule shown at the end of the row. The interpolated molecules are labelled with the weights that were used to combine the two endpoints of the latent interpolation. The molecules in this graphic were not minimized with any force field. | ||
The initial prior molecule was quite dissimilar from the endpoint of the first interpolation (reference molecule 1), but the intermediate steps resembled each endpoint. The molecule halfway between them has three hydroxyl groups bound to an aliphatic ring, but one phosphate was retained from the prior molecule in place of the carboxylic acid of reference molecule 1. The next endpoint (reference molecule 2) was extremely similar to the first, which was reflected in the interpolation between them. The conserved atoms smoothly moved through space except for an abrupt change in chirality at one of the ring carbons. A smooth translation of this carbon would have resulted in geometry with a different hybridization state and bond orders, so this sudden chiral shift better maintains the chemical similarity to the endpoints. The third endpoint (reference molecule 3) had a slightly different scaffold, but similar functional groups. The trajectory passed through a few strained molecules with small rings that have high overall shape similarity. The final interpolation gradually transformed the newly added ring of reference molecule 3 into an alkyl branch that then became a diol before finally ending at the phosphate group of reference molecule 4.
4. Discussion
We have demonstrated for the first time the ability to generate three dimensional molecules conditional on receptor binding pockets with deep learning. Over 90% of the generated molecules were valid, novel, and unique, though these metrics are insufficient to evaluate the quality of 3D molecular conformations. For this, we highlight the fact that over 80% of the generated molecules moved less than 2 Å RMSD when minimized with UFF, which provides an indication of their energetic stability within the binding site. To further emphasize the potential utility of our model for discovering active molecules, a significant number of generated molecules had lower Vina energy and higher predicted binding affinity for the receptor than the reference molecule.The generated molecules tended to have more strain than real molecules which is why we relaxed their internal bond lengths and angles with UFF. This is probably due to the lack of explicit bond information used by the model, which instead relies only on the relative positions of local density maxima to determine atom locations. Small differences in the generated density can alter the position of a single atom, which can translate into disproportionately high energy. One promising avenue for future work is to integrate an energetic term into the loss so that the model is directly trained to produce stable molecules. This would require the ability to differentiate through the atomic coordinates, which is easier with an atomistic representation than atomic density grids. We are currently exploring a multi-modal approach that combines density grids with 3D molecular graphs to learn both global shape and inter-atomic features.55
We successfully showed that our generative model conditions its output on the receptor structure. We qualitatively and statistically verified that the model produced chemically relevant modifications in the generated molecules when conditioned on shikimate kinase mutants. All multi-residue mutations caused significant changes in the properties of generated molecules, and some of the important single-residue mutations did as well. Modifying Arg136 caused significant changes in all relevant properties we assessed, for both posterior and prior molecules. There were some differences between what residues were reported in the literature as important for binding compared with the mutations that caused changes in our model's output. For instance, Arg58 mutations did not tend to cause significant changes, even though it was described as a hydrogen bond participant. Phe49 mutations had a significant impact on posterior molecules even though this residue was not described as interacting with shikimate. It was also surprising that inverting charges did not cause more drastic changes to the generated molecules. This could be due to inconsistent charges and protonation states in the training data.
We also found that the generation of molecules using atomic density grids is quite sensitive to the hyperparameters of the grid representation. Augmentation of training with random rotations was crucial for counteracting the coordinate-frame dependency of the density grids. There was also an interaction between the grid resolution and atomic radius used in the density kernel. When several atoms are nearby in the same grid channel (e.g. aromatic carbon rings), the density of each atom can overlap and produce a peak in the middle of the ring or bond. This makes it difficult to resolve the individual atoms through atom fitting. By reducing the radius of the density kernel, it becomes easier to distinguish atoms in close proximity at a given grid resolution, thereby producing more accurate and chemically realistic structures. Optimization of these grid settings had a significant impact on the quality of the generated molecules.
In future work, we will experiment with training setups that emphasize the use of the conditional receptor. One interesting augmentation would be to apply different random rotations on the input branch and conditional branch, then train the model to generate ligands in the conditional coordinate frame. This would encourage a coordinate frame-invariant latent space and enforce reliance on the structural characteristics of the conditional receptor to determine the generated ligand orientation. Another enhancement would be to train using different receptors within the same binding pocket cluster of the CrossDocked2020 set in the input and conditional branch. A more challenging future direction would be to provide higher-RMSD ligand poses as the input to the model and train using the lowest-RMSD pose as the label, essentially performing instantaneous minimization for docking.
We hope that this work accelerates the usage of 3D protein structure in molecular generative models. There is vast potential for further development of this approach. To enable the reproduction and extension of this work, we provide open access to all data, code, and model weights.
Data availability
The data sets, code, and model weights used in this work are available for download at https://github.com/mattragoza/liGAN.Author contributions
Matthew Ragoza: conceptualization, software, resources, data curation, methodology, investigation, validation, visualization, formal analysis, writing – original draft, project administration.Tomohide Masuda: conceptualization, software, investigation, methodology, resources, validation, writing – review & editing.David Ryan Koes: conceptualization, software, resources, investigation, validation, writing – review & editing, project administration, funding acquisition.Conflicts of interest
There are no conflicts to declare.Acknowledgements
This work is supported by R01GM108340 from the National Institute of General Medical Sciences, is supported in part by the University of Pittsburgh Center for Research Computing through the resources provided, and used the Extreme Science and Engineering Discovery Environment (XSEDE), which is supported by National Science Foundation grant number ACI-1548562 through the Bridges GPU-AI resource allocation TG-MCB190049.References
- T. Cheng, Q. Li, Z. Zhou, Y. Wang and S. H. Bryant, AAPS J., 2012, 14, 133–141 CrossRef CAS PubMed.
- H. M. Berman, J. Westbrook, G. G. Zukang Feng, T. N. Bhat, H. Weissig, I. N. Shindyalov and P. E. Bourne, Nucleic Acids Res., 2000, 28, 235–242 CrossRef CAS PubMed.
- J. Jumper, R. Evans, A. Pritzel, T. Green, M. Figurnov, O. Ronneberger, K. Tunyasuvunakool, R. Bates, A. Žídek, A. Potapenko, A. Bridgland, C. Meyer, S. A. A. Kohl, A. J. Ballard, A. Cowie, B. Romera-Paredes, S. Nikolov, R. Jain, J. Adler, T. Back, S. Petersen, D. Reiman, E. Clancy, M. Zielinski, M. Steinegger, M. Pacholska, T. Berghammer, S. Bodenstein, D. Silver, O. Vinyals, A. W. Senior, K. Kavukcuoglu, P. Kohli and D. Hassabis, Nature, 2021, 596, 583–589 CrossRef CAS PubMed.
- I. Wallach, M. Dzamba and A. Heifets, arXiv preprint:1510.02855 [cs.LG], 2015.
- M. Ragoza, J. Hochuli, E. Idrobo, J. Sunseri and D. R. Koes, J. Chem. Inf. Model., 2017, 57, 942–957 CrossRef CAS PubMed.
- J. Jiménez, M. Škalič, G. Martínez-Rosell and G. D. Fabritiis, J. Chem. Inf. Model., 2018, 58, 287–296 CrossRef PubMed.
- Y. Li, M. A. Rezaei, C. Li, X. Li and D. Wu, arXiv preprint:1912.00318 [q-bio.QM], 2019.
- M. Ragoza, L. Turner and D. R. Koes, arXiv preprint:1710.07400 [stat.ML], 2017.
- A. T. McNutt, P. Francoeur, R. Aggarwal, T. Masuda, R. Meli, M. Ragoza, J. Sunseri and D. R. Koes, J. Cheminf., 2021, 13, 1–20 Search PubMed.
- J. Gomes, B. Ramsundar, E. N. Feinberg and V. S. Pande, arXiv preprint:1703.10603 [cs.LG], 2017.
- K. T. Schütt, P.-J. Kindermans, H. E. Sauceda, S. Chmiela, A. Tkatchenko and K.-R. Müller, arXiv preprint:1706.08566 [stat.ML], 2017.
- R. Gómez-Bombarelli, J. N. Wei, D. Duvenaud, J. M. Hernández-Lobato, B. Sánchez-Lengeling, D. Sheberla, J. Aguilera-Iparraguirre, T. D. Hirzel, R. P. Adams and A. Aspuru-Guzik, ACS Cent. Sci., 2016, 4, 268–276 CrossRef PubMed.
- M. H. S. Segler, T. Kogej, C. Tyrchan and M. P. Waller, ACS Cent. Sci., 2017, 4, 120–131 CrossRef PubMed.
- P. Ertl, R. Lewis, E. Martin and V. Polyakov, arXiv preprint:1712.07449 [cs.LG], 2018.
- D. Weininger, J. Chem. Inf. Comput. Sci., 1988, 28, 31–36 CrossRef CAS.
- M. Olivecrona, T. Blaschke, O. Engkvist and H. Chen, J. Cheminf., 2017, 9, 1–14 Search PubMed.
- G. L. Guimaraes, B. Sanchez-Lengeling, C. Outeiral, P. L. C. Farias and A. Aspuru-Guzik, arXiv preprint:1705.10843 [stat.ML], 2018.
- M. J. Kusner, B. Paige and J. M. Hernández-Lobato, arXiv preprint:1703.01925 [stat.ML], 2017.
- H. Dai, Y. Tian, B. Dai, S. Skiena and L. Song, arXiv preprint:1802.08786 [cs.LG], 2018.
- J. Gilmer, S. S. Schoenholz, P. F. Riley, O. Vinyals and G. E. Dahl, arXiv preprint:1704.01212 [cs.LG], 2017.
- M. Simonovsky and N. Komodakis, arXiv preprint:1802.03480 [cs.LG], 2018.
- W. Jin, R. Barzilay and T. Jaakkola, arXiv preprint:1802.04364 [cs.LG], 2019.
- Q. Liu, M. Allamanis, M. Brockschmidt and A. L. Gaunt, arXiv preprint:1805.09076 [cs.LG], 2019.
- B. Samanta, A. De, G. Jana, P. K. Chattaraj, N. Ganguly and M. Gomez-Rodriguez, arXiv preprint:1802.05283 [cs.LG], 2019.
- Y. Kwon, J. Yoo, Y.-S. Choi, W.-J. Son, D. Lee and S. Kang, J. Cheminf., 2019, 11, 1–10 Search PubMed.
- N. D. Cao and T. Kipf, arXiv preprint:1805.11973 [stat.ML], 2018.
- J. You, B. Liu, R. Ying, V. Pande and J. Leskovec, arXiv preprint:1806.02473 [cs.LG], 2019.
- N. W. A. Gebauer, M. Gastegger and K. T. Schütt, arXiv preprint:1810.11347 [stat.ML], 2018.
- N. W. A. Gebauer, M. Gastegger and K. T. Schütt, arXiv preprint:1906.00957 [stat.ML], 2020.
- Y. Li, J. Pei and L. Lai, arXiv preprint:2104.08474 [q-bio.QM], 2021.
- F. Imrie, A. R. Bradley, M. van der Schaar and C. M. Deane, J. Chem. Inf. Model., 2020, 60, 1983–1995 CrossRef CAS PubMed.
- M. Hoffmann and F. Noé, arXiv preprint:1910.03131 [cs.LG], 2019.
- E. Mansimov, O. Mahmood, S. Kang and K. Cho, Sci. Rep., 2019, 9, 1–13 Search PubMed.
- G. N. C. Simm and J. M. Hernández-Lobato, arXiv preprint:1909.11459 [stat.ML], 2020.
- D. Kuzminykh, D. Polykovskiy, A. Kadurin, A. Zhebrak, I. Baskov, S. Nikolenko, R. Shayakhmetov and A. Zhavoronkov, Mol. Pharmaceutics, 2018, 15, 4378–4385 CrossRef CAS PubMed.
- M. Skalic, J. Jiménez, D. Sabbadin and G. D. Fabritiis, J. Chem. Inf. Model., 2019, 59, 1205–1214 CrossRef CAS PubMed.
- M. Ragoza, T. Masuda and D. R. Koes, arXiv preprint:2010.08687 [q-bio.QM], 2020.
- M. Skalic, D. Sabbadin, B. Sattarov, S. Sciabola and G. D. Fabritiis, Mol. Pharmaceutics, 2019, 16, 4282–4291 CrossRef CAS PubMed.
- M. Xu, T. Ran and H. Chen, ChemRxiv, 2020 DOI:10.26434/chemrxiv.13498332.v1.
- F. Imrie, T. E. Hadfield, A. R. Bradley and C. M. Deane, Chem. Sci., 2021, 12, 14577–14589 RSC.
- T. Masuda, M. Ragoza and D. R. Koes, arXiv preprint:2010.1444 [physics.chem-ph], 2020.
- J. Sunseri and D. R. Koes, J. Chem. Inf. Model., 2020, 60, 1079–1084 CrossRef CAS PubMed.
- The Open Babel Package, version 3.1.1, https://openbabel.org, accessed May 29, 2020 Search PubMed.
- N. M. O'Boyle, M. Banck, C. A. James, C. Morley, T. Vandermeersch and G. R. Hutchison, J. Cheminf., 2011, 3, 1–14 Search PubMed.
- K. Sohn, H. Lee and X. Yan, Advances in Neural Information Processing Systems, 2015 Search PubMed.
- K. He, X. Zhang, S. Ren and J. Sun, arXiv preprint:1512.03385, 2015.
- O. Ronneberger, P. Fischer and T. Brox, U-Net: Convolutional Networks for Biomedical Image Segmentation, 2015 Search PubMed.
- T. Miyato, T. Kataoka, M. Koyama and Y. Yoshida, arXiv preprint:1802.05957, 2018.
- P. G. Francoeur, T. Masuda, J. Sunseri, A. Jia, R. B. Iovanisci, I. Snyder and D. R. Koes, J. Chem. Inf. Model., 2020, 60, 4200–4215 CrossRef CAS PubMed.
- RDKit: Open-Source Cheminformatics Software, https://www.rdkit.org, accessed May 28, 2020 Search PubMed.
- A. K. Rappe, C. J. Casewit, K. S. Colwell, W. A. Goddard III and W. M. Skiff, J. Am. Chem. Soc., 1992, 114, 10024–10035 CrossRef CAS.
- R. G. Bickerton, G. V. Paolini, J. Besnard, S. Muresan and A. L. Hopkins, Nat. Chem., 2012, 4, 90–98 CrossRef PubMed.
- J. Gan, Y. Gu, Y. Li, H. Yan and X. Ji, Biochemistry, 2006, 45, 8539–8545 CrossRef CAS PubMed.
- J. D. Coracini and W. F. J. de Azevedo, Curr. Med. Chem., 2014, 21, 592–604 CrossRef CAS PubMed.
- M. Arcidiacono and D. R. Koes, arXiv preprint:2109.15308 [q-bio.QM], 2021.
Footnote |
| † Electronic supplementary information (ESI) available. See DOI: 10.1039/d1sc05976a |
| This journal is © The Royal Society of Chemistry 2022 |