 Open Access Article
Achieving a blue-excitable yellow-emitting Ca-LMOF phosphor via water induced phase transformation†
Zhao-Feng
Wu
ab,
Bin
Tan
b,
Zhi-Hua
Fu
b,
Ever
Velasco
a,
Xing-Wu
Liu
*c,
Simon J.
Teat
 d,
Kun
Zhu
a,
Kai
Xing
e,
Xiao-Ying
Huang
 *b and
Jing
Li
 *a
*a
aDepartment of Chemistry and Chemical Biology, 123 Bevier Rd., Piscataway, NJ 08854, USA. E-mail: jingli@rutgers.edu
bFujian Institute of Research on the Structure of Matter, The Chinese Academy of Sciences, Fuzhou, Fujian 350002, P. R. China. E-mail: xyhuang@fjirsm.ac.cn
cSynfuels China Technology Co. Ltd., 1 Leyuan Second South Street, Yanqi Development Zone, Huairou, Beijing, 101407, P. R. China. E-mail: liuxingwu@sxicc.ac.cn
dAdvanced Light Source, Lawrence Berkeley National Laboratory, 1 Cyclotron Road, Berkeley, CA 94720, USA
eHarbin Institute of Technology, No. 92 Xidazhi Street, Nangang District, Harbin, 150006, P. R. China
First published on 28th December 2021
Abstract
Luminescent metal–organic frameworks (LMOFs) with diverse structural features and promising fluorescence-based applications have attracted wide attention in the past two decades. In this work, a LMOF with the formula [Ca4(tcbpe-F)2(H2O)3] (1, LMOF-411) has been constructed from calcium (Ca) and 1,1,2,2-tetrakis(4-(4-carboxyphenyl)phenyl)ethene (H4tcbpe-F). Compound 1 features a three-dimensional framework with a 10-nodal net topology. Due to the relatively high hydration energy of Ca2+, compound 1 readily transforms into a new phase formulated as [Ca(H2tcbpe-F)(H2O)2] (1′) upon exposure to water. Combining experimental characterization and theoretical calculations, we elucidated the mechanism of H2O-induced phase transition from 1 to 1′. Notably, the water induced phase transformation can be detected visibly from the change in luminescence, which originates from the fluorescent linker. Compound 1 emits green light (λem = 490 nm) under UV excitation, while compound 1′ emits bright yellow light (λem = 550 nm) under blue excitation (450 nm). Compound 1′ represents the first Ca based LMOF yellow phosphor and its luminescence quantum yield reaches 68%. It can be coated directly onto a commercial blue light-emitting-diode (LED) chip to fabricate a white LED (WLED).
1. Introduction
Due to various advantages over traditional incandescent lighting systems e.g., low power consumption, high efficiency, and long lifetime, white light-emitting diodes (WLEDs) have been regarded as the new generation of lighting devices and have gained a sizable share of the global lighting market. The US Department of Energy estimates that 84% of the US lighting market will be made up of LED-based lighting devices by 2030, leading to a reduction of 40% of the lighting energy consumption annually in the United States.1 Currently, the most commonly used cost-effective WLEDs are phosphor-converted WLEDs, which are fabricated by coating a yellow (or multicomponent) phosphor onto a blue LED chip to generate white light.2 The benchmark commercial yellow phosphor is cerium(III)-doped yttrium–aluminium garnet (YAG:Ce3+), which comprises the costly rare-earth elements (REEs) yttrium and cerium.3 Therefore, developing alternative phosphor materials with low cost and high efficiency is imperative.As a comparatively new class of functional materials emerging in the past several decades, luminescent MOFs (LMOFs) have been well developed,4 and some exhibit strong potential for energy-efficient lighting applications, either acting as direct emissive materials or phosphors.5 The majority of white-emitting LMOFs reported to date are based on REEs with metal centred emission or transition metals (e.g., Zn2+ and Cd2+) that incorporate fluorescent guests.5 It should be noted that alkaline earth (AE) metals e.g., Mg2+ and Ca2+, can be used to construct LMOFs with ligand centred fluorescence due to their unique 3d0 electron configuration.6 By assembling fluorescent ligands and AE2+ ions into a framework structure, AE–MOFs with different emission colours can be achieved.7 Taking cost and environmental factors into consideration, the abundant and biologically compatible AE ions are good candidates for the construction of LMOFs for application in WLEDs. Despite these advantages, AE–LMOFs remain under-investigated.
On the other hand, achieving structure-driven functionality in MOFs has always been a hot topic, and high crystallinity makes MOFs a good platform for investigating the structure–functionality relationship. Many methods have been developed towards functionalization in MOFs, including doping hetero metals, modifying organic ligands, and regulating the morphology, to name a few. Generally, the crystal structures of host MOFs remain the same upon such modifications.8 An alternative but more challenging way is based on phase transformation that is induced by external stimuli, e.g., solvent, temperature, pressure and other conditions. This usually leads to severe structural alternations, but in turn the dramatic structural transitions may promote changes in, e.g., magnetic, catalytic, or adsorption properties.9 The important aspect is that the structure and functionality relationship can be investigated by a comparative study of the crystalline structures before and after phase transformation. Nevertheless, achieving tunable functionality in MOFs through phase transformation remains a challenge and examples are comparatively scarce.
Herein, a Ca-MOF formulated as [Ca4(tcbpe-F)2(H2O)3] (1, LMOF-411) based on 1,1,2,2-tetrakis(4-(4-carboxyphenyl)phenyl)ethene (H4tcbpe-F) has been designed and synthesized by solvothermal reactions. The title compound can undergo a water induced phase transformation to afford a 4-fold interpenetrated 3D Ca-MOF, namely, [Ca(H2tcbpe-F)(H2O)2] (1′). The extensive structural change leads to some unique and beneficial features. On one hand, 1′ shows excellent structural tolerance under harsh conditions compared with 1, making it suitable for potential applications. On the other hand, the phase transition results in obvious luminescence changes, red-shifting the green emission of 1 to yellow emission of 1′. The high quantum yield of 68% under blue light of 450 nm excitation makes 1′ the first blue excitable Ca-based MOF yellow phosphor suitable for WLEDs. Theoretical studies together with experimental characterizations making use of SEM, single crystal structure analysis, PXRD, etc., are applied to understand the structural transformation mechanism and the structure–functionality relationship. This work can help to deepen our understanding of the structure–property relationship in MOFs and provide guidance on how to design sensitive stimulus-responding materials with structure-driven properties.
2. Experimental
2.1 Materials and methods
All reagents and chemicals were purchased from commercial sources and used without further purification. The UV-Vis spectra were recorded at room temperature using a PerkinElmer Lambda 900 spectrometer, and a BaSO4 plate was used as a standard (100% reflectance). Inductively coupled plasma (ICP) analyses were performed with an Ultima 2 unit. Powder X-ray diffraction (PXRD) patterns were collected in the angular range of 2θ = 3–35° on a Miniflex II diffractometer using CuKα radiation. The fluorescence spectra of the compounds in the solid state were recorded on a Duetta fluorescence and absorbance spectrometer at 298 K.2.2 Synthetic procedures
2.3 Density functional theory calculations
All calculations were performed at the density functional level of theory with the Vienna ab initio simulation package (VASP). The generalized gradient approximation (GGA) formulated by Perdew, Burke and Ernzerhof (PBE) was employed for the exchange and correlation energy terms because the spin-polarized GGA approximation describes spin-polarized 3d metals such as Fe and related compounds better than the local (spin-polarized) density approximation (LDA). Iterative solutions of the Kohn–Sham equations were done using a plane-wave basis set defined by a kinetic energy cutoff of 400 eV, and the samplings of the Brillouin zone were obtained from the Monkhorst–Pack mesh scheme. A second-order Methfessel–Paxton electron smearing with σ = 0.2 eV was used to ensure accurate energies with errors less than 1 meV per unit cell. The convergence criteria for the electronic self-consistent iterations and forces were set to 10−4 eV and 0.03 eV Å−1, respectively.2.4 Fluorescence and quantum yield (QY) measurements
Photoluminescence (PL) measurements were carried out on a Horiba Duetta fluorescence spectrophotometer. Powder samples were evenly distributed and sandwiched between two glass slides (which do not have emission in the visible range) for room temperature measurements. QY measurements were performed using a C9920-02 absolute quantum yield measurement system (Hamamatsu Photonics) with a 150 W xenon monochromatic light source and 3.3 inch integrating sphere. Sodium salicylate (SS) and YAG:Ce3+ were chosen as the standards with reported QY values of 60% and 95% at excitation energies of 360 and 450 nm, respectively. Their QY values were measured to be 64% and 96%, respectively, and corrections were made based on the reported data.2.5 White LED fabrication
A fine powder sample of 1′ was dispersed in ethanol and the mixture was coated onto a commercial blue chip (bulb type, 455–460 nm, 5 mm chip, 20 mA, and 3 V) to produce a white LED.2.6 X-ray crystallography
Single crystal data of 1 were collected using a D8 goniostat equipped with a Bruker PHOTON100 CMOS detector at the Advanced Light Source (ALS), Lawrence Berkeley National Laboratory, and using synchrotron radiation. The structure was solved by direct methods and refined by full-matrix least-squares on F2 using the Bruker SHELXTL package.11 Detailed crystallographic data and structure-refinement parameters are summarized in Table S1.†3. Results and discussion
3.1 Crystal structure description
Single-crystal X-ray diffraction analyses reveal that compound 1 crystallizes in the space group of P![[1 with combining macron]](https://www.rsc.org/images/entities/char_0031_0304.gif) and features a three dimensional (3D) structure. As shown in Fig. 1, there are four crystallographically independent Ca2+ in 1. Ca(1) is seven coordinated, with five monodentate O atoms from five COO− groups and the remaining two coordinated sites are occupied by one carboxylic group in a chelating coordination mode; meanwhile for the eight coordinated Ca(2) and seven coordinated Ca(3), there are three monodentate O atoms from three COO− groups and four O atoms from two carboxylic groups in a chelating way. The last coordinated site for Ca(2) is occupied by guest molecules. The Ca(4) atom shows a commonly observed octahedral coordination geometry, which is made of four carboxylic monodentate O atoms and two guest molecules. The Ca(1) metal acts as an inversion center to bridge the other three Ca2+ by sharing three carboxylic O atoms to form a unique tetranuclear calcium cluster (see inset of Fig. 1). As far as we are aware, this Ca4 cluster represents an unprecedented type of second building unit (SBU) for Ca-MOFs. The Ca(2) and Ca(3) atoms in the neighboring clusters are connected through carboxylic oxygen in a monodentate way to generate 1D metal oxide chains (Fig. S5a†). The 1D chains further are linked by H4tcbpe-F to form a 3D framework (Fig. 1 and S5b†). All the F groups and terminal water molecules are directed toward the channel (Fig. S5c†). Topology analysis indicates that the title compound features a 10-nodal net topology (Fig. S5d†). In order to better understand the influence of the F group on the phase transition and luminescence, we synthesized isoreticular [Ca4(tcbpe)2(H2O)3] (2, see detailed information in the ESI†) based on H4tcbpe (1,1,2,2-tetrakis(4-(4-carboxyphenyl)phenyl)ethane) without F groups. However, the crystals of 2 were too small to be analyzed by single crystal X-ray diffraction. Instead, its crystal structure is refined by the PXRD method and details are provided in the ESI,† Fig. S2, S6 and S7.†
and features a three dimensional (3D) structure. As shown in Fig. 1, there are four crystallographically independent Ca2+ in 1. Ca(1) is seven coordinated, with five monodentate O atoms from five COO− groups and the remaining two coordinated sites are occupied by one carboxylic group in a chelating coordination mode; meanwhile for the eight coordinated Ca(2) and seven coordinated Ca(3), there are three monodentate O atoms from three COO− groups and four O atoms from two carboxylic groups in a chelating way. The last coordinated site for Ca(2) is occupied by guest molecules. The Ca(4) atom shows a commonly observed octahedral coordination geometry, which is made of four carboxylic monodentate O atoms and two guest molecules. The Ca(1) metal acts as an inversion center to bridge the other three Ca2+ by sharing three carboxylic O atoms to form a unique tetranuclear calcium cluster (see inset of Fig. 1). As far as we are aware, this Ca4 cluster represents an unprecedented type of second building unit (SBU) for Ca-MOFs. The Ca(2) and Ca(3) atoms in the neighboring clusters are connected through carboxylic oxygen in a monodentate way to generate 1D metal oxide chains (Fig. S5a†). The 1D chains further are linked by H4tcbpe-F to form a 3D framework (Fig. 1 and S5b†). All the F groups and terminal water molecules are directed toward the channel (Fig. S5c†). Topology analysis indicates that the title compound features a 10-nodal net topology (Fig. S5d†). In order to better understand the influence of the F group on the phase transition and luminescence, we synthesized isoreticular [Ca4(tcbpe)2(H2O)3] (2, see detailed information in the ESI†) based on H4tcbpe (1,1,2,2-tetrakis(4-(4-carboxyphenyl)phenyl)ethane) without F groups. However, the crystals of 2 were too small to be analyzed by single crystal X-ray diffraction. Instead, its crystal structure is refined by the PXRD method and details are provided in the ESI,† Fig. S2, S6 and S7.†
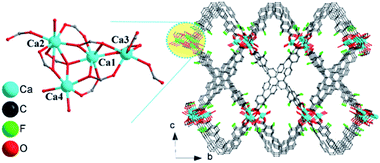 | ||
| Fig. 1 The 3D structure of 1 viewed along the a axis. The inset figure in zoom-in mode is the tetranuclear calcium cluster in 1. Hydrogen atoms are omitted for clarity. | ||
3.2 Water induced phase transformation
As AE2+ ions have comparatively high hydration energy, water molecules often enter the AE–MOF structures either as a terminal ligand or as a free guest. The rich water content in AE–MOFs usually fascinates water related applications such as drug release, luminescence sensing, proton conducting, etc.12 However, the relatively high hydrophilicity of AE–MOFs can also result in poor water stability. To assess the effect of water on the title compound, the as-made sample 1 was immersed in water for 1 hour, and then filtered and air dried. PXRD analysis on the water treated sample indicates the formation of a new phase, suggesting that a structural transition has occurred (Fig. S8†). The morphology of the samples was characterized by SEM. As seen in Fig. 2 and Fig. S9,† the rod-like crystals of 1 with smooth surface have become tiny flakes that stacked on top of each other. Further analysis by IR experiments shows that the IR spectra of the as-made 1 after the water treatment and 1′ (initially found in our previous work)10 are essentially the same (Fig. S10†), confirming that the water treated sample is the pure phase of 1′ and a complete phase transformation was achieved. The isoreticular compound 2 also undergoes the same water induced phase transformation, as confirmed by PXRD and SEM analyses (Fig. S8 and S11†).Further PXRD measurements were conducted to verify whether water is the exclusive external stimulus to induce the phase transition. As shown in Fig. S12a,† the crystal structures of both 1 and 2 are retained after being immersed in a number of common solvents over 24 hours. Crystals of 1 and 2 were also ground into fine powders and pressed into pellets under 10 MPa pressure within minutes, and the PXRD analysis of the pellets confirmed that the structures remain unchanged (Fig. S13†). The as-made samples of 1 and 2 were then placed under variable humidity for one hour at room temperature to monitor possible phase transformation. As seen in Fig. S14 and S15,† the PXRD patterns of the treated samples under 40–90% relative humidity (RH) are maintained the same as that of the as-made samples, indicating that no phase transformation had occurred. Based on the results of these experiments, it is clear that liquid water is required to achieve the complete phase transition of both compounds.
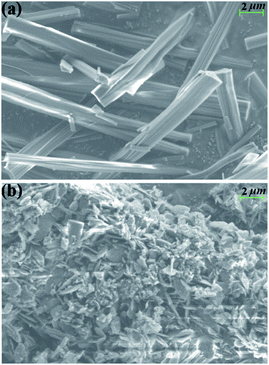
One big advantage of MOF materials is the ease of obtaining their single crystal structures, and as such, the underlying mechanism of phase transition can be well understood through structural analysis. Meanwhile for 1′ only the powdered form could be obtained, and the single crystal structure of isoreticular 2′ based on tcbpe was solved in our previous work,10 and accordingly the structure of 1′ was refined by the PXRD method using the VESTA software package based on the structure of 2′ (Fig. S16–S18†). Crystal structural analysis indicates that 1′ is a 3D framework constructed from the mono-calcium cation and (H2tcbpe-F)2− ligand, resulting in a 4-fold interpenetrated nonporous structure. The H2tcbpe-F ligand in 1′ is not fully deprotonated and all four carboxylic acid groups adopt monodentate coordinate mode to bridge Ca2+ ions, as depicted in Fig. S17.† Comparative structure studies indicate that water plays a major role in inducing the structural transformation. In 1′, two water molecules coordinate to each Ca2+ ion in the octahedron environment (Fig. S17a†), while in 1 only one-half H2O acts as a terminal ligand coordinated with one Ca2+ in the Ca4 SBU (Fig. S5a†). Based on the water amount per formula unit of the two compounds, the phase transfer product 1′ contains significantly higher water content than the as-made 1.
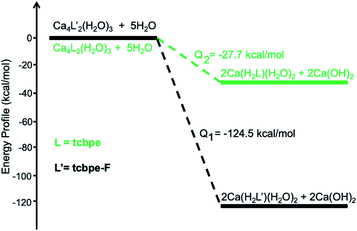
Theoretical calculations are performed to reveal the underlying mechanism of the structural transformation. As shown in Fig. 3, the structural transformation is an exothermic process, predicting that the process should occur spontaneously. The process for this phase transformation can be simplified as follows:
| 1 + 5H2O → 2 1′ + 2Ca(OH)2, Q1 = −124.5 kcal mol−1 |
| 2 + 5H2O → 2 2′ + 2Ca(OH)2, Q2 = −27.7 kcal mol−1 |
An ICP experiment was further carried out to verify the mechanism. 10 mg of the as-made sample 1 was immersed in 1 mL H2O for 1 h, and 183.1 μg g−1 Ca2+ was detected in the supernate, indicating that H2O reacted with the as-made 1 to release Ca2+ into the solution, combining with OH− to form Ca(OH)2 while releasing heat. Introducing F into the ligand facilitates the phase transformation, releasing a much higher amount of heat (−124.5 kcal mol−1) than that of the counterpart without F (−27.7 kcal mol−1), which might result from the extra hydrogen bond between F and H2O in 1′, compared with that in 2′ (Fig. S19†). Based on thermodynamic principles, the resultant 1′ represents a more stable phase than 1. Indeed, as shown in Fig. S20,† compound 1′ exhibits high stability under harsh conditions. PXRD analysis demonstrates that the structure remains highly crystalline upon immersing the samples in both basic (pH = 14) and acidic (pH = 3) solutions overnight. The nonporous 2′ also exhibits similar structural stability to 1′, as depicted in Fig. S21 and S22.†
3.3 Structure-driven fluorescence (FL)
Solid state FL spectra indicate that the as-made 1 emits green emission maximized at 490 under 390 nm excitation (Fig. S23a†). Compared with the FL of the free ligands, as seen in Fig. S24,† the FL of 1 is linker centred emission. DFT calculations were performed to investigate the origin of the emission. As shown in Fig. S25,† the highest occupied molecular orbital (HOMO) of H4tcbpe is mainly associated with the π-bonding orbitals from the tetraphenylethene group, whereas the lowest unoccupied molecular orbital (LUMO) is on the π*-antibonding orbitals of the corresponding benzene rings with the carboxylate group. Therefore, the emission in 1 should originate from the π*–π transitions of the tcbpe ligand. Introducing F into tcbpe will lower both the HOMO and LUMO energy levels, giving rise to the emission of 2 maximized at 480 nm under 390 nm excitation (Fig. S25 and Table S2†). Acting as a classic chromophore for AIE emission, tetraphenylethene based ligands are sensitive to external factors accompanied by colourful fluorescence responses.13 We found that both compounds exhibit typical mechanoresponsive bathochromic fluorescence with a red shift of 15 nm for 1 and 10 nm for 2 before and after grinding (Fig. S23†). Thus, the AIE character in Ca-MOFs inherited from H4tcbpe-based linkers can further confirm the phase transformation. As seen in Fig. 4, the powder sample of 1 exhibits molecule-dependent fluorescence when dispersed in various solvents. Compared with other commonly used solvents, the water dispersed Ca-MOF emulsion shows the most obvious red shift (Δλ ≈ 40 nm for 1 and 25 nm for 2, Fig. S26†), suggesting that the configuration of the ligands in the Ca-MOFs experience changes under water stimuli.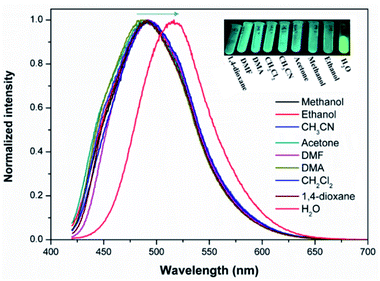 | ||
| Fig. 4 The fluorescence (FL) spectra of 1 dispersed in different solvents. Insets show the photographs of the solvent-dependent FL under excitation with a 365 nm UV lamp. | ||
The adsorption spectra depicted in Fig. 5a indicate that compound 1′ has a red shift in absorbance compared with that of 1, consistent with the data obtained in theoretical calculations. From the calculated density of states (DOS, Fig. 5b), the band gap of 1 is estimated to be 2.7 eV. After the H2O-induced phase transformation into 1′, the bandgap is decreased to 2.3 eV, indicating that the fluorescence of 1′ will have a red shift relative to that of 1 (inset in Fig. 4). As depicted in Fig. S27,† after phase transition, the emission wavelengths of both compounds redshift to greenish yellow emission maximized around 530 nm, which is consistent with the fluorescence of that dispersed in water (inset of Fig. 4).
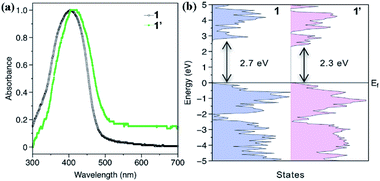 | ||
| Fig. 5 (a) The absorbance spectra of 1 and 1′. (b) The density of states (DOS) for 1 and 1′. The estimated band gaps are indicated in the figure. | ||
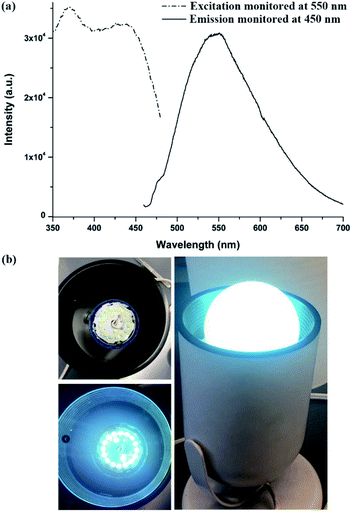
After being thermally treated at 150 °C under vacuum overnight, 1′ further redshifted to give yellow emission maximized at 550 nm (Fig. 6a). PXRD patterns indicate that the red-shift in its fluorescence is not a result of structural change, as evident from Fig. S22.† This thermal induced change in luminescence behaviour is likely due to the release of twisting stress and/or rupturing of the noncovalent interactions of the ligand under heating.14 Notably, 1′ exhibits a wide excitation band from 375 to 450 nm after thermal treatment (Fig. 6a). This allows it to be excited by a blue light to generate yellow emission with a 68% quantum yield. Under 450 nm excitation, the CIE coordinates of 1′ are (0.39, 0.55), well within the yellow light region and close to that of the commercial yellow phosphor YAG:Ce3+ (0.41, 0.56), Fig. S28.† Compared with that of the isoreticular 2′ (λmax = 535 nm after activation under the same conditions, Fig. S29†), F decoration makes 1′ a good yellow phosphor candidate for WLEDs. To this date, only a few MOFs have been reported as yellow phosphors with a high QY, and the yellow emission with high efficiency achievable under blue excitation (e.g. 450 nm) is even more sporadic.7b,14c,15 To assess the performance of 1′ as a yellow phosphor, we further assembled a prototype WLED by coating a commercially available blue LED chip with a solution processed sample of 1′. As shown in Fig. 6b, the resultant WLED lamp emits bright white light. As far as we are aware, this is the first example of a Ca based LMOF as a blue excitable yellow phosphor. This result suggests that designing yellow emitting LMOFs with high efficiency can be realized by deliberately choosing suitable metal ions and ligands, taken into consideration environmental and economic factors. AE2+ metals would be a good candidate with respect to the commonly used rare-earth or transition metals.7
4. Conclusions
In summary, a new Ca-LMOF (1) has been developed and characterized. The compound exhibits an interesting water-induced phase transformation. The resultant Ca-LMOF (1′) emits bright yellow light with high efficiency, representing the first blue-excitable Ca-LMOF phosphor compatible with commercial WLEDs. Theoretical studies together with various experimental characterization techniques uncover the underlying emission mechanism and the structure–property relationships, which offer useful insight for designing new MOFs with phase transition and structure driven properties. This work also serves as a good example of exploration of functional LMOFs based on the abundant and environment friendly AE2+ ions.Data availability
Data may be available upon request to the corresponding authors.Author contributions
Jing Li supervised the project and reviewed and revised the manuscript. Xing-Wu Liu carried out the theoretical calculations. Xiao-Ying Huang refined the crystal data and reviewed the manuscript. Zhao-Feng Wu performed the experiments, analysed the data and wrote the manuscript. Bin Tan did some of the FL measurements. Zhi-Hua Fu performed the SEM measurement. Ever Velasco synthesized the organic ligands. Simon J. Teat collected single crystal data and solved the structures. Kun Zhu fabricated the WLED and measured the quantum yield. Kai Xing analysed the topology of the compound.Conflicts of interest
There are no conflicts to declare.Acknowledgements
This research used the resources of the Advanced Light Source (ALS), which was supported by the Director, Office of Science, Office of Basic Energy Science, of the U.S. Department of Energy, under contract DE-AC02-05CH11231. Zhao-Feng Wu acknowledges the support from the China Scholarship Council.Notes and references
- (a) Energy Savings Forecast of Solid-State Lighting in General Illumination Applications, US Department of Energy, December 13, 2019, https://www.energy.gov/eere/ssl/downloads/2019-ssl-forecast-report Search PubMed; (b) Annual Energy Outlook 2019, US Energy Information Administration, February 3, 2021, https://www.eia.gov/outlooks/aeo/ Search PubMed.
- S. Pimputkar, J. S. Speck, S. P. DenBaars and S. Nakamura, Nat. Photonics, 2009, 3, 180 CrossRef CAS.
- (a) P. Huang, B. Zhou, Q. Zheng, Y. Tian, M. Wang, L. Wang, J. Li and W. Jiang, Adv. Mater., 2020, 32, 1905951 CrossRef CAS PubMed; (b) Q. Yao, P. Hu, P. Sun, M. Liu, R. Dong, K. Chao, Y. Liu, J. Jiang and H. Jiang, Adv. Mater., 2020, 32, 1907888 CrossRef CAS PubMed.
- (a) Z. Hu, B. J. Deibert and J. Li, Chem. Soc. Rev., 2014, 43, 5815 RSC; (b) Y. Cui, J. Zhang, H. He and G. Qian, Chem. Soc. Rev., 2018, 47, 5740 RSC; (c) H.-Y. Li, S.-N. Zhao, S.-Q. Zang and J. Li, Chem. Soc. Rev., 2020, 49, 6364 RSC; (d) Y. Zhao, H. Zeng, X.-W. Zhu, W. Lu and D. Li, Chem. Soc. Rev., 2021, 50, 4484 RSC.
- (a) M.-S. Wang and G.-C. Guo, Chem. Commun., 2016, 52, 13194 RSC; (b) W. P. Lustig and J. Li, Coord. Chem. Rev., 2018, 373, 116 CrossRef CAS; (c) M. Pan, W.-M. Liao, S.-Y. Yin, S.-S. Sun and C.-Y. Su, Chem. Rev., 2018, 118, 8889 CrossRef CAS PubMed.
- (a) K. M. Fromm, Coord. Chem. Rev., 2008, 252, 856 CrossRef CAS; (b) D. Banerjee and J. B. Parise, Cryst. Growth Des., 2011, 11, 4704 CrossRef CAS; (c) Z.-F. Wu, B. Tan, W. P. Lustig, E. Velasco, H. Wang, X.-Y. Huang and J. Li, Coord. Chem. Rev., 2019, 399, 213025 CrossRef CAS.
- (a) Z.-F. Wu, B. Tan, J.-Y. Wang, C.-F. Du, Z.-H. Deng and X.-Y. Huang, Chem. Commun., 2015, 51, 157 RSC; (b) Z.-F. Wu, B. Tan, Z.-H. Deng, Z.-L. Xie, J.-J. Fu, N.-N. Shen and X.-Y. Huang, Chem.–Eur. J., 2016, 22, 1334 CrossRef CAS PubMed; (c) Z.-F. Wu, B. Tan, Z.-L. Xie, J.-J. Fu and X.-Y. Huang, J. Mater. Chem. C, 2016, 4, 2438 RSC.
- (a) O. Ohmori, M. Kawano and M. Fujita, J. Am. Chem. Soc., 2004, 126, 16292 CrossRef CAS PubMed; (b) T. K. Maji, G. Mostafa, R. Matsuda and S. Kitagawa, J. Am. Chem. Soc., 2005, 127, 17152 CrossRef CAS PubMed; (c) J. P. Zhang, Y. Y. Lin, W. X. Zhang and X. M. Chen, J. Am. Chem. Soc., 2005, 127, 14162 CrossRef CAS PubMed; (d) S. Das, H. Kim and K. Kim, J. Am. Chem. Soc., 2009, 131, 3814 CrossRef CAS PubMed; (e) J. Seo, C. Bonneau, R. Matsuda, M. Takata and S. Kitagawa, J. Am. Chem. Soc., 2011, 133, 9005 CrossRef CAS PubMed; (f) R. J. Marshall, S. L. Griffin, C. Wilson and R. S. Forgan, J. Am. Chem. Soc., 2015, 137, 9527 CrossRef CAS PubMed; (g) X. T. Liu, K. Wang, Z. Chang, Y. H. Zhang, J. Xu, Y. S. Zhao and X. H. Bu, Angew. Chem., Int. Ed., 2019, 58, 13890 CrossRef CAS PubMed; (h) M. I. Gonzalez, A. B. Turkiewicz, L. E. Darago, J. Oktawiec, K. Bustillo, F. Grandjean, G. J. Long and J. R. Long, Nature, 2020, 577, 64 CrossRef CAS PubMed.
- (a) D. Bradshaw, J. E. Warren and M. J. Rosseinsky, Science, 2007, 315, 977 CrossRef CAS PubMed; (b) X.-N. Cheng, W.-X. Zhang and X.-M. Chen, J. Am. Chem. Soc., 2007, 129, 15738 CrossRef CAS PubMed; (c) Z. Duan, Y. Zhang, B. Zhang and D. Zhu, J. Am. Chem. Soc., 2009, 131, 6934 CrossRef CAS PubMed; (d) K. M. Hutchins, T. P. Rupasinghe, L. R. Ditzler, D. C. Swenson, J. R. G. Sander, J. Baltrusaitis, A. V. Tivanski and L. R. MacGillivray, J. Am. Chem. Soc., 2014, 136, 6778 CrossRef CAS PubMed; (e) M. Shivanna, Q.-Y. Yang, A. Bajpai, E. Patyk-Kazmierczak and M. J. Zaworotko, Nat. Commun., 2018, 9, 3080 CrossRef PubMed.
- Z.-F. Wu, E. Velasco, C. Shan, K. Tan, Z.-Z. Zhang, Q.-Q. Hu, K. Xing, X.-Y. Huang and J. Li, J. Mater. Chem. C, 2020, 8, 6820 RSC.
- G. M. Sheldrick, Acta Crystallogr., Sect. C: Struct. Chem., 2015, 71, 3 Search PubMed.
- (a) A. Douvali, A. C. Tsipis, S. V. Eliseeva, S. Petoud, G. S. Papaefstathiou, C. D. Malliakas, I. Papadas, G. S. Armatas, I. Margiolaki, M. G. Kanatzidis, T. Lazarides and M. J. Manos, Angew. Chem., Int. Ed., 2015, 54, 1651 CrossRef CAS PubMed; (b) J. Yang, C. A. Trickett, S. B. Alahmadi, A. S. Alshammari and O. M. Yaghi, J. Am. Chem. Soc., 2017, 139, 8118 CrossRef CAS PubMed.
- (a) J. Mei, N. L. C. Leung, R. T. K. Kwok, J. W. Y. Lam and B. Z. Tang, Chem. Rev., 2015, 115, 11718 CrossRef CAS PubMed; (b) D. Ding, K. Li, B. Liu and B. Z. Tang, Acc. Chem. Res., 2013, 46, 2441 CrossRef CAS PubMed; (c) J. Mei, Y. Hong, J. W. Y. Lam, A. Qin, Y. Tang and B. Z. Tang, Adv. Mater., 2014, 26, 5429 CrossRef CAS PubMed.
- (a) N. B. Shustova, A. F. Cozzolino, S. Reineke, M. Baldo and M. Dincă, J. Am. Chem. Soc., 2013, 135, 13326 CrossRef CAS PubMed; (b) Z. W. Wei, Z. Y. Gu, R. K. Arvapally, Y. P. Chen, R. N. McDougald, J. F. Ivy, A. A. Yakovenko, D. W. Feng, M. A. Omary and H. C. Zhou, J. Am. Chem. Soc., 2014, 136, 8269 CrossRef CAS PubMed; (c) B. J. Deibert, E. Velasco, W. Liu, S. J. Teat, W. P. Lustig and J. Li, Cryst. Growth Des., 2016, 16, 4178 CrossRef CAS.
- (a) Q. Gong, Z. Hu, B. J. Deibert, T. J. Emge, S. J. Teat, D. Banerjee, B. Mussman, N. D. Rudd and J. Li, J. Am. Chem. Soc., 2014, 136, 16724 CrossRef CAS PubMed; (b) Z. Hu, G. Huang, W. P. Lustig, F. Wang, H. Wang, S. J. Teat, D. Banerjee, D. Zhang and J. Li, Chem. Commun., 2015, 51, 3045 RSC; (c) L. Yu, H. Wang, W. Liu, S. J. Teat and J. Li, Cryst. Growth Des., 2019, 19, 6850 CrossRef CAS; (d) W. P. Lustig, Z. Shen, S. J. Teat, N. Javed, E. Velasco, D. M. O'Carroll and J. Li, Chem. Sci., 2020, 11, 1814 RSC.
Footnote |
| † Electronic supplementary information (ESI) available: PXRD patterns, more crystal structural details, SEM, IR, PL spectra, and TG curve. CCDC 2110145. For ESI and crystallographic data in CIF or other electronic format see DOI: 10.1039/d1sc05594a |
| This journal is © The Royal Society of Chemistry 2022 |

