
 Open Access Article
 This Open Access Article is licensed under a Creative Commons Attribution-Non Commercial 3.0 Unported Licence
Single cell multi-miRNAs quantification with hydrogel microbeads for liver cancer cell subtypes discrimination†
Yingfei
Wang
a,
Yanyun
Fang
a,
Yu
Zhu
a,
Shiyi
Bi
a,
Ying
Liu
 *ab and
Huangxian
Ju
a
*ab and
Huangxian
Ju
a
aState Key Laboratory of Analytical Chemistry for Life Science, School of Chemistry and Chemical Engineering, Nanjing University, Nanjing, 210023, PR China
bChemistry and Biomedicine Innovation Center, Nanjing University, Nanjing, 210023, China. E-mail: yingliu@nju.edu.cn
First published on 27th January 2022
Abstract
The simultaneous quantification of multi-miRNAs in single cells reveals cellular heterogeneity, and benefits the subtypes discrimination of cancer cells . Though micro-droplet techniques enable successful single cell encapsulation, the isolated and restricted reaction space of microdroplets causes cross-reactions and inaccuracy for simultaneous multi-miRNAs quantification. Herein, we develop a hydrogel microbead based strategy for the simultaneous sensitive quantification of miRNA-21, 122 and 222 in single cells. Single cells are encapsulated and undergo cytolysis in hydrogel microbeads. The three target miRNAs are retained in the microbead by pre-immobilized capture probes, and activate rolling circle amplification (RCA) reactions. The RCA products are hybridized with corresponding dye labelled DNA reporters, and the respective fluorescence intensities are recorded for multi-miRNA quantification. The porous structure of the hydrogel microbeads allows the free diffusion of reactants and easy removal of unreacted DNA strands, which effectively avoids nonspecific cross-reactions. Clear differentiation of cellular heterogeneity and subpopulation discrimination are achieved for three kinds of liver cancer cells and one normal liver cell.
Introduction
The quick discrimination of cancer subtypes would benefit the study of their origins and progression, and improve accuracy in clinical treatment and prognosis. Multiplex microRNAs (miRNAs) regulate the gene network collaboratively to maintain cell renewal, proliferation, and apoptosis.1–6 Different miRNAs expression levels are closely related to cellular heterogeneity,7–9 which plays an important role in the characterization and classification of subpopulations,10–13 and contributes to cancer subtypes discrimination.14,15 However, intracellular multi-miRNAs imaging strategies cannot provide quantitative information. Conventional quantitative measurements of miRNAs expression in bulk analysis only study the average gene expression levels from a large number of cells,16–18 which covers cellular heterogeneity.19,20 Therefore, the simultaneous quantification of multi-miRNAs expression in single cells is very important for cell subtypes discrimination.Droplet microfluidic based techniques facilitate single cell analysis.21,22 Generating microdroplets using aqueous oil systems enables the compartmentalization and isolation of individual target cells.23–25 Labelling specific single cells lysed in droplets with subsequent droplet breakup and RNA sequencing has achieved successful genomic profiling with single cell resolution.26–30 However, it requires a high cost and increases the operation complications.31,32 Isothermal enzymatic amplification33 and DNA cascade hybridization34,35 amplification strategies have been directly performed in the picoliter volume of water-in-oil droplets. Though they provide a fast miRNA detection method in a single cell manner, these droplet based approaches are only suitable for single miRNA quantification. For multi-miRNA signal amplifications, different oligonucleotides and enzymes for each target miRNA have to be compacted in single droplets. The crowded encapsulation of reaction reagents for multi-miRNAs would result in nonspecific amplifications and cross-reactions36 and, thus, impair quantification accuracy. Furthermore, it’s difficult to remove unreacted DNA strands from water-in-oil droplets once they are formed,37 which raises the background signal and limits the detection sensitivity.
Hydrogel microbeads provide a similar hydrous microenvironment as water-in-oil droplets. Unlike water-in-oil droplets with a closed space for the amplification reaction, the porous structure of hydrogel microbeads provides good permeability and allows the free diffusion of DNA strands, as well as the easy removal of unreacted ones to avoid nonspecific cross-reactions. In addition, hydrogel microbeads demonstrate higher mechanical stability with convenient functionalization.38–40 Here, we design hydrogel microbeads instead of microdroplets for single cell encapsulation and achieve the simultaneous quantification of multi-miRNAs in single cells for liver cancer cell subpopulation discrimination. A flow-focusing configured microfluidic chip with two aqueous phase inlets is designed to generate single cell encapsulated microdroplets. The aqueous phases contain the liver cancer cell suspension and PEG hydrogel precursor (PEG-DA)/PEG hydrogel precursor functionalized with miRNAs capture probes (MCPs-PEG-acrylate). MCPs are assembled by the hybridization of DNA nanowire and the target miRNA responsive hairpin probe pairs H1/H2. Two aqueous phase flows meet at the intersection point and are sheared by the oil phase to generate microdroplets for single cell encapsulation. 50 seconds of UV exposure polymerizes the as-obtained microdroplets to hydrogel microbeads, which are subsequently converted from the oil phase to aqueous solution. MCPs are immobilized on the scaffolds of the hydrogel microbeads during photo-polymerization (MCPs–hydrogel microbeads) (Scheme 1A).
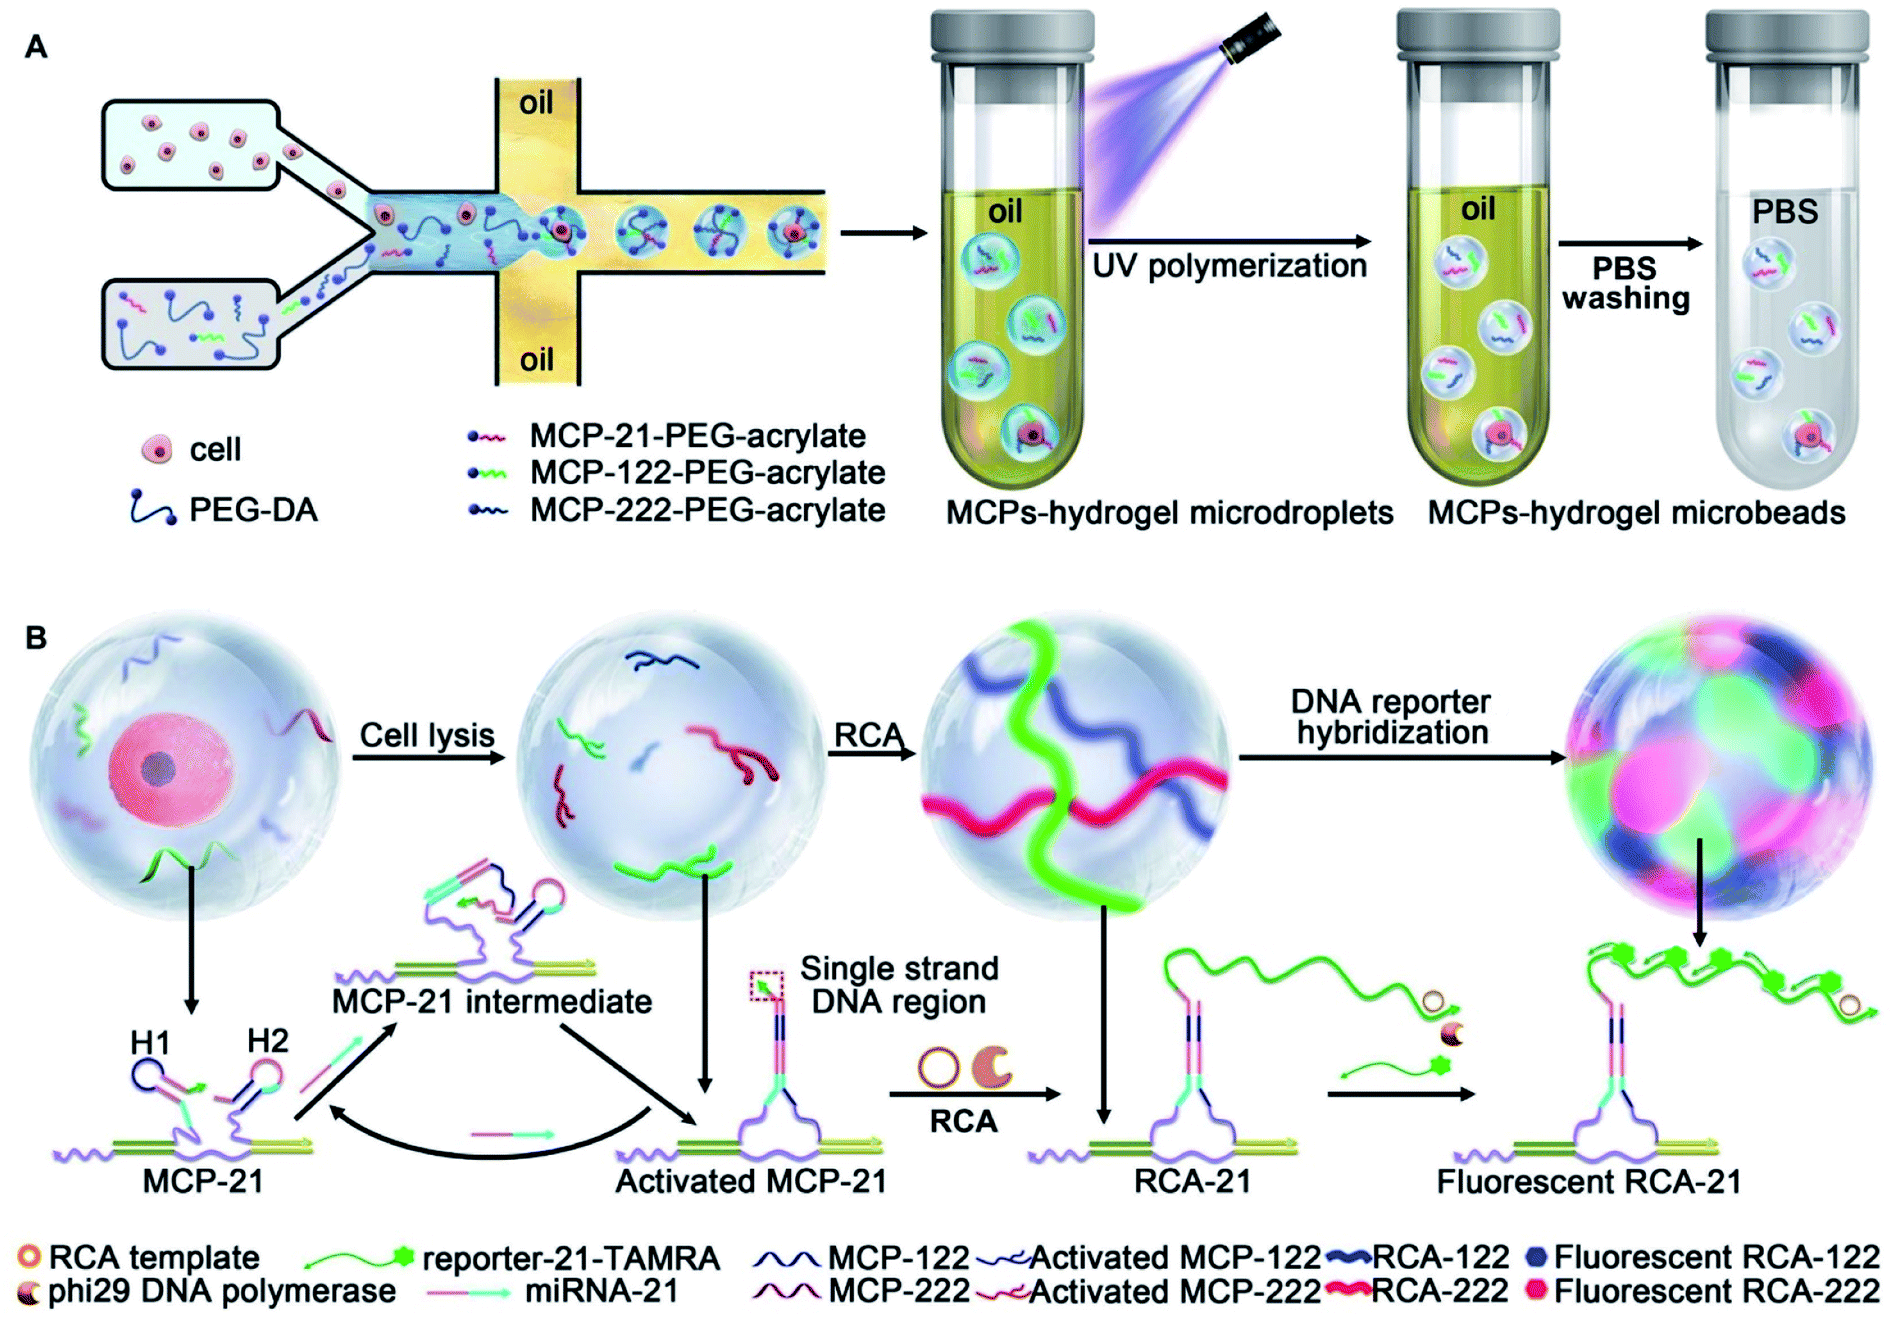 | ||
| Scheme 1 Schematic illustration of (A) single-cell encapsulation in microdroplets and the preparation of MCPs–hydrogel microbeads and (B) cell lysis and miRNAs specific signal amplification in the hydrogel microbeads for single-cell multi-miRNAs quantification. | ||
miRNA-21, 122 and 222 are selected as the target miRNAs to discriminate between the liver cancer cell subpopulations HepG2, HCCLM3 and MHCC97L, and the normal liver cell HHL-5. The single cell lysis is performed in the hydrogel microbead, which guaranteed the same reaction period for the subsequent signal amplification reaction. The released target miRNAs are recognized by their corresponding MCPs and retained in the hydrogel microbeads, while nontargeted nucleic acids and proteins are removed via PBS washing of the hydrogel microbeads. The recognition of the target miRNAs results in a structural change of the MCPs with the exposure of a single strand DNA region to activate rolling circle amplification (RCA) reactions in the hydrogel microbeads. The target miRNAs are repeatedly used to react with MCPs and activate RCA reactions. Fluorophore labeled DNA reporters are hybridized with the RCA products, thus lighting up the hydrogel microbeads with multi-color fluorescence (Scheme 1B). The fluorescent intensities are quantified for the absolute quantification of single-cell multi-miRNAs, and this achieves successful cellular subpopulations discrimination via three-dimensional visualization and t-distributed stochastic neighbor embedding (t-SNE) analysis.
Results and discussion
Fabrication of the hydrogel microbeads
The hydrogel microbeads were synthesized via the photo-polymerization of microfluidic droplets. To prepare the microdroplets, a microfluidic system was set up with a flow focused patterned microfluidic chip including two aqueous phase inlets and one oil phase inlet (Fig. S1A and B†), a FLOW-EZ pump and a microscope (Fig. S1C†). The PEG hydrogel precursor, containing 10% (v/v) PEG-DA-700, 10% (v/v) of 20 mM PEG-DA-3400 aqueous solution and 1% (v/v) photo initiator, was imported into one aqueous phase inlet. Water flowed into the other aqueous phase inlet, and hexadecane containing 4% EM90 was imported into the oil phase inlet. The two aqueous phase flows met the oil phase flow at the intersection point, and the aqueous phase mixture was sheared by the oil phase to generate microdroplets in a high throughput manner (Fig. 1A). The as-prepared water-in-oil microdroplets were collected at the outlet of the microfluidic chip. 50 seconds of UV light irradiation induced the free radical polymerization of PEG-DA in the microdroplets, and resulted in hydrogel microbeads with a uniform size of 50 μm in diameter (Fig. 1B) and variation coefficient of 4.95%, indicating a quasi-monodisperse distribution (Fig. S2†).41 The FTIR spectrum of PEG-DA showed characteristic peaks for –OH and –CH2 stretching vibrations at 3400 cm−1 and 2864 cm−1, respectively, and characteristic peaks for –C![[double bond, length as m-dash]](https://www.rsc.org/images/entities/char_e001.gif) O and –CC– stretching vibrations at 1728 cm−1 and 1636 cm−1, respectively (Fig. 1C, line a). After UV irradiation, the successful polymerization of PEG-DA was confirmed by the disappearance of –CC– characteristic peak in the FTIR spectrum (Fig. 1C, line b).
O and –CC– stretching vibrations at 1728 cm−1 and 1636 cm−1, respectively (Fig. 1C, line a). After UV irradiation, the successful polymerization of PEG-DA was confirmed by the disappearance of –CC– characteristic peak in the FTIR spectrum (Fig. 1C, line b).
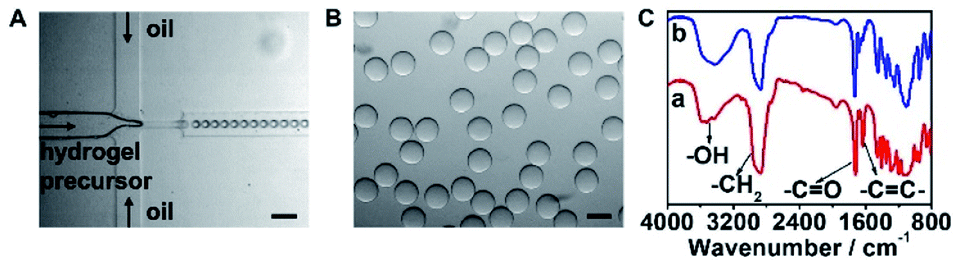 | ||
| Fig. 1 Bright field microphotographs of (A) water-in-oil microdroplets (scale bar: 200 μm) and (B) hydrogel microbeads (scale bar: 50 μm). (C) FTIR spectrum of PEG-DA (a) before and (b) after photo-polymerization. | ||
Preparation of the miRNA capture probes (MCPs) and feasibility demonstration of multi-miRNAs signal amplification
The MCPs were composed by self-assembling equimolar amounts of three DNA strands, 72 bp DNA nanowire, H1 and H2. H1 was composed of hairpin structured h1 that recognizes the target miRNA and an anchoring strand that hybridizes with DNA nanowire. H2 was composed of hairpin structured h2 that hybridizes with h1 and an anchoring strand that hybridizes with the DNA nanowire (Fig. S3A†). Three different liver tumor-related miRNAs, miRNA-21, miRNA-122 and miRNA-222, were taken as the sample targets for the MCPs. The successful assemblies of the MCPs were confirmed by polyacrylamide gel electrophoresis (PAGE) analysis. After incubating DNA nanowire (Fig. S3B,† lane 1), miRNA-21 responsive H1 (H1-21) (Fig. S3B,† lane 2), and H2-21 (Fig. S3B,† lane 3) for 2 h, a new band with lower mobility was observed, accompanied by the disappearance of the H1-21, H2-21 and DNA nanowire bands (Fig. S3B,† lane 4), indicating the successful synthesis of MCP-21. miRNA-122 and miRNA-222 responsive MCP-122 and MCP-222, respectively, were prepared according to the same procedure and showed bright bands with a similar mobility as that of MCP-21 in PAGE (Fig. S3B,† lane 5, 6). To illustrate the assembly ratios of H1, H2, and the DNA nanowire in the MCP, a Cy3 labelled DNA nanowire (DNA nanowire–Cy3) was hybridized with 6-carboxyfluorescein (FAM) labeled H1-21 (H1-21–FAM) and Cy5 labeled H2-21 (H2-21–Cy5) to prepare a tri-color MCP-21. Calculated according to the standard calibration curves of DNA nanowire–Cy3, H1-21–FAM, and H2-21–Cy5 (Fig. S3C†), the amounts of FAM, Cy5 and Cy3 contained in 200 μL tri-color MCP-21 were all 60 pmol, indicating that each MCP contained one DNA nanowire and a pair of H1/H2.The target miRNA triggered the catalytic hairpin assembly (CHA) reaction in MCP by hybridizing with H1 via toehold-mediated strand displacement and unfolding the hairpin structure of H1 to form the MCP intermediate. The newly exposed region in H1 further hybridized with H2 and formed a H1/H2 duplex structure, therefore activating the MCP by exposing a single strand DNA region, which acted as a primer for the subsequent rolling circle amplification (RCA) reaction (Scheme 1B, activated MCP-21). During the MCP activation process, the target miRNA was released from H1 and cyclically applied in continuous MCP activation, which pre-amplified the signal (Scheme 1B). The feasibility of specific miRNA recognition and subsequent CHA reaction was first verified in homogeneous solution with free h1 and h2 DNA probe pairs (Fig. 2A). After incubating miRNA-21 with the mixture of h1-21 and h2-21, a new band with lower mobility appeared, accompanied by the disappearance of the h1-21 and h2-21 bands, indicating the generation of the CHA reaction product CHA-21. The miRNA-21 band was still observed in the PAGE image because it only exists in the intermediate and was released before the formation of the final product CHA-21 (Fig. 2B, CHA-21 lane 4). In comparison, the mixture of h1-21 and h2-21 in the absence of miRNA-21 only showed two distinct bands at their corresponding positions (Fig. 2B, CHA-21 lane 5). Successful assemblies of CHA-122 and CHA-222 demonstrated similar lower mobility bands in the PAGE images (Fig. 2B, CHA-122 lane 4 and CHA-222 lane 4, respectively).
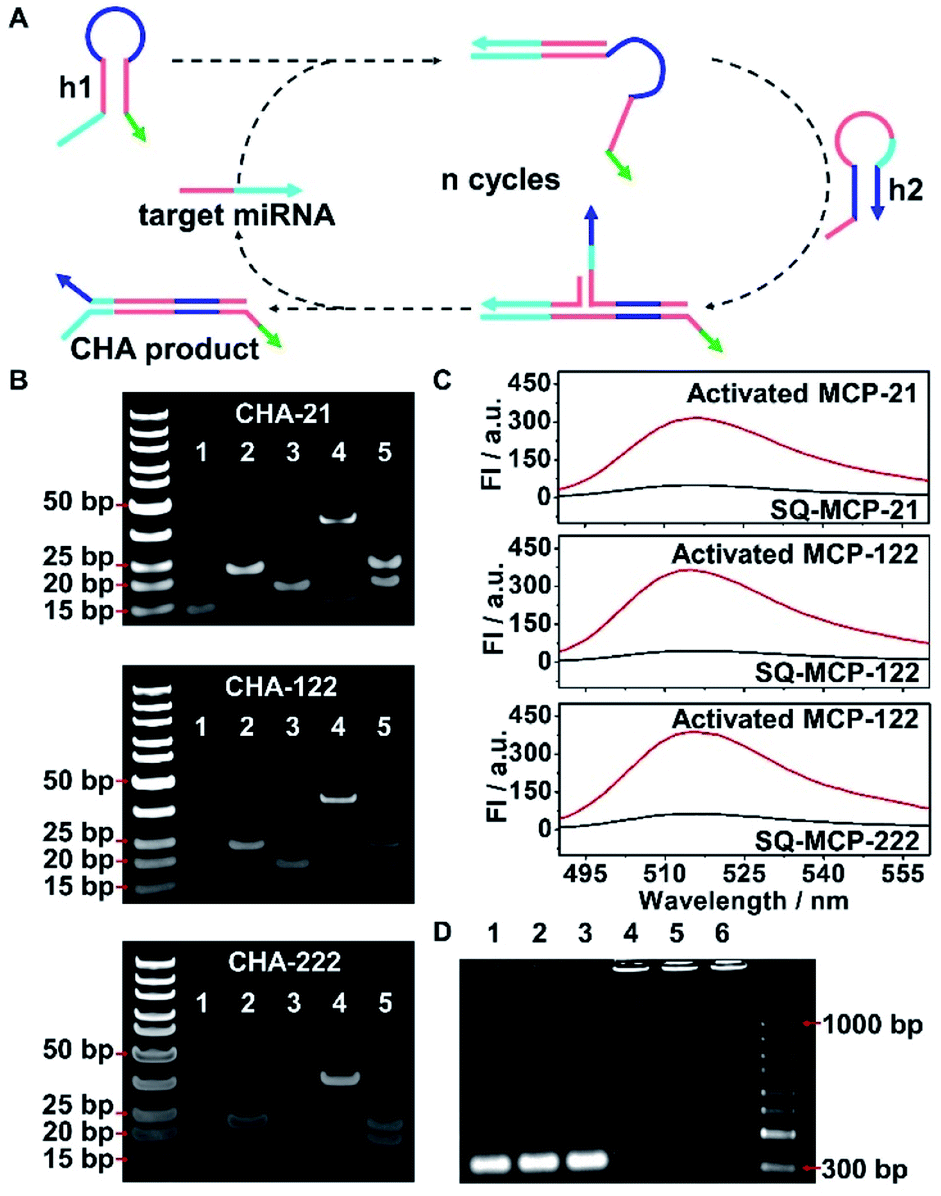 | ||
| Fig. 2 (A) Schematic illustration and (B) PAGE analysis of CHA reactions corresponding to miRNA-21 (CHA-21), miRNA-122 (CHA-122) and miRNA-222 (CHA-222) in homogeneous solution, lane 1–5 represented the target miRNA and the corresponding h1, h2, CHA product, and the mixture of h1 and h2, respectively. (C) Fluorescence spectra of SQ-MCP-21, SQ-MCP-122, and SQ-MCP-222 in response to their corresponding miRNAs. (D) Agarose gel electrophoresis analysis of RCA reactions, lane 1–6 represented MCP-21, MCP-122 and MCP-222, and the corresponding RCA products RCA-21, RCA-122 and RCA-222, respectively. | ||
To further confirm the activation of MCPs in homogeneous solution, self-quenched MCPs (SQ-MCPs) were prepared with FAM and its corresponding quencher, BHQ1, labeled in proximate positions in H2 (Fig. S4†). The specific recognition of miRNA-21 activated SQ-MCP-21 with the generation of the H1/H2 duplex and corresponding strong FAM fluorescence recovery at 518 nm (Fig. 2C, activated MCP-21). The same fluorescence recovery was also observed for SQ-MCP-122 and SQ-MCP-222 (Fig. 2C, Activated-MCP-122 and Activated-MCP-222).
To verify the RCA reaction following the MCPs activation, circular-21, 122 and 222 were prepared with linear pre-circular-21, 122, and 222, respectively (Fig. S5†). The as-obtained circular-21, 122 and 222 were hybridized to exposed single strand DNA regions in the corresponding activated MCPs (Scheme 1B, RCA-21/122/222). After the RCA reaction, MCP-21, MCP-122 and MCP-222 bands all disappeared, with the appearance of new bands with much lower mobility in agarose gel electrophoresis, indicating the successful process of the RCA reactions (Fig. 2D).
Functionalization of hydrogel microbeads with MCPs
To endow the hydrogel microbeads with the capability of capturing the target miRNAs, DBCO was labelled on DNA nanowire (DBCO–DNA nanowire), and hybridized with H1, H2 to obtain DBCO–MCP. The as-obtained DBCO–MCP was conjugated with azide functionalized PEG-acrylate (N3-PEG-acrylate) via the click reaction to get MCP–PEG-acrylate (Fig. 3A).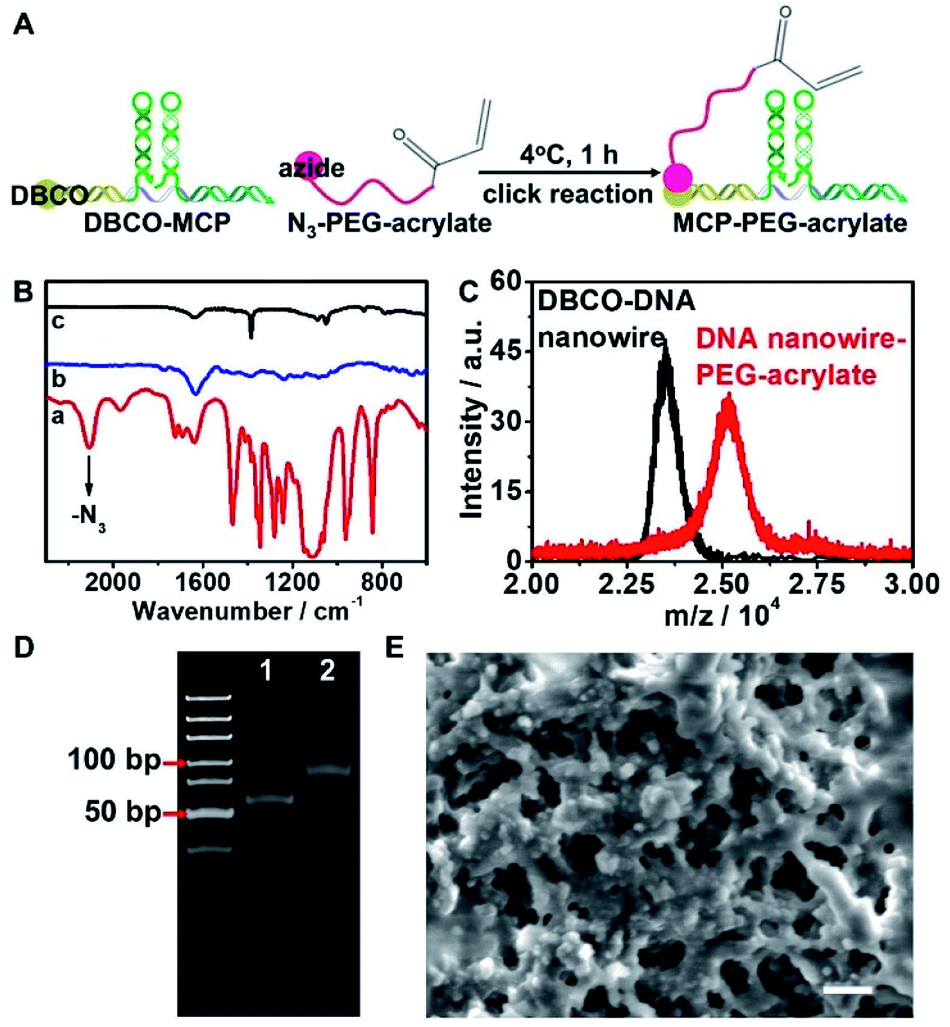 | ||
| Fig. 3 (A) Schematic illustration and (B) FTIR characterization of MCP–PEG-acrylate synthesis (lines (a–c) in (B): N3-PEG-acrylate, DBCO–MCP and MCP–PEG-acrylate). (C) Mass spectra and (D) PAGE characterizations of DBCO–DNA nanowire and N3-PEG-acrylate conjugation (lane 1 in (D): DBCO–DNA nanowire, lane 2 in (D): DNA nanowire–PEG-acrylate). (E) Scanning electronic microscopy image of MCP–hydrogel microbeads (scale bar: 500 nm). | ||
N3-PEG-acrylate demonstrated an azide characteristic peak at 2102 cm−1 and –CC–, –CO– characteristic peaks at 1634 cm−1 and 1723 cm−1 in the FTIR spectrum (Fig. 3B, line a). The successful conjugation of DBCO–MCP to N3-PEG-acrylate was confirmed by the disappearance of the N3 characteristic peak for MCP–PEG-acrylate (Fig. 3B, line c). Mass spectrometry and PAGE were further performed to verify the conjugation of MCP with PEG-acrylate. Considering its lower molecular mass, DBCO–DNA nanowire was used instead of DBCO–MCP. Incubation of DBCO–DNA nanowire with N3-PEG-acrylate increased the molecular mass by about 2000 in the mass spectrum, which corresponded with the molecular mass of N3-PEG-acrylate (Fig. 3C). The as-prepared DNA nanowire–PEG-acrylate also showed a new band with a higher molecular weight in PAGE (Fig. 3D, line 2).
The as-prepared MCP–PEG-acrylate was added into the PEG hydrogel precursor aqueous phase flow, and co-polymerized with PEG-DA upon UV irradiation to generate MCP functionalized hydrogel microbeads (MCP–hydrogel microbeads). The as-prepared MCP–hydrogel microbeads demonstrated a porous structure with a pore size of around 500 nm (Fig. 3E), and kept a stable size of around 50 μm over 8 days in different buffers (Fig. S6†). The sub-micrometer level of the inner cavities in the hydrogel microbeads ensured the free diffusion of phi29 DNA polymerase and dNTPs for the RCA reaction which was subsequently performed in the hydrogel microbeads.
Quantification of multi-miRNAs in hydrogel microbeads
Hydrogel microbeads functionalized with MCP-21, MCP-122, and MCP-222 were prepared for multi-miRNA quantification. To demonstrate the specific activation of MCPs and their even distribution in hydrogel microbeads, SQ-MCP-21 with the dye FAM and the corresponding quencher BHQ1 labelled in proximate positions of H2-21, SQ-MCP-122 with the dye tetramethylrhodamine (TAMRA) and corresponding quencher BHQ2 labelled in proximate positions of H2-122, and SQ-MCP-222 with the dye Cy5 and corresponding quencher BHQ3 labelled in proximate positions of H2-222, were prepared and co-immobilized in hydrogel microbeads. The as-obtained multi-SQ-MCP functionalized hydrogel microbeads were challenged with 100 nM of miRNA-21, miRNA-122 and miRNA-222, respectively. The specific recognition of the miRNA resulted in the fluorescence recovery of the corresponding dye in the hydrogel microbeads. They demonstrated the homogeneous fluorescence distribution of FAM in response to miRNA-21, TAMRA to miRNA-122 and Cy5 to miRNA-222 without cross-reactions (Fig. S7†).To apply hydrogel microbeads in multi-miRNAs quantification, different concentrations of miRNA-21, miRNA-122 and miRNA-222 mimic mixtures were imported into one aqueous flow inlet, while MCP-21–PEG-acrylate, MCP-122–PEG-acrylate, and MCP-222-PEG–acrylate were mixed with the PEG hydrogel precursor, and imported into the other aqueous flow inlet of the microfluidic chip (Fig. 4A). The copy number of miRNAs infused in each microdroplet was calculated based on the imported miRNAs concentrations and the volume of a single hydrogel microdroplet. miRNA-21, miRNA-122 and miRNA-222 were captured by their corresponding MCP–PEG-acrylate, and triggered CHA reactions in the MCPs. The activated MCPs initiated RCA reactions in the hydrogel microbeads. Following the RCA reaction, dye labeled DNA reporter probes, which had the same sequence as the repeat regions in the circular template (circular-21, 122 and 222), were hybridized to the single stranded RCA products (Scheme 1B, fluorescent RCA-21/122/222). TAMRA labelled DNA reporter-21 (reporter-21-TAMRA), FAM labelled DNA reporter-122 (reporter-122-FAM), and Cy5 labeled DNA reporter-222 (reporter-222-Cy5) were hybridized to RCA-21, RCA-122 and RCA-222, respectively. Z-stacking images of the hydrogel microbeads were then collected and integrated at wavelength ranges of 555 to 605 nm, 500 to 540 nm and 650 to 690 nm, respectively, for multi-miRNAs quantification (Fig. 4B). The integrated fluorescence intensities of the hydrogel microbeads at the three different wavelength regions all increased with their corresponding miRNA concentrations (Fig. 4B), and demonstrated linear relationships from 5 to 200![[thin space (1/6-em)]](https://www.rsc.org/images/entities/char_2009.gif) 000 copy numbers for miRNA-21, miRNA-122, and miRNA-222 (Fig. 4C–E, left column, multi-miRNA infusion). Compared with miRNA signal amplification strategies in homogeneous solution,42 the confinement of the detection signal in the hydrogel microbeads of 50 μm diameter effectively enhanced the signal intensity and improved the detection sensitivity. miRNA concentrations of lower than 100 fM were not explored, because the infused miRNAs copy numbers among the different microbeads would not be even with concentrations below 100 fM.
000 copy numbers for miRNA-21, miRNA-122, and miRNA-222 (Fig. 4C–E, left column, multi-miRNA infusion). Compared with miRNA signal amplification strategies in homogeneous solution,42 the confinement of the detection signal in the hydrogel microbeads of 50 μm diameter effectively enhanced the signal intensity and improved the detection sensitivity. miRNA concentrations of lower than 100 fM were not explored, because the infused miRNAs copy numbers among the different microbeads would not be even with concentrations below 100 fM.
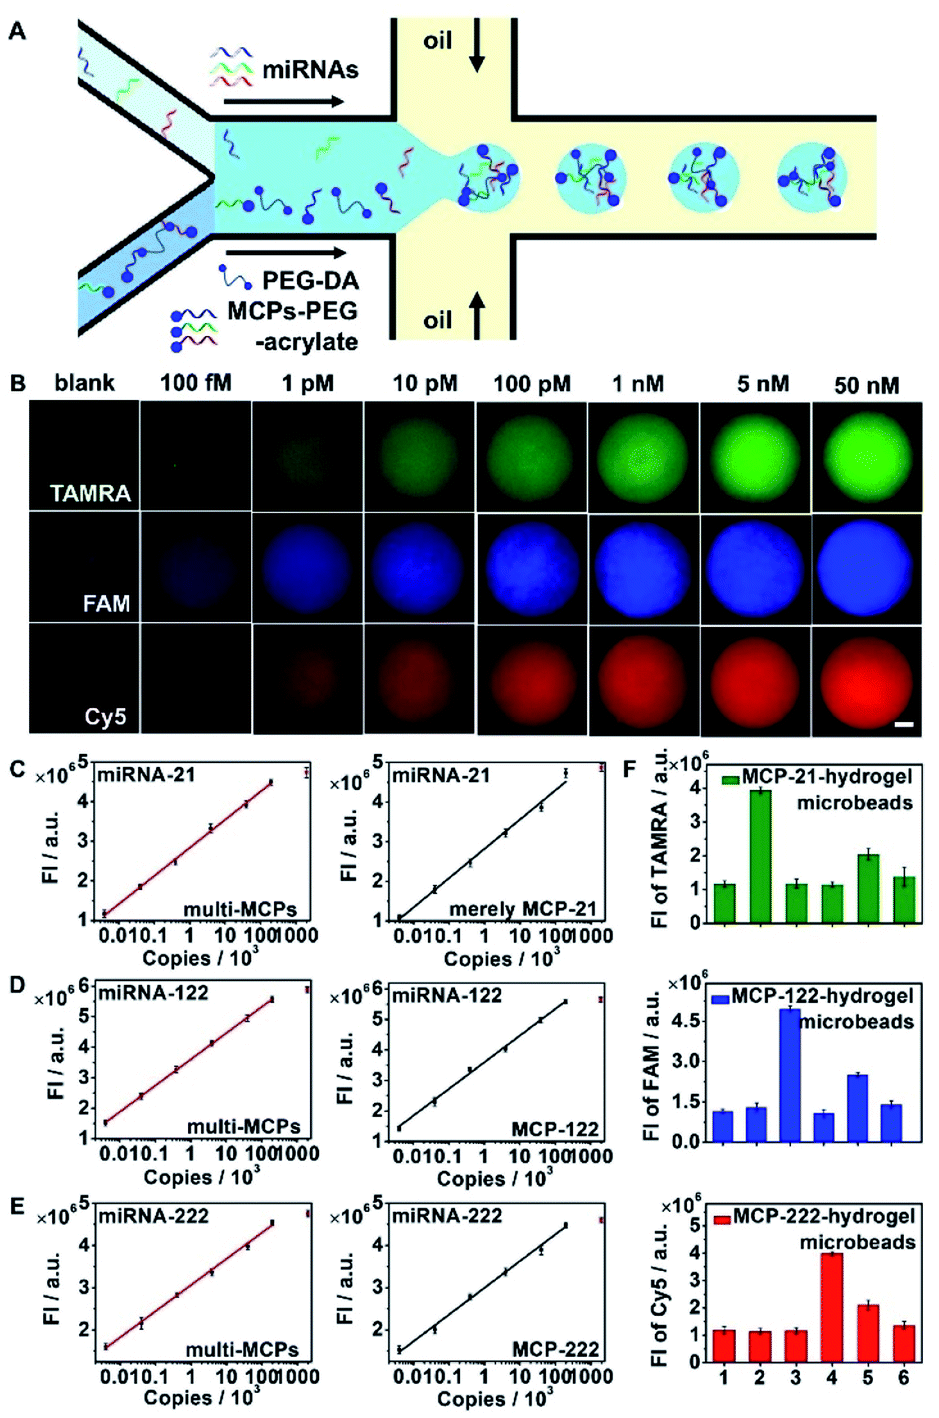 | ||
| Fig. 4 (A) Microfluidic chip setup for the preparation of miRNA-21/122/222 infused multi-MCP functionalized hydrogel microbeads (B) Fluorescence images of multi-MCPs functionalized hydrogel microbeads in response to miRNA-21, miRNA-122 and miRNA-222 mixtures with various concentrations ranging from 100 fM to 50 nM for each miRNA (scale bar: 10 μm). Linear relationship of fluorescence intensity versus logarithm copy numbers of (C) miRNA-21, (D) miRNA-122 and (E) miRNA-222 for multi-MCPs functionalized hydrogel microbeads in response to miRNA-21, miRNA-122, miRNA-222 mixtures (red, left column) and single MCP functionalized hydrogel microbeads in response to the corresponding single miRNA (black, right column). (F) Single MCP functionalized hydrogel microbeads in response to miRNA-21, miRNA-122 and miRNA-222 and the corresponding target miRNA with one mismatched base and three mismatched bases. Columns 1–6 represent blank, 1 nM miRNA-21, miRNA-122 and miRNA-222, 1-mismatched corresponding miRNA and 3-mismatched corresponding miRNA. The error bars were collected from 15 hydrogel microbeads from 3 different experiments and indicated as means ± S.D. | ||
To verify the reaction efficiency for the simultaneous multi-miRNAs signal amplifications in the hydrogel microbeads, only miRNA-21 was imported into one aqueous flow inlet, while only MCP-21–PEG-acrylate was mixed with the PEG hydrogel precursor and imported into the other aqueous flow inlet of the microfluidic chip. miRNA-21 demonstrated similar fluorescence intensities in only MCP-21 functionalized hydrogel microbeads (Fig. 4C, right column) compared with that of multi-MCPs functionalized hydrogel microbeads challenged with miRNAs mixtures (Fig. 4C, left column). Only MCP-122 or MCP-222 functionalized hydrogel microbeads also demonstrated similar fluorescence intensities at corresponding copy numbers of miRNA-122 and miRNA-222, respectively (Fig. 4D, E, right column), compared with multi-MCPs functionalized hydrogel microbeads (Fig. 4D, E, left column). These results indicated few cross-reactions for the simultaneous signal amplifications for different miRNAs in the hydrogel microbeads.
The reaction specificity of multi-MCPs functionalized hydrogel microbeads was further verified by infusing miRNA-21, miRNA-122, miRNA-222, and synthetic miRNA-21 mimics with 1-mismatched base (miRNA-21-M1) and 3-mismatched bases (miRNA-21-M3) to MCP-21 functionalized hydrogel microbeads. After signal amplification, MCP-21 functionalized hydrogel microbeads demonstrated much stronger TAMRA fluorescence in response to miRNA-21 compared with other nonspecific miRNAs, miRNA-21-M1 and miRNA-21-M3 (Fig. S8,† MCP-21-hydrogel microbeads; Fig. 4F, MCP-21-hydrogel microbeads). Similarly, MCP-122 functionalized hydrogel microbeads showed much stronger FAM fluorescence to miRNA-122 (Fig. S8,† MCP-122-hydrogel microbeads; Fig. 4F, MCP-122-hydrogel microbeads), and MCP-222 functionalized hydrogel microbeads showed much stronger Cy5 fluorescence to miRNA-222 (Fig. S8,† MCP-222 hydrogel microbeads; Fig. 4F, MCP-222-hydrogel microbeads).
Single-cell multi-miRNAs quantification in MCPs functionalized hydrogel microbeads and liver cancer cell subtypes discrimination
Multi-miRNAs expression analysis in a single cell indicates cellular heterogeneity, and provides a significant reference for cancer subtypes discrimination.7,43 Multi-MCPs functionalized hydrogel microbeads were able to amplify multiple miRNAs signals simultaneously in a single microbead, and barely demonstrated nonspecific cross-reactions. HepG2, HCCLM3 and MHCC97L, three liver cancer cell lines, and HHL-5, a normal liver cell line, were chosen as the sample cell lines for liver cell subtypes discrimination. A cell suspension of a certain cell line was imported into one aqueous phase inlet of the microfluidic chip, while another aqueous phase inlet was imported with MCP-21–PEG-acrylate, MCP-122–PEG-acrylate, MCP-222–PEG-acrylate and the hydrogel precursor (Fig. 5A). After UV exposure, a single cell was isolated in a hydrogel microbead with an encapsulation efficiency of around 10% (Fig. 5B). The hydrogel microbeads were then treated with cell lysis buffer of sodium dodecyl sulfate (SDS) and proteinase K to release intracellular miRNAs. The released intracellular miRNA-21, miRNA-122 and miRNA-222 were retained in the hydrogel microbeads and repeatedly reacted with MCP-21, MCP-122, and MCP-222, respectively. To verify the leakage of miRNAs from the MCP functionalized microbeads, FAM labeled miRNA-21 mimics (miRNA-21–FAM) and MCP-21 were mixed in hydrogel microdroplets. After UV polymerization and 37 °C incubation, the supernatant demonstrated a similar FAM fluorescence intensity to that of blank hydrogel microbeads without miRNA-21–FAM encapsulation. In contrast, FAM fluorescence was clearly observed from the supernatant of miRNA-21–FAM encapsulated unfunctionalized hydrogel microbeads (Fig. S9A†). The corresponding RT-PCR results also confirmed little leakage of miRNA-21–FAM from the MCP-21 functionalized microbeads and obvious release from the unfunctionalized hydrogel microbeads (Fig. S9B†). To verify the diffusion of miRNA among the microbeads, we mixed the above prepared miRNA-21-FAM encapsulated MCP-21-microbeads with Cy5 labelled MCP-21 (MCP-21–Cy5) functionalized hydrogel microbeads (MCP-21–Cy5 microbeads). MCP-21–Cy5-microbeads barely showed FAM fluorescence, indicating no diffusion of miRNA among the microbeads (Fig. S9C†). Furthermore, TAMRA labeled miRNA-155 mimics (miRNA-155–TAMRA) were infused with MCPs in microdroplets to simulate the leakage of non-target miRNAs. After UV polymerization and centrifugation, the supernatant was collected and concentrated for measurement of the TAMRA fluorescence. Calculated from the standard calibration curve of miRNA-155–TAMRA, the amount of miRNA-155 in the supernatant was close to the originally infused amount in hydrogel microbeads, thus indicating that non-targeted miRNAs were not retained in the MCPs functionalized hydrogel microbeads (Fig. S10†).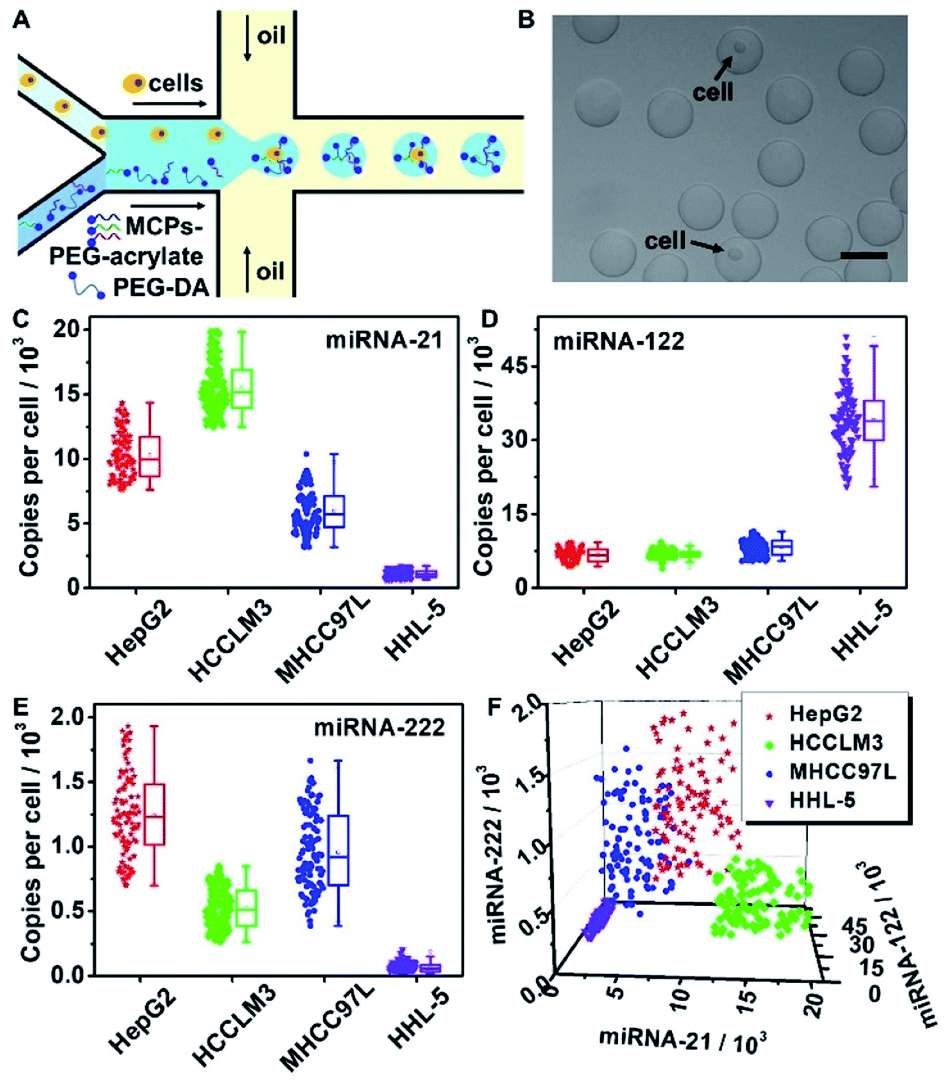 | ||
| Fig. 5 (A) Schematic illustration of single-cell mixing with multi-MCPs–PEG-acrylate and PEG-DA in microdroplets. (B) Bright field image of single cells encapsulated in MCPs functionalized hydrogel microbeads (scale bar: 50 μm). Box chart of (C) miRNA-21, (D) miRNA-122 and (E) miRNA-222 copy numbers in single cells for HepG2, HCCLM3 and MHCC97L liver cancer cell lines, and the HHL-5 normal liver cell line. (F) Three dimensional scatter profile of miRNA-21, miRNA-122, miRNA-222 per cell for the HepG2, HCCLM3, MHCC97L, and HHL-5 cell lines. Each dot in (C–F) indicates the miRNA copy number calculated from single a cell encapsulated in a hydrogel microbead. | ||
Considering the high expression levels of characteristic miRNAs for the selected cell types, cells encapsulated in the hydrogel microbeads showed obvious signals for at least one certain kind of fluorescence after cell lysis and signal amplification, which distinguished them from empty hydrogel microbeads without cell encapsulation (Fig. S11†). Fluorescence signals for TAMRA, FAM and Cy5 were collected from 100 single cells encapsulated hydrogel microbeads after performing RCA reactions in the hydrogel microbeads with subsequent dye labeled DNA reporters binding, and substituted into miRNA-21 (Fig. 4C, left column), miRNA-122 (Fig. 4D, left column), miRNA-222 (Fig. 4E, left column) linear relationships, respectively, to calculate the corresponding miRNA copy numbers in single cells (Fig. 5C–E). The copy numbers of intracellular miRNA-21, miRNA-122, miRNA-222 were also verified with the lysis solution of 106 cells by RT-PCR for the four different liver cell lines (Fig. S12 and S13A–C†). The copy numbers of miRNA-21 (Fig. 5C), miRNA-122 (Fig. 5D), and miRNA-222 (Fig. 5E) determined from single cells encapsulated in hydrogel microbeads were consistent with those measured from an average of 106 cells by RT-PCR (Fig. S13D–F†). Considering the cellular heterogeneity in the same cell line, standard variations calculated from single cells encapsulated in microbeads were much larger than those obtained from RT-PCR. Results from RT-PCR confirmed the accuracy of single-cell multi-miRNAs quantifications from hydrogel microbeads.
All three miRNAs showed different expressions among the different cell lines. Compared with normal HHL-5 liver cells, the liver cancer cell lines HepG2, HCCLM3 and MHCC97L all demonstrated upregulated miRNA-21 and miRNA-222 expressions and downregulated miRNA-122 expression (Fig. 5C–E). More significantly, miRNA-21, miRNA-122 and miRNA-222 expression levels all demonstrated considerable heterogeneity among individual cells even in the same cell line. This intra-line heterogeneity makes it impossible to discriminate between liver cancer cell subtypes by measuring the expression level for only one kind of miRNA.
Taking advantage of the capability of hydrogel microbeads for the absolute quantification of multi-miRNAs, joint analysis of miRNA-21, miRNA-122 and miRNA-222 expressions in individual cells were investigated. According to the miRNA-21, 122 and 222 copy numbers expressed in each individual cell, described in Fig. 5C–E, respectively, three dimensional scatter diagrams of single cell multi-miRNAs expression distributions were pictured (Fig. 5F). An obvious aggregation tendency within liver cancer cell subtypes was observed (Fig. 5F). T-distributed stochastic neighbor embedding (t-SNE) analysis was further applied to visualize the high-dimension miRNA expression data, and demonstrated cell type specific clusterings (Fig. S14†).
To further apply this approach in sub-populations discrimination for a mixture of the different cell lines, the liver cell lines HepG2, HCCLM3, MHCC97L and HHL-5 cells were equally premixed and imported into one aqueous phase inlet of the microfluidic chip to generate single cells encapsulated hydrogel microbeads (Fig. 6A). After cell lysis and intra-bead signal amplification, fluorescence signals for TAMRA, FAM and Cy5 were collected from 200 single cells encapsulated hydrogel microbeads and converted to the corresponding miRNAs copy numbers according to the miRNA-21 (Fig. 4C, left column), miRNA-122 (Fig. 4D, left column) and miRNA-222 (Fig. 4E, left column) calibration curves. The data spots were presented in a 3D scatter profile (Fig. 6B) and t-SNE distribution profile (Fig. 6C) according to the miRNA-21, 122, and 222 copy numbers for each microbead, and demonstrated obvious self-organized clustering into four groups with similar spot numbers for each group. Different learning rate (lr) and perplexity values were applied in the t-SNE analysis algorithm to optimize the presentation visualizations (Fig. S15†) and the best cell subpopulation clusterings were obtained with Ir = 850 and perplexity = 40 (Fig. 6C). According to the three dimensional scatter profiles for the four cell lines (Fig. 5F), the red, green, blue, and violet circle enclosed groups were ascribed to HepG2, HCCLM3, MHCC97L and HHL-5 cells, respectively (Fig. 6B and C). These results confirmed the capability of the developed approach in cell sub-populations discrimination from mixtures of different cell lines.
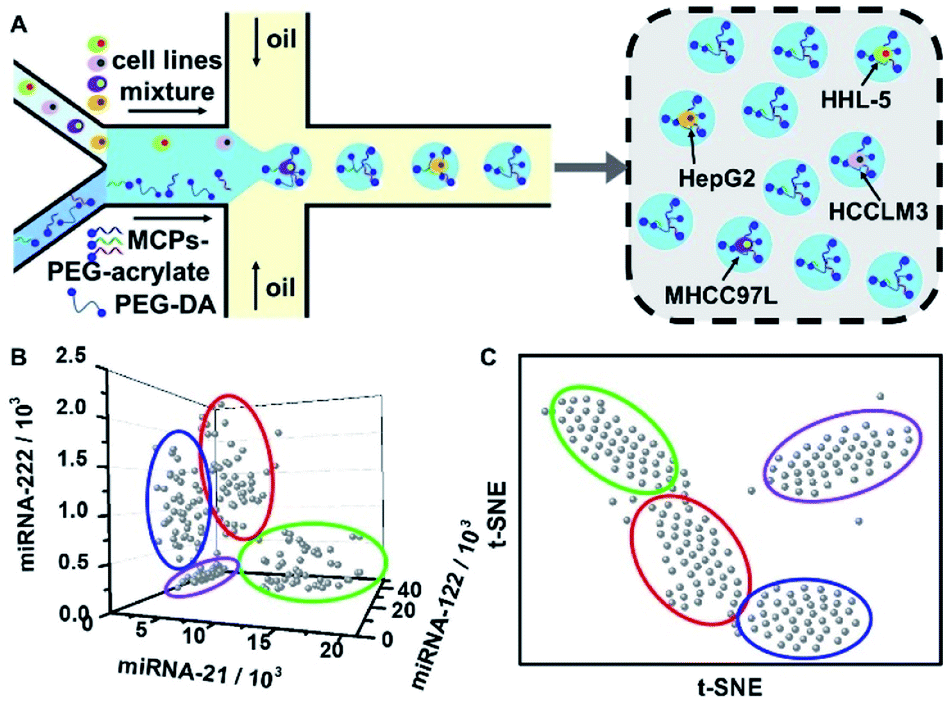 | ||
| Fig. 6 (A) Schematic illustration of generating single cells encapsulated hydrogel microbeads with pre-mixed liver cell lines. (B) 3D scatter profiles and corresponding (C) t-SNE clustering analysis of miRNA-21, miRNA-122 and miRNA-222 per cell for the liver cell lines mixture. Each dot in (B), (C) represents a single cell encapsulated in a hydrogel microbead. | ||
Conclusions
In summary, we developed a hydrogel microbead based strategy for single cell isolation and intercellular multiple miRNAs quantification, and successfully applied this strategy for cancer cell subtypes discrimination. The liver cancer cells HepG2, HCCLM3 and MHCC-97L, and normal liver cell HHL-5 were chosen as the sample cell subpopulations, and liver cancer related miRNAs, miRNA-21, 122 and 222, were selected as the detection targets. Sensitive absolute quantifications of multi-miRNAs in single cells were achieved by performing cascade DNA hybridizations including CHA, RCA, and dye labeled DNA strand hybridization in hydrogel microbeads. The permeable structure of the hydrogel microbeads guaranteed high efficiency for signal amplification reactions with few nonspecific cross-reactions. All three miRNAs not only showed different expressions among the different cell lines, but also demonstrated considerable cellular heterogeneity in the same cell line. HepG2, HCCLM3, MHCC-97L, and HHL-5 showed obvious clustering in the three dimensional scatter plot and t-distributed stochastic neighbour embedding (t-SNE) analysis. Self-organized clusterings were also demonstrated from a mixture of the four cell lines. This strategy provides a convenient and promising identification method for cell subtypes, which is meaningful to the study of cancer origins and progression.Data availability
The data are available from authors upon request.Author contributions
Y. Wang designed and performed the experimental parts, collected the experimental data and performed data analysis. Y. Fang cultured cells and helped with probe preparation. Y. Zhu fabricated the microfluidic chips, generated the hydrogel microbeads and conducted part of the experiments. S. Bi cultured the cells. Y. Wang wrote the original draft. Prof. Y. Liu supervised the project and revised the manuscript. Prof. H. Ju provided advice and suggestions for the experiment data. All the authors discussed the results.Conflicts of interest
There are no conflicts to declare.Acknowledgements
We gratefully acknowledge the National Natural Science Foundation of China (21974064, 22022405, 21635005), the Natural Science Foundation of Jiangsu Province for distinguished Young Scholars (BK20200010), the Specially-appointed Professor Foundation of Jiangsu Province, and the Program for Innovative Talents and Entrepreneurs of Jiangsu Province.Notes and references
- Y. Lu, X. Zhao, Q. Liu, C. Li, R. Graves-Deal, Z. Cao, B. Singh, J. L. Franklin, J. Wang, H. Hu, T. Wei, M. Yang, T. J. Yeatman, E. Lee, K. Saito-Diaz, S. Hinger, J. G. Patton, C. H. Chung, S. Emmrich, J. H. Klusmann, D. Fan and R. J. Coffey, Nat. Med., 2017, 23, 1331–1341 CrossRef CAS PubMed
.
- Z. Yu, Y. Li, H. Fan, Z. Liu and R. G. Pestell, Front. Genet., 2012, 3, 191 CAS
- J. Lu, G. Getz, E. A. Miska, E. Alvarez-Saavedra, J. Lamb, D. Peck, A. Sweet-Cordero, B. L. Ebert, R. H. Mak, A. A. Ferrando, J. R. Downing, T. Jacks, H. R. Horvitz and T. R. Golub, Nature, 2005, 435, 834–838 CrossRef CAS PubMed
- S. Griffiths-Jones, H. K. Saini, S. van Dongen and A. J. Enright, Nucleic Acids Res., 2007, 36, D154–D158 CrossRef PubMed
- J. Hemphill and A. Deiters, J. Am. Chem. Soc., 2013, 135, 10512–10518 CrossRef CAS PubMed
- L. Xu, Y. Gao, H. Kuang, L. M. Liz-Marzan and C. Xu, Angew. Chem., Int. Ed., 2018, 57, 10544–10548 CrossRef CAS PubMed
- Z. Wang, L. Qi, Y. Yang, M. Lu, K. Xie, X. Zhao, E. H. C. Cheung, Y. Wang, X. Jiang, W. Zhang, L. Huang, X. Wang and P. Shi, Sci. Adv., 2020, 6, eaba4971–4982 CrossRef CAS PubMed
- M. Jongen-Lavrencic, S. M. Sun, M. K. Dijkstra, P. J. Valk and B. Lowenberg, Blood, 2008, 111, 5078–5085 CrossRef CAS PubMed
- M. He, Y. Liu, X. Wang, M. Q. Zhang, G. J. Hannon and Z. J. Huang, Neuron, 2012, 73, 35–48 CrossRef CAS PubMed
- X. Yang, W. Liu, D. C. Chan, S. U. Ahmed, H. Wang, Z. Wang, C. R. Nemr and S. O. Kelley, J. Am. Chem. Soc., 2020, 142, 14805–14809 CrossRef CAS PubMed
- B. Bierie, S. E. Pierce, C. Kroeger, D. G. Stover, D. R. Pattabiraman, P. Thiru, J. Liu Donaher, F. Reinhardt, C. L. Chaffer, Z. Keckesova and R. A. Weinberg, Proc. Natl. Acad. Sci. U. S. A., 2017, 114, E2337–E2346 CrossRef CAS PubMed
- J. M. Irish and D. B. Doxie, Curr. Top. Microbiol. Immunol., 2014, 377, 1–21 CAS
- J. P. Junker and A. van Oudenaarden, Cell, 2014, 157, 8–11 CrossRef CAS PubMed
- K. Quan, J. Li, J. Wang, N. Xie, Q. Wei, J. Tang, X. Yang, K. Wang and J. Huang, Chem. Sci., 2019, 10, 1442–1449 RSC
- Z. Wu, X. Long, S. Y. Tsang, T. Hu, J. F. Yang, W. K. Mat, H. Wang and H. Xue, BMC Cancer, 2020, 20, 84 CrossRef CAS PubMed
- R. Zilionis, J. Nainys, A. Veres, V. Savova, D. Zemmour, A. M. Klein and L. Mazutis, Nat. Protoc., 2017, 12, 44–73 CrossRef CAS PubMed
- A. Rakszewska, R. J. Stolper, A. B. Kolasa, A. Piruska and W. T. Huck, Angew. Chem., Int. Ed., 2016, 55, 6698–6701 CrossRef CAS PubMed
- X. Zhang, C. Liu, L. Sun, X. Duan and Z. Li, Chem. Sci., 2015, 6, 6213–6218 RSC
- X. Xu, Q. Zhang, J. Song, Q. Ruan, W. Ruan, Y. Chen, J. Yang, X. Zhang, Y. Song, Z. Zhu and C. Yang, Anal. Chem., 2020, 92, 8599–8606 CrossRef CAS PubMed
- D. Sun, F. Cao, L. Cong, W. Xu, Q. Chen, W. Shi and S. Xu, Lab Chip, 2019, 19, 335–342 RSC
- L. Shang, Y. Cheng and Y. Zhao, Chem. Rev., 2017, 117, 7964–8040 CrossRef CAS PubMed
- T. S. Kaminski and P. Garstecki, Chem. Soc. Rev., 2017, 46, 6210–6226 RSC
- V. Sanchez-Freire, A. D. Ebert, T. Kalisky, S. R. Quake and J. C. Wu, Nat. Protoc., 2012, 7, 829–838 CrossRef CAS PubMed
- S. Y. Teh, R. Lin, L. H. Hung and A. P. Lee, Lab Chip, 2008, 8, 198–220 RSC
- M. N. Hsu, S. C. Wei, S. Guo, D. T. Phan, Y. Zhang and C. H. Chen, Small, 2018, 14, e1802918 CrossRef PubMed
- H. Zhang, G. Jenkins, Y. Zou, Z. Zhu and C. J. Yang, Anal. Chem., 2012, 84, 3599–3606 CrossRef CAS PubMed
- A. M. Klein, L. Mazutis, I. Akartuna, N. Tallapragada, A. Veres, V. Li, L. Peshkin, D. A. Weitz and M. W. Kirschner, Cell, 2015, 161, 1187–1201 CrossRef CAS PubMed
- E. Z. Macosko, A. Basu, R. Satija, J. Nemesh, K. Shekhar, M. Goldman, I. Tirosh, A. R. Bialas, N. Kamitaki, E. M. Martersteck, J. J. Trombetta, D. A. Weitz, J. R. Sanes, A. K. Shalek, A. Regev and S. A. McCarroll, Cell, 2015, 161, 1202–1214 CrossRef CAS PubMed
- Y. Fu, H. Chen, L. Liu and Y. Huang, Anal. Chem., 2016, 88, 10795–10799 CrossRef CAS PubMed
- Q. Ruan, W. Ruan, X. Lin, Y. Wang, F. Zou, L. Zhou, Z. Zhu and C. Yang, Sci. Adv., 2020, 6, eabd6454–6465 CrossRef CAS PubMed
- C. C. Pritchard, H. H. Cheng and M. Tewari, Nat. Rev. Genet., 2012, 13, 358–369 CrossRef CAS PubMed
- Y. Song, T. Tian, Y. Shi, W. Liu, Y. Zou, T. Khajvand, S. Wang, Z. Zhu and C. Yang, Chem. Sci., 2017, 8, 1736–1751 RSC
- L. Mazutis, A. Araghi, O. Miller, J. Baret, L. Frenz, A. Janoshazi, V. Taly, B. Miller, J. Hutchison, D. Link, A. Griffiths and M. Ryckelynck, Anal. Chem., 2009, 81, 4813–4821 CrossRef CAS PubMed
- L. Li, M. Lu, Y. Fan, L. Shui, S. Xie, R. Sheng, H. Si, Q. Li, Y. Wang and B. Tang, Chem. Commun., 2019, 55, 10404–10407 RSC
- S. Guo, W. N. Lin, Y. Hu, G. Sun, D. T. Phan and C. H. Chen, Lab Chip, 2018, 18, 1914–1920 RSC
- Y. Zeng, K. M. Koo, A. G. Shen, J. M. Hu and M. Trau, Small, 2021, 17, e2006370 CrossRef PubMed
- A. D. Griffiths and D. S. Tawfik, Trends Biotechnol., 2006, 24, 395–402 CrossRef CAS PubMed
- H. Liu, X. Qian, Z. Wu, R. Yang, S. Sun and H. Ma, J. Mater. Chem. B, 2016, 4, 482–488 RSC
- E. Y. Liu, S. Jung, D. A. Weitz, H. Yi and C. H. Choi, Lab Chip, 2018, 18, 323–334 RSC
- Z. Zhu and C. J. Yang, Acc. Chem. Res., 2017, 50, 22–31 CrossRef CAS PubMed
- J. Vega, P. Elischer, T. Schneider and U. Häfeli, Nanomedicine, 2013, 8, 265–285 CrossRef PubMed
- F. Bian, J. Wu, H. Wang, L. Sun, C. Shao, Y. Wang, Z. Li, X. Wang and Y. Zhao, Small, 2018, 14, e1803551 CrossRef PubMed
- M. Bai, F. Chen, X. Cao, Y. Zhao, J. Xue, X. Yu, C. Fan and Y. Zhao, Angew. Chem., Int. Ed. Engl., 2020, 59, 13267–13272 CrossRef CAS PubMed
Footnote |
| † Electronic supplementary information (ESI) available. See DOI: 10.1039/d1sc05304c |
| This journal is © The Royal Society of Chemistry 2022 |