 Open Access Article
Design and testing of an ozonolysis reactor module with on-the-fly ozone degassing under flow conditions†
Nicole C.
Neyt
ab,
C. Johan
van der Westhuizen
ab,
Jenny-Lee
Panayides
 b and
Darren L.
Riley
 *a
*a
aDepartment of Chemistry, Natural and Agricultural Sciences, University of Pretoria, Pretoria, 0028, South Africa. E-mail: darren.riley@up.ac.za
bPharmaceutical Technologies, Council for Scientific and Industrial Research Future Production: Chemicals, Meiring Naudé Road, Pretoria, South Africa 0184
First published on 17th March 2022
Abstract
Ozonolysis is an attractive, efficient, and green means of introducing oxygen containing functionalities using only oxygen and electricity. Unfortunately, safety issues associated with the accumulation of dissolved ozone and potentially explosive ozonides coupled with an oxygen rich reaction atmosphere have limited its integration into large scale process reactions. Herein we report on the development and testing of a prototype flow-based ozonolysis reactor which allows on-the-fly removal of ozone and oxygen negating the need for a downstream degassing step and allowing the continuous processing of intermediate ozonides in a safe manner. The approach lends itself to being able to telescope directly into downstream reactions without concern for the effect of residual ozone and minimises contact between the oxygen rich ozone atmosphere and the reaction mixture. The prototype was shown to remove between 98.5 and 99.7% of residual ozone-oxygen on-the-fly and its performance was demonstrated through the ozonolysis of several alkenes to afford a range of oxygen containing functional groups in good to high yields.
Introduction
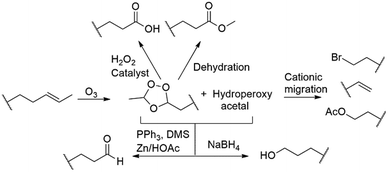
During the past decade flow chemistry and the application of continuous flow technology has made a fundamental impact on research and laboratories globally. It is considered a valuable alternative to traditional batch processing primarily because of its ease of use and control. The complementary relationship between chemistry and technology development has been highlighted by continuous flow processing over the past few years, with constant advancements in microreactor designs and architecture.1 This on-going growth from round bottom flask to flow chemistry reactors has led to the integration of new concepts in mixing, dosing, heat transfer and processing in general.2,3Ozonolysis is a clean and efficient way to introduce oxygen containing functional groups, involving only oxygen and electricity. The reaction involves the formation of 1,2,4-trioxolanes, which is followed by an exothermic quenching step wherein the 1,2,4-trioxolane intermediate is treated with various reducing and oxidizing reagents, making it possible to produce a variety of functionalities such as carboxylic acids, esters, aldehydes and alcohols (Scheme 1). The use of ozone instead of alternative metal counter species such as osmium tetroxide makes the transformation intrinsically environmentally benign, however a major concern in ozonolysis chemistry remains the hazards associated with the use of ozone.
Most critically, the major safety concerns revolve around i) the accumulation of dissolved ozone in the reaction mixture which is both toxic and highly reactive, ii) the formation of potentially explosive ozonide intermediates, iii) the use of an oxygen rich atmosphere in conjunction with organic solvents and iv) the use of ozone under pressure which is associated with explosive decomposition.4,5 To circumvent these safety issues risk management needs to be considered and numerous safeguard steps should be followed. A comprehensive overview of these risks is presented by Roth and co-workers in their article detailing the scale-up ozonolysis of β-pinene.5 The most pertinent of these is arguably the need to work at low temperatures, typically cryogenic and at high dilution. The required use of low temperatures in particular makes ozonolysis even more undesirable due to associated energy costs and decreased reagent and gas solubility.
Due to safety and efficiency limitations, the use of traditional batch ozonolysis is seldom integrated into large scale process reactions, however the possibility of utilizing continuous processing techniques for ozonolysis reactions have emerged over the past decade, with several examples having already been highlighted.6–16 The translation of ozonolysis reactions to flow is attractive as the intrinsic nature of the technology should allow one the opportunity to continually process the reactive ozonide species produced. That being said, on a practical level, this is not always easy to realise. In most instances the reaction mixture needs to be degassed to remove excess ozone, typically, prior to the introduction of the quenching reductant or oxidant. This degassing is commonly performed offline and as a result one continues to be faced with the issue of handling appreciable quantities of potentially explosive ozonides and an ozone rich reaction mixture.
In this paper we have highlighted a continuous flow ozonolysis reactor prototype which facilitates on-the-fly removal of ozone gas. The design improves the safety profile of the reaction by (i) reducing the volume of the reaction mixture containing dissolved ozone, (ii) by making continual downstream ozonide processing more achievable and (iii) by limiting the volume of the reaction mixture exposed to the oxygen rich atmosphere required during ozonolysis.
Results and discussion
1.1 Reactor design, setup and operation
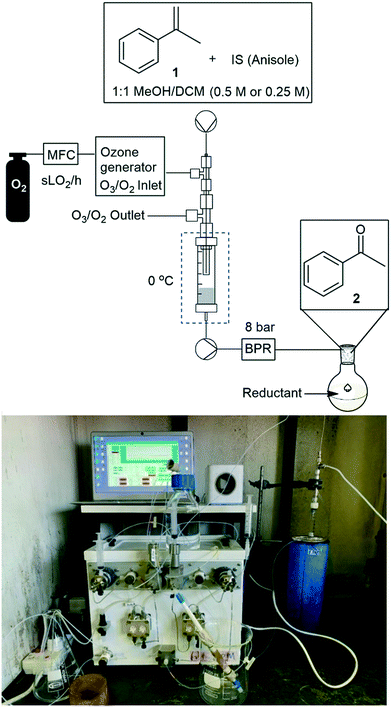
The envisaged reactor was designed to perform small scale (mg to g) ozonolysis reactions in a safe, yet continuous manner under flow conditions with the removal of excess ozone on-the-fly. The reactor was based on an aspirating solvent swapper published by the Ley group in 2013 (ref. 17) and was constructed from commercially available stainless steel tubing, Swagelok® fittings and a modified glass Omnifit® column (see the ESI† for a full list of components and a prototype construction description).Operationally, an HPLC pump (Uniqsis Binary Pump) was used to introduce a reagent stream through a 1/16′′ stainless steel tube (shown as liquid in, in Fig. 1 and represented by blue arrows in Fig. 2) which is mounted inside a 1/8′′ stainless steel tube thorough which an oxygen–ozone gas mixture is introduced using a commercial ozone generator (MP8000) and a SmartTrak 100 mass flow controller (MFC) (shown as gas in, in Fig. 1 and represented by red arrows in Fig. 2). The gas mixture is then introduced to the reaction mixture in an annular fashion in a short 3 mm long “reaction zone” prior to being aspirated into a modified Omnifit® column (shown as liquid out, in Fig. 1). This approach allows the hydroperoxyl reagent stream to collect in the Omnifit® column, from where it is continuously pumped, again using an HPLC pump (Uniqsis Binary Pump) into a vessel or a second column housing a quenching reductant or oxidant. Concurrently, on-the-fly removal of the gas mixture is realised by mounting the 1/8′′ stainless steel tube housing the gas and reagent streams inside a 1/4′′ PTFE tube which terminates at a Swagelok® union tee through which the gas is vented (shown as gas out, in Fig. 1).
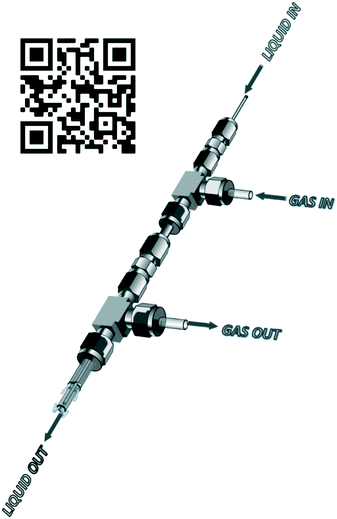 | ||
| Fig. 1 Overview of reactor operation – external view. QR code for prototype assembly Video S1.† | ||
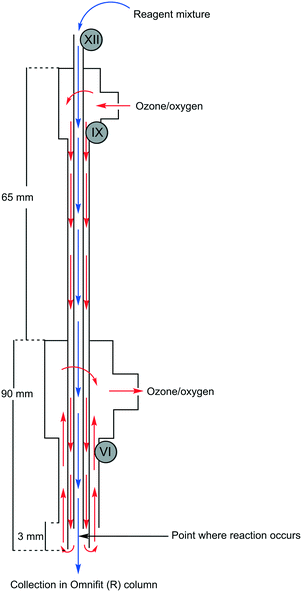 | ||
| Fig. 2 Overview of reactor operation – internal view showing flow paths. Roman numerals refer to parts list found in the ESI.† | ||
Several advantages can be drawn from the reactor operations including i) on-the-fly removal of the oxygen–ozone gas mix negating the need for downstream degassing, ii) the ability to telescope directly into follow-up stages without concern for the influence of residual ozone, iii) the approach greatly limits the accumulation of explosive intermediary ozonides which are continuously quenched upon leaving the reactor, and iv) the design limits the exposure of the reaction mixture to the oxygen rich reaction atmosphere with only 1–5 mL of solvent being exposed to the oxygen–ozone atmosphere in the Omnifit® column at any point in time.
That being noted there is potential for product and/or solvent loss to occur in the aspirating design if material is carried out of the module in the fast-flowing gas stream. Furthermore, at the reactor scale investigated, we are limited to temperatures above −30 °C, below which rapid evaporative cooling can result in the “freezing” of the reaction mixture in the narrow tubes of the reactor which would prove challenging.
1.2 Assessment of the on-the-fly removal of ozone gas
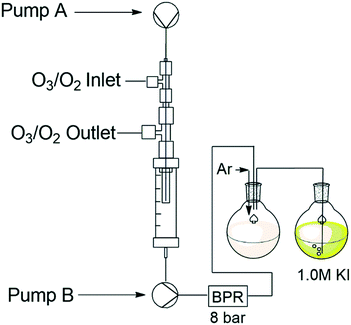
In order to assess if the unreacted ozone was vented on-the-fly, we needed to estimate the amount of gas (ozone and oxygen) still present in the reaction stream after the reactor module and prior to the collection of the product. Several approaches have previously been reported for assessing the amounts of dissolved gasses in continuous flow gas–liquid systems.18–21 We elected to employ two approaches. In the first instance a bubble counting technique that uses computer vision was employed to estimate the amount of gassing out as the reaction stream exited the reactors BPR. In the second instance we employed the use of potassium iodide as a titratable indicator to calculate the amount of ozone present post reactor.Adapting this approach for our needs had two key challenges, firstly, Sudan red reacts with ozone and as such it is not suitable when using an ozone–oxygen mix. Secondly, in the case of the Ley approach the reaction mixture was heated under pressure to facilitate degassing on exiting the reactor. In our case even modest heating of the mixture to promote degassing was not feasible as one would be faced with the prospect of dichloromethane, which was used as part of the solvent mix, gassing out upon exiting the BPR.
To circumvent these issues, we decided to test the system only using a pure stream of oxygen, rationalising that this would give an adequate approximation of how the system would perform as the amount of ozone present at any time is significantly lower than the amount of oxygen. Furthermore, the reaction mixture pumped out of the Omnifit® column housing was pressurised to between 7 and 8 bar and allowed to warm to ambient temperature prior to exiting the BPR. In this instance it was hypothesised that the depressurisation and modest increase in temperature would result in efficient degassing of the reagent stream.
The code employed by the Ley group was adjusted for our application needs and programmed to measure the volume of bubbles in real time after they passed through the BPR (see ESI†). A standard Raspberry Pi camera module was installed as detailed in Fig. 3 and the amount of oxygen that gassed out was recorded during a 5 minute run. After 5 minutes the average amount of gas remaining was expressed as a percentage relative to the volume of the reagent stream.
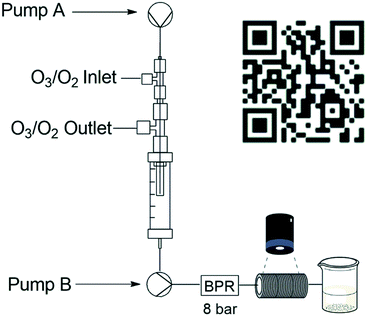 | ||
| Fig. 3 Reactor setup for bubble count detection with QR code for bubble counting Video S2.† | ||
The total percentage was then used to estimate the total volume of gas post-reactor relative to the total volume of gas introduced into the reactor. The apparatus involved wrapping several metres of PTFA tubing, amounting to a total volume of 22 mL, around a rectangular support and gluing it in place. A small quantity of Sudan red dye (10%) was used to visualize the bubbles present during the experiment (Video S2 – see ESI†). The oxygen gassing out from the flow system was determined at three different MFC gas flow rates (1.0, 0.5 and 0.3 sL h−1), and in each instance, the flow rate of the liquid reaction stream was tested at 1.0, 0.5 and 0.25 mL min−1 (Table 1). It was determined that during a 5 minute run at 1 sL h−1, 5% of the post collect volume was present as gas, equating to 0.3% (see ESI† for calculation example) of gas output relative to gas input (Table 1, entry 1). This value increased marginally as the gas flow rate decreased relative to the reagent stream flow rate to a high of 1.55% at a gas flow rate of 0.3 sL h−1 and a reagent flow rate of 1.0 mL min−1. Across the range we considered the gas present in the output stream to be negligible and it suggests that in the operational range investigated, only minimal amounts of oxygen and therefore ozone would remain dissolved in the reaction stream after the second pump.
| Entry | Reagent stream flow rate (mL min−1) | Gas flow rate (sL h−1) | Avg. percentage gas present | % gas output vs. % gas input |
|---|---|---|---|---|
| 1 | 1.0 | 1.0 | 4.99 | 0.3 |
| 2 | 0.5 | 1.0 | 8.28 | 0.25 |
| 3 | 0.25 | 1.0 | 9.98 | 0.15 |
| 4 | 1.0 | 0.5 | 7.36 | 0.44 |
| 5 | 0.5 | 0.5 | 6.53 | 0.78 |
| 6 | 1.0 | 0.3 | 7.73 | 1.55 |
The ozone generator was set to its maximum output (8 g h−1) and the process was run for 60 min while introducing the ozone–oxygen gas stream at a flow rate of 1 sL h−1 and the solvent stream (MeOH![[thin space (1/6-em)]](https://www.rsc.org/images/entities/char_2009.gif) :
:![[thin space (1/6-em)]](https://www.rsc.org/images/entities/char_2009.gif) DCM 1
DCM 1![[thin space (1/6-em)]](https://www.rsc.org/images/entities/char_2009.gif) :
:![[thin space (1/6-em)]](https://www.rsc.org/images/entities/char_2009.gif) 1) at 0.5 mL min−1. The presence of ozone was qualitatively shown through the generation of the yellow colouration associated with the formation of iodine (see ESI† for images). Titration of the mixture with sodium thiosulfate revealed only trace amounts of ozone (3 × 10⁻⁵ mmol, ∼0.001 g) (see ESI†). Repeating the test under the same conditions in the presence of a substrate α-methylstyrene (1) (0.25 M) revealed similar results. Alternatively, feeding the reagent stream directly into a 1.0 M solution of potassium iodide reveals ozone to be present in slightly higher levels (2 × 10⁻⁴ mol, ∼0.01 g) suggesting that some of ozone–oxygen gas mix remains dissolved in the liquid phase, albeit at negligibly levels.
1) at 0.5 mL min−1. The presence of ozone was qualitatively shown through the generation of the yellow colouration associated with the formation of iodine (see ESI† for images). Titration of the mixture with sodium thiosulfate revealed only trace amounts of ozone (3 × 10⁻⁵ mmol, ∼0.001 g) (see ESI†). Repeating the test under the same conditions in the presence of a substrate α-methylstyrene (1) (0.25 M) revealed similar results. Alternatively, feeding the reagent stream directly into a 1.0 M solution of potassium iodide reveals ozone to be present in slightly higher levels (2 × 10⁻⁴ mol, ∼0.01 g) suggesting that some of ozone–oxygen gas mix remains dissolved in the liquid phase, albeit at negligibly levels.
Finally, the process was repeated under analogous conditions by pumping a 10% potassium iodide solution in methanol through the reactor. In this instance the contents of the Omnifit® column rapidly turned orange and precipitated out of solution. The results obtained further supported that the reactor was operating as intended and that the ozone–oxygen gas mix was efficiently been vented on-the-fly.
We next turned our attention to the demonstration of the prototype through a series of model studies involving the ozonolysis of α-methylstyrene (1) to afford acetophenone (2) (Fig. 5).
1.3 Model reaction study
Initially we conducted several optimisation studies for the conversion of α-methylstyrene 1 to acetophenone 2 under batch conditions. The reactions were performed at −78 °C according to literature, by bubbling a stream of ozone (MP8000 ozone generator set to 100% ozone generation, 8 g h−1) into a round bottom flask containing 1 in DCM/MeOH (1![[thin space (1/6-em)]](https://www.rsc.org/images/entities/char_2009.gif) :
:![[thin space (1/6-em)]](https://www.rsc.org/images/entities/char_2009.gif) 1).24 The reaction was stopped when the solution started turning blue indicating the presence of unreacted ozone. Finally, reductive workup conditions using dimethylsulfide (DMS) were implemented to afford the required ketone acetophenone 2. Optimisations revealed that acetophenone 2 could be produced in a best yield of 93% when ozone was introduced at a flow rate of 0.7 sL h−1 when performed at a 0.5 M concentration with a total reaction time of 7 min 27 s.
1).24 The reaction was stopped when the solution started turning blue indicating the presence of unreacted ozone. Finally, reductive workup conditions using dimethylsulfide (DMS) were implemented to afford the required ketone acetophenone 2. Optimisations revealed that acetophenone 2 could be produced in a best yield of 93% when ozone was introduced at a flow rate of 0.7 sL h−1 when performed at a 0.5 M concentration with a total reaction time of 7 min 27 s.
Thereafter, various conditions were studied under flow to determine the validity and viability of the reactor assembly (Fig. 5), including reagent and ozone flow rates, concentration, and reaction time (Table 2). In the reactor the reaction is presumed to occur almost instantaneously in the 3 mm “reaction zone” after which time the gas and reagent streams are aspirated on entry into the Omnifit® column and the reaction stream is then pumped out of the column into a stirred vessel housing the reductant DMS. As the design prevented the build-up of potentially hazardous ozonides, we felt that there was minimal risk associated with increasing the reaction temperature from cryogenic ranges to 0 °C.
| Entrya | MFC flow rateb (sL h−1) | Reagent flow rate (mL min−1) | Conc.c [M] | Total operation timec (min) | Yieldd % |
|---|---|---|---|---|---|
| 2 | |||||
| a Reductant, DMS, (1.5 equiv.). b MP8000 ozone generator set to 100% (8 g O3 per h). c Total reagent volume processed 10 mL for 0.25 M and 5 mL for 0.5 M. d Reaction were completed on a 300 mg scale with 300 mg internal standard added with a total reaction volume of 30 mL. | |||||
| 1 | 1.0 | 1.0 | 0.5 | 30 | 67.1 |
| 2 | 1.0 | 0.5 | 0.5 | 60 | 71.3 |
| 3 | 1.0 | 0.25 | 0.5 | 120 | 86.0 |
| 4 | 0.75 | 1.0 | 0.5 | 30 | 35.7 |
| 5 | 0.75 | 0.5 | 0.5 | 60 | 50.5 |
| 6 | 0.1 | 0.25 | 0.5 | 120 | 44.3 |
| 7 | 1.0 | 1.0 | 0.25 | 30 | 52.2 |
| 8 | 1.0 | 0.9 | 0.25 | 34 | 58.8 |
| 9 | 1.0 | 0.7 | 0.25 | 43 | 68.8 |
| 10 | 1.0 | 0.6 | 0.25 | 50 | 68.1 |
| 11 | 1.0 | 0.5 | 0.25 | 60 | 97.6 |
| 12 | 0.5 | 1.0 | 0.25 | 30 | 45.6 |
Critically, the nature of the prototype's design necessitated that a dichloromethane–methanol solvent system was required, as the use of pure dichloromethane typically resulted in gradual freezing of the reagent stream in the reagent delivery tubing and thereafter in the Omnifit® column and ultimately resulted in reactor failure (see photo in ESI†). Furthermore, as the system is open in nature the reagent stream collecting in the Omnifit® column is subject to evaporation, which on longer runs resulted in the fluid level in the column slowly dropping over time. To circumvent this, the valve feeding the reagent stream to pump B was connected to a solvent reservoir and periodically switched to “solvent only” for a few minutes to allow the column to refill (when visual inspection revealed a drop in the reagent level). Finally, as there was potential for product loss to the fast-moving gas stream upon aspiration, an internal standard was added to the reaction mixture to monitor and quantify any loss of material.
Several conclusions can be drawn from these optimisation studies, namely, i) decreasing the reagent flow rate while maintaining the gas flow rate affords higher conversions (Table 2, see trend for entries 1–3 and 4–5), and ii) higher gas flow rates and slower reagent stream flow rates afford increased conversions by means of example, at an oxygen flow rate of 0.1 sL h−1 and a reagent flow rate of 0.25 mL min−1 a maximum conversion of 44% can be observed (Table 2, entry 6), while increasing the oxygen flow rate to 1.0 sL h−1 and maintaining the reagent flow stream at 0.25 mL−1 min affords an increase in conversion to 86% (Table 2, entry 3) interestingly, increasing the oxygen flow rates above 1.0 sL h−1 then showed a consistent decrease in conversion. These observations may seem counterintuitive; however, we believe that the trends observed are arising primarily due to mass transfer limitations.
Critically, it could be argued that loss of material to the fast-flowing gas phase may play a contributing role to the observed trends, however, as this loss is mechanical in nature it should only affect isolated yields. As such reaction performance was monitored by LCMS and conversions are reported.
During the optimization studies the ozone generator was set to produce 8 g O3 per h for all experiments. A subtlety to be noted is that because a fixed amount of ozone is being produced per unit time, increasing or decreasing the flow rate does not change the amount of ozone delivered per unit time, it instead dilutes or concentrates the ozone. As a result, increasing the flow rate of the gas phase while maintaining the flow rate of the liquid phase has the effect of diluting the ozone while simultaneously decreasing the contact time between the liquid and gas phases. This is made clearer when contrasting the performance of different entries in Table 2. In the case of entries 1 and 4 the flow rate of the gas phase decreases from 1.0 sL h−1 to 0.75 sL h−1 while the flow rate of the liquid phase is kept constant at 0.5 mL min−1 (0.5 M, 0.5 mmol min−1). This equates in both cases to 6.4 mmol of ozone been delivered per minute, however, in the case of entry 1 the flow rate of the gas phase is 16.7 mL min−1 whereas in the case of entry 2 it is 12.5 mL min−1 (see ESI† for examples of calculations).
As result, increasing the flow rate dilutes the ozone and reduces the contact time between the gas and liquid phases (assuming the flow rate of the liquid phase is kept constant) leading to a decrease in mass transfer between the gas and liquid phases. Conversely, decreasing the gas flow rate concentrates the ozone and increases the contact time between the gas and liquid phases. It may therefore be instinctive to presume that incrementally increasing the ozone concentration and lowering the flow rate would continue to lead to increased yields, until perhaps complete conversion is observed. The situation is however more complicated as the available surface area in the reactor does not increase to accommodate the increase in ozone. As a result, one is again faced with a decrease in mass transfer between the liquid and gas phases. This is supported by the observed decrease in conversions as the flow rate of the gas phase is reduced while keeping the liquid phase flow rate constant (Table 2, entries 1 vs. 4, 2 vs. 5 and 3 vs. 6).
The situation is somewhat simpler when the gas flow rate is kept constant, and the liquid flow rate is altered (Table 2, entries 1–3, 4–5 and 7–11). In such instances, the concentration of both the gas and liquid phases remains constant but reducing the flow rate of the liquid phase increases the stoichiometric equivalents of ozone relative to the substrate (1) leading to increased yields.
Further results were obtained by decreasing the reagent concentration to 0.25 M (Table 2, entries 7–12), with up to 98% conversion obtained at 1 sL h−1 and 0.5 mL min−1 (Table 2, entry 11). In this case a clear trend does not appear to be general and in contrast when the flow rates of 1 sL h−1 and 1.0 mL min−1 are applied at 0.5 M and 0.25 M respectively a decrease in conversion is noted (Table 2, entries 1 and 7).
On the basis of the trends reported above, a gram scale experiment (1.18 g, 20 mL of stock solution) was completed with the following parameters: a concentration of 0.5 M, a reagent stream flow rate of 0.25 mL min−1, a gas flow rate of 1 sL h−1 and a temperature of 0 °C. The 0.5 M concentration was chosen for the scale-up, providing a more attractive productivity rate despite the observed yield of 86% being lower than that of 98% achieved at 0.25 M. Upon exiting the reactor, the product material was collected and immediately treated with the reductant DMS, after which time the reaction mixture was left to stir for 12 hours. After purification by means of simple extraction the product was isolated in 85% yield equating to a production rate of 4.7 mmol h−1. The loss of anisole (internal standard) observed during the optimisation reactions suggested that there was some product loss occurring with the ozone gas stream. As such, a second gram-scale reaction was attempted wherein the vented gas stream was passed through a trap cooled to −78 °C, with the aim of capturing any material lost due to the volatility of the solvents and material. The contents of the trap were collected and processed with the main bulk of the reaction affording the desired acetophenone in 96% yield (5.3 mmol h−1). Interestingly, this performance is essentially the same as that when performed at 0.25 M, albeit on larger scale suggesting that the difference in performance at 0.5 M vs. 0.25 M is negligible and primarily arising from an increased loss of material in the aspirated gas stream under more concentrated conditions.
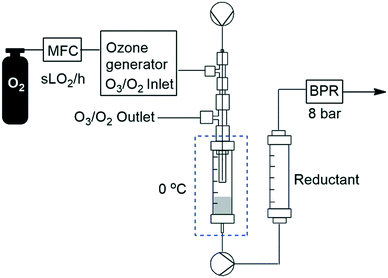
In order to facilitate a truly continuous process that could be telescoped into downstream reactions, we then turned our attention to replacing the post reactor stirred flask which housed the noxious reductant DMS with a suitable solid-supported reductant housed in a packed-bed reactor. The packed-bed reactor was conveniently housed between the HPLC pump and the BPR after the ozonolysis reactor's Omnifit® column (Fig. 6). A screen of several polymer supported reductants including thiodipropionic acid, triphenyl phosphine and Quadrapure® thiourea was undertaken with polystyrene supported triphenyl phosphine performing best (77% yield) followed by Quadrapure® thiourea (62%) when performed at a flow rate of 0.25 mL min−1 and a gas flow rate of 1.0 sL h−1.
1.4 Reaction scope expansion
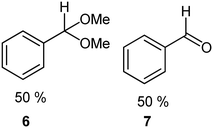
We next turned our attention to assessing the scope of the approach with regards to accessing different oxygen containing functional groups. One of two approaches were employed with regards to the downstream quenching with a reductant, in the first instance the originally employed direct quenching of the reaction mixture was achieved by collecting the reaction stream in a stirred vessel housing the reductant, in the second instance we employed the use of a packed-bed reactor housing a supported reductant of choice (Fig. 6).Unless otherwise noted, the reaction conditions employed were 0 °C, 0.25 M, 0.25 mL min−1 reagent flow rate and 1.0 sL h−1 gas flow rate (MP8000 set to 100%) (Table 3, entries 1–11). In the case of entries 1–5 aldehydes and ketones could be accessed in good to high yields when employing the use of either DMS or polystyrene supported triphenyl phosphine as a reductant. In situ protection of aldehydes as acetals was also realised in good to high yields (entries 6–10) by employing an acid catalyst in the form of tosic acid or amberlyst-15 and a suitable reductant, typically DMS. Alcohols could also be accessed (entry 11) by pumping the reagent stream through a packed-bed reactor housing solid-supported borohydride exchange resin. It should be noted that the required use of methanol as a co-solvent in certain instances resulted in partial acetal formation in the absence of an acid source (Table 3, entries 4 and 11).
| Entry | Starting material | Reductant (1.5 equiv.) | Product | Isolated yield% |
|---|---|---|---|---|
| a A mixture of both the aldehyde and acetal were obtained, conversion of the two compounds determined by 1H NMR. b 0.5 mL min−1, 0.5 M, 1.0 sL h−1 O2/O3, 0 °C with 10 mL of reagent used for the reaction. c A mixture of the acetal and alcohol were obtained, conversion of the two compounds determined by 1H NMR, furthermore the reaction mixture was collected in a round bottom flask containing PS-NaBH4 and stirred overnight. d See ESI† for conditions, a mixture of mono and di-ozonolyzed products obtained. e Isolated yield of 15. f 16 was obtained offline, by collecting the reaction mixture in a round bottom flask containing PS-PPh3 and stirring overnight. g Isolated material as a mixture. | ||||
| 1a |

|
PS-PPh3 |

|
76 |
| 2 |

|
PS-PPh3 |

|
77 |
| 3 |

|
DMS |

|
95 |
| 4a |

|
PS-PPh3 |
|
78g |
| 5b |

|
DMS |

|
80 |
| 6 |

|
TsOH/DMS |

|
71 |
| 7 |

|
TsOH/DMS |

|
75 |
| 8 |

|
Amb-15/PS-TDPA |

|
79 |
| 9 |

|
Amb-15/DMS |

|
86 |
| 10 |

|
TsOH/DMS |

|
63 |
| 11c |

|
PS-NaBH4 |
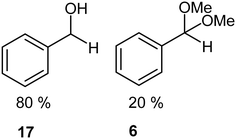
|
65g |
| 12d |

|
TsOH/DMS |

|
22e |
| 13f |

|
PS-PPh3 |

|
54 |
Interestingly, and despite the fact that the reactor only has a short 3 mm “reaction zone”, we were still able effect varying degrees of control pertaining to performing selective ozonolysis reactions. This is exemplified by entry 12 (Table 3) wherein the ozonolysis of cyclooctadiene 13 could be controlled to afford the partially ozonolysed diacetal 15 in a best conversion of 48% (determined from H1 NMR, see ESI†). Unfortunately, isolation of the species proved challenging, with a best isolated yield of only 22%. The partial ozonolysis of cyclooctadiene is of further interest as the resulting diacetal 15 can be further reacted to access 4,4-dimethoxybutanal 16, a useful building block which has traditionally proved challenging to access synthetically (Table 3, entry 13). The preparation of 16 utilizing a selective ozonolysis approach under batch conditions has previously been reported by Li, Wang and Zhao,24 where they observed the formation of 16 in 82% yield over two steps employing a selectively ozonolysis approach. Unfortunately, in subsequent years this approach could not be replicated in the labs of Michael,25 Nicolaou26 or Vincent27 who, following the same protocol were only able to prepare 16 in 31%, 40% and 13% yields respectively. Similarly in our hands, under both batch and flow conditions we were only able to prepare 16 in 12% isolated yield over two steps.
Conclusions
To conclude we have successfully demonstrated the potential of a bespoke reactor designed to perform ozonolysis reactions. The prototype allowed ozonolysis reactions to be performed under flow conditions with improved safety facilitated by on-the-fly degassing of residual oxygen and ozone which removed in excess of 98.5% of the gas mix introduced into the reactor.A model study showing the reduction of α-methylstyrene 1 to acetophenone 2 affording optimized yields of 86% and 98% when performed at 0.5 M and 0.25 M concentrations respectively (gas flow rate 1 sL h−1, reagent stream flow rate 0.25 mL min−1, 0 °C). In the former case, the yield could be increased to 96% when the vented gas line was passed through a cold trap (−78 °C) to collect any material lost to the gas stream after aspiration.
The reactor design improves the overall safety of the reaction by i) limiting the accumulation of ozone in the reaction mixtures liquid phase, ii) preventing the accumulation of potentially explosive ozonides, and iii) limiting the volume of the reaction mixture exposed to an oxygen rich atmosphere. A further advantage associated with the design includes the ability to directly telescope the reaction stream into downstream reactions without concern for the influence of residual ozone.
Critically, depending on the set-up conditions employed loss of material can occur as some of the reagent stream can be carried away in the venting gas stream. However, this loss can be mitigated by passing the vented gas stream through a cold trap to capture lost materials or through careful selection of reagent concentration.
We were able to directly access a range of functional groups including aldehydes, ketones, acetals and alcohols in good to high yields (unoptimized) by pumping the output reaction stream through packed-bed reactors housing appropriate polymer supported reagents. Finally, despite the short 3 mm reaction path-length we were also able to effect control in the case of the partial ozonolysis of cyclooctadiene 13.
Further investigations into the modification of this reactor design to facilitate both up-scaling and improved selectivity are currently on-going in our labs.
Conflicts of interest
There are no conflicts to declare.Acknowledgements
This work was supported by the National Research Foundation of South Africa (NRF, grant number 87893 and 106959), the University of Pretoria (University, Science Faculty Research Councils and Research and Development Program), and Pelchem Pty Ltd. Opinions expressed in this publication and the conclusions arrived at are those of the authors and are not necessarily attributed to the NRF. The authors would like to gratefully acknowledge Mamoalosi Selepe for NMR spectroscopy services, Chris van der Westhuyzen for project discussions and Uniqsis Ltd for flow equipment.Notes and references
- N. C. Neyt and D. L. Riley, Application of Reactor Engineering Concepts in Continuous Flow Chemistry: A Review, React. Chem. Eng., 2021, 6, 1295–1326 RSC
.
- K. F. Jensen, Flow chemistry—microreaction technology comes of age, AIChE J., 2017, 63(3), 858–869 CrossRef CAS
.
- I. Rossetti and M. Compagnoni, Chemical reaction engineering, process design and scale-up issues at the frontier of synthesis: Flow chemistry, Chem. Eng. J., 2016, 296, 56–70 CrossRef CAS
.
- C. A. Hone, D. M. Roberge and C. O. Kappe, The Use of Molecular Oxygen in Pharmaceutical Manufacturing: Is Flow the Way to Go?, ChemSusChem, 2017, 10(1), 32–41 CrossRef CAS
.
- M. Vaz, D. Courboin, M. Winter and P. M. C. Roth, Scale-Up of Ozonolysis using Inherently Safer Technology in Continuous Flow under Pressure: Case Study on β-Pinene, Org. Process Res. Dev., 2021, 25(7), 1589–1597 CrossRef CAS
.
- M. Irfan, T. N. Glasnov and C. O. Kappe, Continuous flow ozonolysis in a laboratory scale reactor, Org. Lett., 2011, 13(5), 984–987 CrossRef CAS
.
- Y. Wada, M. A. Schmidt and K. F. Jensen, Flow distribution and ozonolysis in gas−liquid multichannel microreactors, Ind. Eng. Chem. Res., 2006, 45(24), 8036–8042 CrossRef CAS
.
- M. O'Brien, I. R. Baxendale and S. V. Ley, Flow ozonolysis using a semipermeable teflon AF-2400 membrane to effect gas−liquid contact, Org. Lett., 2010, 12(7), 1596–1598 CrossRef
.
- D. M. Roberge and M. Nobis, Mastering ozonolysis: Production from laboratory to ton scale in continuous flow, Chim. Oggi – Chem. Today, 2011, 29(1), 56–59 Search PubMed
.
- M. Roydhouse, A. Ghaini, A. Constantinou, A. Cantu-Perez, W. Motherwell and A. Gavriilidis, Ozonolysis in flow using capillary reactors, Org. Process Res. Dev., 2011, 15(5), 989–996 CrossRef CAS
.
- M. D. Roydhouse, A. Ghaini, A. Constantinou, A. Cantu-Perez, W. B. Motherwell and A. Gavriilidis, Ozonolysis in flow using capillary reactors, Org. Process Res. Dev., 2011, 15(5), 989–996 CrossRef CAS
.
- M. Roydhouse, W. Motherwell, A. Constantinou, A. Gavriilidis, R. Wheeler, K. Down and I. Campbell, Ozonolysis of some complex organic substrates in flow, RSC Adv., 2013, 3(15), 5076–5082 RSC
.
- K. Lee, H. Lin and K. F. Jensen, Ozonolysis of quinoline and quinoline derivatives in a Corning low flow reactor, React. Chem. Eng., 2017, 2(5), 696–702 RSC
.
- D. Polterauer, D. M. Roberge, P. Hanselmann, P. Elsner, C. A. Hone and C. O. Kappe, Process intensification of ozonolysis reactions using dedicated microstructured reactors, React. Chem. Eng., 2021, 2253–2258 RSC
.
- S. Hübner, U. Bentrup, U. Budde, K. Lovis, T. Dietrich, A. Freitag, L. Küpper and K. Jähnisch, An Ozonolysis−Reduction Sequence for the Synthesis of Pharmaceutical Intermediates in Microstructured Devices, Org. Process Res. Dev., 2009, 13(5), 952–960 CrossRef
.
- R. S. Atapalkar, P. R. Athawale, D. Srinivasa Reddy and A. A. Kulkarni, Scalable, sustainable and catalyst-free continuous flow ozonolysis of fatty acids, Green Chem., 2021, 23(6), 2391–2396 RSC
.
- B. J. Deadman, C. Battilocchio, E. Sliwinski and S. V. Ley, A prototype device for evaporation in batch and flow chemical processes, Green Chem., 2013, 15(8), 2050–2055 RSC
.
- M. O'Brien, An automated colorimetric inline titration of CO2 concentrations in solvent flow streams using a Teflon AF-2400 tube-in-tube device, J. CO2 Util., 2017, 21, 580–588 CrossRef
.
- G. Wu, E. Cao, S. Kuhn and A. Gavriilidis, A Novel Approach
for Measuring Gas Solubility in Liquids Using a Tube-in-Tube Membrane Contactor, Chem. Eng. Technol., 2017, 40(12), 2346–2350 CrossRef CAS
.
- X. Duan, J. Tu, A. R. Teixeira, L. Sang, K. F. Jensen and J. Zhang, An automated flow platform for accurate determination of gas–liquid–solid reaction kinetics, React. Chem. Eng., 2020, 5(9), 1751–1758 RSC
.
- P. B. Cranwell, M. O'Brien, D. L. Browne, P. Koos, A. Polyzos, M. Peña-López and S. V. Ley, Flow synthesis using gaseous ammonia in a Teflon AF-2400 tube-in-tube reactor: Paal–Knorr pyrrole formation and gas concentration measurement by inline flow titration, Org. Biomol. Chem., 2012, 10(30), 5774–5779 RSC
.
- M. O'Brien, N. Taylor, A. Polyzos, I. R. Baxendale and S. V. Ley, Hydrogenation in flow: Homogeneous and heterogeneous catalysis using Teflon AF-2400 to effect gas–liquid contact at elevated pressure, Chem. Sci., 2011, 2(7), 1250–1257 RSC
.
- P. Koos, U. Gross, A. Polyzos, M. O'Brien, I. Baxendale and S. V. Ley, Teflon AF-2400 mediated gas-liquid contact in continuous flow methoxycarbonylations and in-line FTIR measurement of CO concentration, Org. Biomol. Chem., 2011, 9(20), 6903–6908 RSC
.
- P. Li, J. Wang and K. Zhao, A convenient preparation of 4, 4-dimethoxybutanal by ozonolysis of 1, 5-cyclooctadiene, J. Org. Chem., 1998, 63(9), 3151–3152 CrossRef CAS
.
-
D. L. Riley, Synthesis of amphibean indolizidine alkaloids and related compounds from enaminone precursors, Doctoral Thesis, University of the Witwatersrand, 2007 Search PubMed
.
- K. Nicolaou, W. E. Brenzovich, P. G. Bulger and T. M. Francis, Synthesis of iso-epoxy-amphidinolide N and des-epoxy-caribenolide I structures. Initial forays, Org. Biomol. Chem., 2006, 4(11), 2119–2157 RSC
.
- M. Jarret, H. Abou-Hamdan, C. Kouklovsky, E. Poupon, L. Evanno and G. Vincent, Bioinspired Early Divergent Oxidative Cyclizations toward Pleiocarpamine, Talbotine, and Strictamine, Org. Lett., 2021, 23(4), 1355–1360 CrossRef CAS PubMed
.
Footnote |
| † Electronic supplementary information (ESI) available. See DOI: 10.1039/d1re00554e |
| This journal is © The Royal Society of Chemistry 2022 |

