 Open Access Article
Identification of four novel flavonoid adducts in Arabidopsis thaliana (L.) exposed to isobutyl S-2-diethylaminoethyl methylphosphonothiolate as potential plant exposure biomarkers†
Zhongfang Xinga,
Ruiqian Zhanga,
Zhehui Zhaob,
Liangliang Wanga,
Ling Yuana,
Huilan Yua,
Yang Yanga,
Yuntao Yanga,
Shilei Liu *a and
Chengxin Pei*a
aState Key Laboratory of NBC Protection for Civilian, Beijing 102205, China. E-mail: liu_shilei@lacricd.com; 13911708106@163.com
bDepartment of Medicinal Chemistry, State Key Laboratory of Bioactive Substances and Functions of Natural Medicines, Institute of Materia Medica, Chinese Academy of Medical Sciences & Peking Union Medical College, Beijing 100050, China
First published on 8th December 2022
Abstract
As vegetation is part of our lives, plants are good candidates as indicators of toxic chemicals. Numerous components in plants may react with toxic chemicals to produce exposure biomarkers. Plant biomarkers formed by the modification of endogenous plant components by chemical warfare agents have not been reported. In this article, the model plant Arabidopsis thaliana (L.) was exposed to the nerve agent isobutyl S-2-diethylaminoethyl methylphosphonothiolate (iBuVX). Some characteristic ions were identified by liquid chromatography–high resolution mass spectrometry and their product ion mass spectra were recorded and interpreted. Some interesting fragmentation pathways were revealed including neutral loss of glucoside, rhamnose and isobutylene. Isobutyl methylphosphonyl modified flavonoids were deduced from assignment of product ions. The element components and the accurate mass of the product ions matched well with those of the proposed fragmentation pathways. The binding site of the nerve agent on flavonoids was proved to be the hydroxyl group on the benzene ring of the flavonoids by density functional theory computation and by the synthesis of the reference chemical, which was confirmed by 1H–31P HMBC NMR. The phosphonyl-modified flavonoids were evaluated for specificity in different plants. Four new flavonoid adducts as potential biomarkers were identified in the leaves of the iBuVX-exposed plant, which provided a novel strategy for the retrospective analysis of organophosphorus exposure for chemical weapon verification and forensic analysis.
Introduction
Organophosphorus nerve agents (OPNAs) are a type of chemical warfare agent (CWA) with high toxicity that can inhibit the activity of acetylcholinesterase.1,2 Although 193 countries have signed the Chemical Weapons Convention (CWC), their illegal use in terrorist attacks and regional conflicts is still a threat all over the world.3,4 Different kinds of matrices including environmental samples, biomedical samples and newly emerging plant samples can be used to verify the OPNAs misuse.Plants have a widespread existence and have been used as detectors for xenobiotic molecules.5 Because the easiness to access and no animal ethics issues, plants attracted the attention of the Organisation of Prohibition of Chemical Weapons (OPCW). In recent years, OPCW has launched a challenge among laboratories worldwide to investigate plant exposure biomarkers.6 There are abundant components in plants, some of which may react with xenobiotic toxicants to produce characteristic exposure biomarkers. However, reported researches only focused on the absorption or transformation of OPNAs degradation products among different parts of plants1,7–9 and no researches about plant biomarkers formed by the exposure to toxic chemicals has been reported to the best of our knowledge.
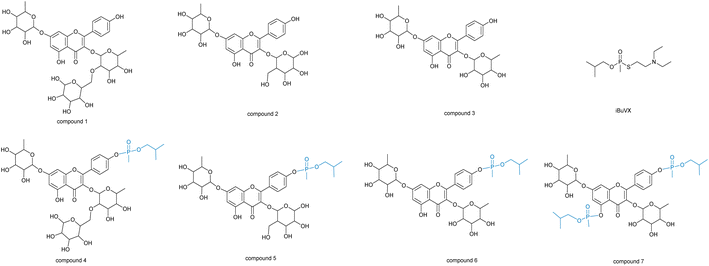
The well-known nerve agents of V-type and G-type are listed in the annex on chemicals of the CWC. Since V-type nerve agents have higher toxicity than the G-type, we exposed model plant Arabidopsis thaliana (L.) to a typical V-type nerve agent of isobutyl S-2-diethylaminoethyl methylphosphonothiolate (iBuVX). In the leaves of the exposed plant, three flavonoids (kaempferol-3-O-rhamnosyl-glucoside 7-O-rhamnoside, compound 1; kaempferol-3-O-glucoside 7-O-rhamnoside, compound 2; and kaempferol-3-O-rhamnoside 7-O-rhamnoside, compound 3) were modified to produce four O-isobutyl methylphosphonyl adducts (compound 4–7), which were identified by liquid chromatography–high resolution mass spectrometry (LC–HRMS) and unambiguously confirmed by the synthesis of the reference chemical.
The four flavonoid adducts are specific to iBuVX exposed plants, which makes them the novel potential plant biomarkers for the retrospective analysis of organophosphorus exposure. Relevant chemical structures were listed in Chart 1.
Experimental section
Reagents and chemicals
All solvents were purchased from Sigma Aldrich (Co., Ltd, USA) either in HPLC-MS-grade or in analytical-grade. Compound 3 (99.5%) was purchased from Shanghai Yuanye Bio-Technology (Co., Ltd, China). IBuVX was microsynthesized in-house of the Laboratory of Analytical Chemistry of Research Institute of Chemical Defence according to the reported method10 and the structure and purity (>95%) were confirmed by NMR (the structure with atoms numbing was shown in Fig. S1 of the ESI†).For iBuVX:
1H{13C} NMR (CDCl3, 599.97 MHz) (data were shown in Fig. S2 and Table S1 of the ESI†): δ 0.96 (d, 6H), 1.04 (t, 6H), 1.81 (d, 3H), 1.95 (m, 1H), 2.58 (q, 4H), 2.74 (m, 2H), 2.91 (m, 2H), 3.76 (m, 1H), 3.89 (m, 1H).
13C{1H} NMR (CDCl3, 150.86 MHz) (data were shown in Fig. S3 and Table S2 of the ESI†): δ 11.86, 18.75, 18.79, 20.00 (d), 28.18, 28.99 (d), 47.01, 53.69 (d), 71.04 (d).
31P{1H} NMR (CDCl3, 242.86 MHz) (data were shown in Fig. S4 of the ESI†): δ 54.00.
Plant culture and nerve agent exposure
The plants of Arabidopsis thaliana (L.) (ecotype Columbia) were grown in a controlled greenhouse. Each leaf of the five-week-old plant was administrated by 1–2 μL (about 1–2 mg) of iBuVX. After exposure, plants were cultured for 7 more days.Preparation of plant extracts
The leaves from exposed Arabidopsis thaliana (L.) (about 20–30 mg) were harvested and cut into small pieces into a 5 mL centrifugation tube. For the extraction, the plant materials were homogenized with 1.0 mL of acetonitrile using a high-speed disperser operating at 5000 rpm for 1 min (Type XHF-DY, NINGBO Scientz BITOTECHNOLOGY, Co., LTD, China). Afterwards, the sample was vortexed for 10 min and centrifuged for 5 min at 13![[thin space (1/6-em)]](https://www.rsc.org/images/entities/char_2009.gif) 500 rpm. Supernatants were separated and kept at −20 °C till analysis with LC-HRMS.
500 rpm. Supernatants were separated and kept at −20 °C till analysis with LC-HRMS.
LC-MS analyses
LC-MS analyses were performed on an 1200 HPLC system coupled to an Agilent 6520 Quadrupole-Time of Flight (Q-TOF) mass spectrometer (Agilent Technologies, USA). A Zorbax Eclipse Plus C18 column with dimensions of 150 mm × 2.1 mm and 5.0 μm particle size was used. The temperature of column was set at 30 °C. A gradient elution was applied using 0.1% formic acid in water as solvent (A) and 0.1% formic acid in acetonitrile as solvent (B). The following solvent gradient was applied: from 2% B to 12% B within 2 min, to 15% B within 6 min, to 60% B within 9 min, to 100% B within 9 min, to 2% B within 1 min, and hold for 5 min. The flow rate was set at 0.25 mL min−1 and 1–5 μL of samples were injected. Mass resolution was set to 10![[thin space (1/6-em)]](https://www.rsc.org/images/entities/char_2009.gif) 000. The electrospray and fragmentor voltages were set at 3500 and 120 V, respectively. The gas temperature was maintained at 350 °C. The drying gas (nitrogen) flow rate and nebulizer gas (nitrogen) pressure were 8 L min−1 and 30 psi, respectively. MS/MS product ion scans were carried out at a collision energy of 5–45 V. Ultra-high-purity nitrogen was used as the collision gas. The scan was performed in positive mode in the m/z range 25–1000 with the scan time of 0.77 second.
000. The electrospray and fragmentor voltages were set at 3500 and 120 V, respectively. The gas temperature was maintained at 350 °C. The drying gas (nitrogen) flow rate and nebulizer gas (nitrogen) pressure were 8 L min−1 and 30 psi, respectively. MS/MS product ion scans were carried out at a collision energy of 5–45 V. Ultra-high-purity nitrogen was used as the collision gas. The scan was performed in positive mode in the m/z range 25–1000 with the scan time of 0.77 second.
Evaluation of reactivity by theoretical calculation
Firstly, GMMX3.0 module in GaussView6 (ref. 11) was used to search the conformations of the three flavonoids. Based on the lowest energy conformations obtained, Gaussian16 (ref. 12) was used to optimize the geometric structures and analyze the frequency at the theoretical levels of B3LYP-D3(BJ)/def2TZVP.13,14The condensed electrophilicity Fukui function f−k and the condensed local nucleophilicity index NkNu were calculated using the following formula:15
| f−k = qk(N − 1) − qk(N) | (1) |
| NkNu = NNuf−k = (EHOMO(Nu) − EHOMO(TCE))f−k | (2) |
The qk(N) and qk(N − 1) are the atomic charges at the sites of atom k in the neutral molecule and the molecule lost an electron, respectively. EHOMO(Nu) and EHOMO(TCE) are the highest occupied orbital energies of neutral molecule and tetracyanoethylene, respectively.
The synthesis of isobutyl methylphosphonyl modified 3-O-rhamnoside 7-O-rhamnoside
To a mixture of compound 3 (116 mg, 0.20 mmol) and K2CO3 (41.4 mg, 0.30 mmol) in 2.0 mL of dimethyl formamide, isobutyl methylphosphonochloridate (51 mg, 0.30 mmol) was added dropwise at 0 °C. The reaction solution was stirred at 0 °C for 1 hour, and then warmed to the room temperature. After stirring at room temperature for 4 more hours, the mixture was diluted with 10 mL of methanol and was adjusted to pH = 3 with acetic acid. The products were purified with medium pressure liquid chromatography using chloroform and methanol as eluent. The isobutyl methylphosphonyl modified 3-O-rhamnoside 7-O-rhamnoside (32 mg, 22%) was sealed in brown vial until analysis.NMR analyses
An Avance 600 MHz NMR spectrometer (Bruker BioSpin, Germany) was employed for 1H{13C}13C{1H}, 31P{1H} and 2D 1H–31P HMBC NMR experiments. The samples were added into 5 mm NMR tubes. All the spectra were recorded at 25 °C using CDCl3 (for iBuVX) or dimethyl sulfoxide-d6 (DMSO, for compound 6) as the solvent. Topspin3.6.3 and MestReNova was used for data processing. The pulse sequence was hmbcgplpndqf for 2D experiment. The H–P long range coupling constant was 8 Hz.Evaluation of the specificity as exposure biomarkers
The leaves from Nicotiana tabacum Linn., Pisum sativum Linn., Tagetes erecta Linn. and Arabidopsis thaliana (L.) which were not exposed to iBuVX were also prepared and analysed as the methods described in “Preparation of plant extracts” and “LC-MS analyses”. The extracted ion chromatograms (EICs) of the nonexposed samples for the quasi-molecular ions of the four corresponding flavonoid adducts have been used to investigate if there were any interferences in the retention time windows.Safety consideration
Safety consideration is very important as nerve agents are highly lethal chemicals. IBuVX should be handled in a fume hood by professionals with appropriate protective equipment. All materials in direct contact with iBuVX should be decontaminated thoroughly with a bleach solution.Results and discussion
Screening and structural deducing of phosphonyl modified flavonoids in Arabidopsis thaliana (L.) exposed to iBuVX by HRMS
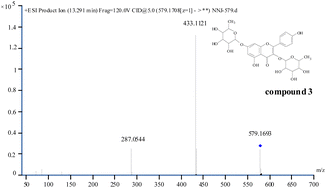
Flavonoids, a kind of secondary metabolites of plants, are widely existed in different plants.16–19 Flavonoids contain a lot of active hydroxyls which may react with nerve agents to produce potential biomarkers. In this article, LC-HRMS was used to analyse flavonoids in Arabidopsis thaliana (L.) which was not exposed to iBuVX. Three flavonoids (compound 1, compound 2 and compound 3) were identified16–19 in which compound 3 was the most abundant and compound 1 was the least in the leaves (extracted ion chromatograms (EICs) of [M + H]+ were shown in Fig. 1(a)). Product ion mass spectrum (PIMS) of compound 3 was shown in Fig. 2, the deviations between calculated and observed m/z values of each fragment ions were shown in Table 1. The loss between m/z 579 and m/z 433 was 146, and the loss between m/z 579 and m/z 287 was 146 + 146, which was due to the neutral loss of rhamnose structure (rhamnose, C6H12O4, 148 Da). The product ion mass spectrum and deviations of compound 1 and compound 2 were shown in Fig. S5, S6, Tables S3 and S4 of the ESI†.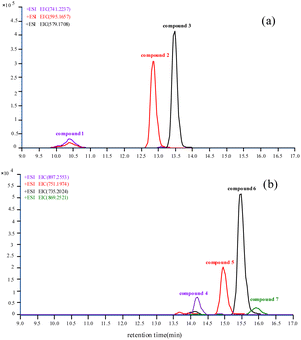 | ||
| Fig. 1 EICs of the three flavonoids not exposed to iBuVX (a) and the characteristic ions formed after exposure to iBuVX (b) in the leaves of Arabidopsis thaliana (L.). | ||
| Fragment | Calculated m/z | Observed m/z | Deviation (ppm) |
|---|---|---|---|
| [M + H]+ | 579.1708 | 579.1693 | −2.65 |
| [M + H–C6H10O4]+ | 433.1129 | 433.1121 | −1.91 |
| [M + H–2C6H10O4]+ | 287.0550 | 287.0544 | −2.15 |
After exposing to iBuVX, some different characteristic ions were screened by LC–HRMS in the extracts of the leaves and PIMS of the characteristic ions were recorded. The EICs of [M + Na]+ were shown in Fig. 1(b) and the PIMS of the m/z 735.2024 was shown in Fig. 3. PIMS of other characteristic ions were shown in Fig. S7–S9 in ESI.† From PIMS of the characteristic ions, some interesting fragmentation pathways were proposed including neutral loss of glucoside, rhamnose and isobutylene. Isobutyl methylphosphonyl modified flavonoids were deduced from assignment of the PIMS. The element components and the accurate mass of the product ions matched well with those of the proposed fragmentation pathways. The deviations between calculated and observed m/z values of each fragment derived from compound 6 in the extract of leaves exposed to iBuVX were shown in Table 2 (deviations of other flavonoid adducts were shown in Tables S5–S7 of the ESI†).
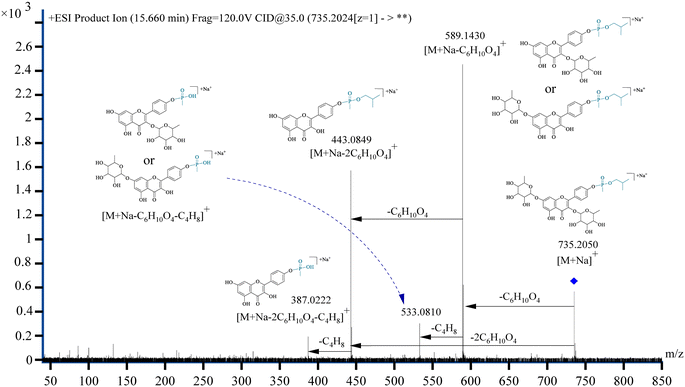 | ||
| Fig. 3 Product ion mass spectrum of m/z 735.2024 in the Arabidopsis thaliana (L.) exposed to iBuVX and the proposed fragmentation. | ||
| Fragment | Calculated m/z | Observed m/z | Deviation (ppm) |
|---|---|---|---|
| [M + Na]+ | 735.2024 | 735.2050 | 3.59 |
| [M + Na–C6H10O4]+ | 589.1445 | 589.1430 | −2.71 |
| [M + Na–C6H10O4–C4H8]+ | 533.0819 | 533.0810 | −1.83 |
| [M + Na–2C6H10O4]+ | 443.0866 | 443.0849 | −4.11 |
| [M + Na–2C6H10O4–C4H8]+ | 387.0240 | 387.0222 | −5.01 |
Totally four new flavonoid adducts (shown in Chart 1) as potential biomarkers were screened. Compound 4 was the phosphonyl modified product from compound 1, compound 5 from compound 2 and compound 6 from compound 3, respectively. From the EICs (Fig. 1(b)) it showed that the peak area of compound 6 was the highest, which is consistent with that of the corresponding flavonoid (Fig. 1(a)). Small amount of di-phosphonyl modified compound 3 was also detected as compound 7.
Unambiguous identification of the phosphonyl-modified sites on flavonoids by theoretical calculation and synthesis of the reference chemical
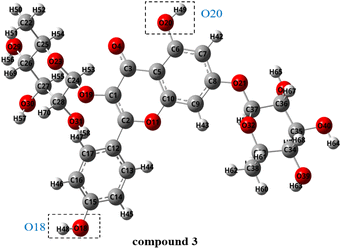
Through the analysis of the PIMS (as shown in Fig. 3), it can be concluded that the binding site of iBuVX on flavonoids was on the parent nucleus which has two hydroxyl groups. In order to specify which hydroxyl group was modified, density functional theory computation was performed to compare the reactivity of the two hydroxyl groups. The lowest energy conformation of compound 3 without virtual frequencies was shown in Fig. 4, which showed that O18 had relatively low steric hindrance (the lowest energy conformations of compound 1 and compound 2 were shown in the Fig. S10 in ESI†).f−k and NkNuare important parameters to characterize the nucleophilicity, the larger the value, the stronger the nucleophilicity. The calculated results were listed in Table 3. It showed that f−k and NkNu of O18 has stronger nucleophilicity than O20 and is more likely to attack the P atom in the molecule of iBuVX.
| Molecule | f−O18 | f−O20 | NO18Nu | NO20Nu |
|---|---|---|---|---|
| a f−18 and f−20 are the condensed electrophilicity Fukui function of O18 and O20 atom, respectively.b NO18Nu and NO20Nu are the condensed local nucleophilicity index of O18 and O20 atom, respectively. | ||||
| Compound 1 | 0.056 | 0.039 | 0.193 | 0.134 |
| Compound 2 | 0.064 | 0.030 | 0.238 | 0.115 |
| Compound 3 | 0.048 | 0.037 | 0.160 | 0.124 |
In order to unambiguously confirm the modification site of the adducts, compound 6 was synthesized in-house. The purified compound 6 (the structure with atoms numbing was shown in Fig. S11 of the ESI†) was identified by NMR and HRMS. 1D NMR and 2D HMBC NMR experiments were employed to confirm its structure with the results listed below.
1H{13C} NMR (599.97 MHz) (data were shown in Fig. S12 and Table S8 of the ESI†): δ 0.78 (m, 3H), 0.91 (d, 6H), 1.13 (d, 3H), 1.70 (d, 3H), 1.90 (m, 1H), 2.91 (m, 1H), 3.13 (m, 1H), 3.30 (t, 1H), 3.43 (m, 2H), 3.64 (m, 1H), 3.84 (m, 1H), 3.90 (m, 2H), 4.00 (s, 1H), 4.64 (m, 1H), 4.71 (t, 1H), 4.80 (d, 1H), 4.92 (d, 1H), 5.00 (d, 1H), 5.14 (d, 1H), 5.28 (s, 1H), 5.56 (s, 1H), 6.49 (d, 1H), 6.81 (d, 1H), 7.40 (d, 2H), 7.94 (d, 2H), 12.46 (s, 1H).
13C{1H} NMR (150.86 MHz) (data were shown in Fig. S13 and Table S9 of the ESI†): δ 11.04 (dd), 17.90, 18.38, 18.93, 29.06, 70.26, 70.50, 70.59, 70.68, 70.72, 71.19, 71.50, 72.03, 72.20 (d), 95.19, 98.89, 100.10, 102.64, 106.49, 120.99, 126.87, 131.33, 135.96, 152.77, 156.76, 157.19, 161.42, 162.37, 178.53.
31P{1H} NMR (242.86 MHz) (data were shown in Fig. S14 of the ESI†): δ 28.38 (d).
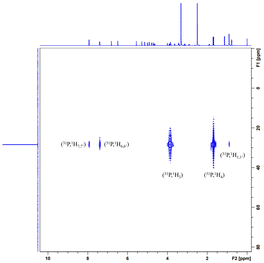
2D 1H–31P HMBC was shown in Fig. 5. The peaks of 7.40 ppm and 7.94 ppm in 1H NMR spectrum is correlated with the peak in 31P spectrum, which clearly indicating that the modified site is O18 atom. The PIMS of m/z 735.2024 of the synthesized compound 6 (the spectrum was shown in Fig. S15 of ESI†) was recorded and identical with that from the extract of leaves. The mass deviations of fragments were less than 3.36 ppm (data were shown in Table S10 of the ESI†).
Specificity of the flavonoid adducts as exposure biomarkers
Specificity is very important as any response near the retention time of analytical targets will interfere with indication of the chemical exposure. Endogenous interference was examined with leaf samples from different plants, Nicotiana tabacum Linn., Pisum sativum Linn., Tagetes erecta Linn. and Arabidopsis thaliana (L.). As shown in the EICs (Fig. S16–S19 in ESI†), there was no any interference peak in the nonexposed samples in the corresponding retention time windows of the flavonoid adducts, which showed the good specificity of the phosphonyl flavonoids as potential plant biomarkers.Conclusions
In conclusion, Arabidopsis thaliana (L.) exposed to iBuVX was harvested and investigated. Four new phosphonylated flavonoid adducts were identified by LC-HRMS. General ESI fragmentation pathways were proposed and discussed. The product ions of each parent ion matched well with the proposed fragmentation pathways. Density functional theory computation was used to compare the reactivity of the two hydroxyl groups on the parent nucleus of flavonoids. The reference chemical of the phosphonylated flavonoid was synthesized to unambiguously confirm the proposed structure.It is very difficult to accurately specify the modification site of the xenobiotic chemicals on the plant endogenous components because of the existence of multiple active-sites. The possible sites were proposed but left undetermined in the ref. 20. The phosphonylated flavonoids were unambiguously identified with the modification site clearly confirmed in this article. Identification of the flavonoid adducts in the plant provides a novel strategy for the retrospective analysis of nerve agent exposure in CWC verification and forensic analysis.
Author contributions
Zhongfang XING: writing – original draft; Ruiqian Zhang: writing – review & editing; Zhehui Zhao: resources; Liangliang Wang: formal analysis for density functional theory computation; Ling Yuan: formal analysis for NMR; Huilan Yu: formal analysis for LC-HRMS; Yang Yang: project administration; Yuntao Yang: supervision; Shilei Liu: conceptualization, methodology; Chengxin Pei: conceptualization, methodology.Conflicts of interest
There are no conflicts to declare.Acknowledgements
The authors gratefully acknowledged the financial support from the State Key Laboratory of NBC Protection for Civilian (Grant No. SKLNBC2019-12).References
- M. R. Gravett, F. B. Hopkins, M. J. Main, A. J. Self, C. M. Timperley, A. J. Webb and M. J. Baker, Anal. Methods, 2013, 5, 50–53 RSC.
- Y. Bao, Q. Liu, J. Chen, Y. Lin, B. Wu and J. Xie, J. Chromatogr. A, 2012, 1229, 164–171 CrossRef CAS PubMed.
- V. Pitschmann, Toxins, 2014, 6, 1761–1784 CrossRef PubMed.
- M. R. Gravett, F. B. Hopkins, A. J. Self, A. J. Webb, C. M. Timperley and M. J. Baker, Proc. R. Soc. A, 2014, 470, 1–14 CrossRef PubMed.
- M. H. Wong, J. P. Giraldo, s.-Y. Kwak, V. B. Koman, R. Sinclair, T. T. S. Lew, G. Bisker, P. Liu and M. S. Strano, Nat. Mater., 2017, 16, 264–274 CrossRef CAS PubMed.
- The OPCW Plant Biomarker Challenge, https://www.opcw.org/biomarker Search PubMed.
- B. Sarvin, M. Himmelsbach, T. Baygildiev, O. Shpigun and I. Rodin, J. Chromatogr. A, 2019, 214–219 CrossRef CAS PubMed.
- T. Baygildiev, M. Vokuev, A. Braun, I. Rybalchenko and I. Rodin, J. Chromatogr. B, 2021, 1162, 122452 CrossRef CAS PubMed.
- M. Vokuev, T. Baygildiev, A. Braun, A. Frolova, I. Rybalchenko and I. Rodin, J. Chromatogr. A, 2022, 1685, 1–9 CrossRef.
- J. Ledgard, The Preparatory Manual of Chemical Warfare Agents, 3rd edn, 2012 Search PubMed.
- R. Dennington, T. A. Keith and J. M. Millam, GaussView, Version 6.1, Semichem Inc. KS, 2016 Search PubMed.
- M. J. Frisch, G. W. Trucks and H. B. Schlegel, Gaussian 16, Revision C.01, Semichem Inc., CT, 2016 Search PubMed.
- J. Witte, M. Goldey, J. B. Neaton and M. Head-Gordon, J. Chem. Theory Comput., 2015, 11, 1481–1492 CrossRef CAS PubMed.
- F. Weigend and R. Ahlrichs, Phys. Chem. Chem. Phys., 2005, 7, 3297–3305 RSC.
- L. Wang, J. Ding, L. Pan, D. Cao, H. Jiang and X. Ding, Chemom. Intell. Lab. Syst., 2021, 217 Search PubMed.
- W. Wang, Master, Xihua University, 2020.
- P. Kachlicki, J. Einhorn, D. Muth, L. Kerhoas and M. Stobiecki, J. Mass Spectrom., 2008, 43, 572–586 CrossRef CAS PubMed.
- H. Zhao, Doctor, Nankai University, 2012.
- S. J. Bloor and S. Abrahams, Phytochemistry, 2002, 59, 343–346 CrossRef CAS PubMed.
- L. S. Raisová, R. Podlipná, B. Szotáková, E. Syslová and L. Skálová, Ecotoxicol. Environ. Saf., 2017, 141, 37–42 CrossRef PubMed.
Footnote |
| † Electronic supplementary information (ESI) available. See DOI: https://doi.org/10.1039/d2ra06879f |
| This journal is © The Royal Society of Chemistry 2022 |

