 Open Access Article
Creative Commons Attribution 3.0 Unported Licence
Ionothermal synthesis of activated carbon from waste PET bottles as anode materials for lithium-ion batteries†
Cyril O. Ehi-Eromosele *ab,
Chizoom N. Onwuchaab,
Samuel O. Ajayiab,
Georgian Melinted,
Anna-Lena Hansen
 a,
Sylvio Indris
 ac and
Helmut Ehrenberg
 ac
ac
aInstitute for Applied Materials (IAM), Karlsruhe Institute of Technology (KIT), 76344 Eggenstein-Leopoldshafen, Germany. E-mail: cyril.ehi-eromosele@covenantuniversity.edu.ng
bDepartment of Chemistry, Covenant University, PMB 1023, Ota, Nigeria
cHelmholtz Institute Ulm (HIU) Electrochemical Energy Storage, Helmholtzstrasse 11, 89081 Ulm, Germany
dInstitute of Nanotechnology (INT), Karlsruhe Institute of Technology (KIT), Hermann-von-Helmholtz-Platz 1, 76344 Eggenstein-Leopoldshafen, Germany
First published on 2nd December 2022
Abstract
Waste polyethylene terephthalate (PET) bottles have become a significant post-consumer plastic waste with attendant environmental problems. Hence, ionothermal synthesis has been used to prepare activated carbon (AC) anode materials from waste PET for both high performance and sustainable lithium-ion batteries (LIB). Particularly, using choline chloride deep eutectic salts (CU-DES) does not require post-synthesis washing and thereby reduces the complexity of the process and produces materials with unique low-surface area, higher levels of graphitization/ordering, and high nitrogen doping in the obtained ACs. The results show that the AC produced using CU-DES (PET-CU-A-ITP2) gave good electrochemical performance. Even though the material possesses a low surface area (∼23 m2 g−1), it displays a gravimetric capacity (GC) of ∼460 mA h g−1 and a coulombic efficiency (CE) of ∼53% in the 1st cycle and very good cycling performance with a capacity retention of 98% from the 2nd to the 100th cycle. The superior electrochemical performance of the PET-CU-A-ITP2 anode was found to be due to its better graphitization/ordering and dense structure which results in higher capacity, formation of less solid electrolyte interphase, and higher CE. These results show that dense carbons can be exploited as high-performance anodes in LIBs. Also, this research presents both a pathway for waste PET management and a waste-energy approach that could offer cheaper and greener LIBs to meet the sustainable development goals.
Introduction
The most effective energy storage system (ESS) for renewable energy is a lithium-ion battery (LIB) owing to its unparalleled high energy density, high power density, better portability, and non-memory effect when comparing it with other energy storage devices.1,2 As a result, it is the most suitable source of power for both portable devices such as smartphones, calculators, laptops, digital cameras, etc. and larger energy storage systems such as electrical grids and electric vehicles. LIBs are electrochemical rechargeable devices that involve the exchange or shuttling of lithium ions between the positive electrode (cathode) material and negative electrode (anode) material while the electronic current flows across the external load.3–8One of the most important components of LIBs and other ESS are the electrodes. Suitable electrode materials with novel structure are being exploited to improve their performance. This includes the preparation of electrode materials coupled with the development of synthesis methods that can tailor the required textural properties of the materials; and also provide greener and cheaper synthetic routes.9–11 Porous carbon-based materials find extensive applications in ESS because of their abundance, chemical and thermal stability, excellent conductivity, low weight, and tunable pore structure. Specifically, activated carbons (ACs) are very attractive due to their large specific surface area (SSA), large pore-volume, low-cost, and well-established methods for their preparation.12 Porous carbonaceous materials are mostly obtained from fossil-based carbon sources making them costly and environmentally unsustainable.12 Therefore, it is imperative to exploit and develop renewable derivatives and/or products to prepare porous ACs through economically viable and environmentally friendly approaches (i.e., through waste-to-value added product concept). Biomass materials, as cheap and sustainable precursors for the preparation of porous ACs, have been exploited as electrode materials in LIBs to attain a circular economy.12–14
Similarly, other abundant waste sources such as waste plastic can serve as cheap and sustainable starting-materials for the synthesis of porous ACs.15–18 Of particular interest in this regard is polyethylene terephthalate (PET) since it is a ubiquitous, non-biodegradable post-consumer polymer waste associated with severe environmental problems worldwide. In addition, the high amounts of carbon coupled with the small amounts of impurities in PET make it an attractive precursor for the preparation of ACs.16 Thus, converting PET wastes into valuable chemical products such as AC material has become an attractive way to not only manage PET wastes sustainably but most importantly, to achieve a circular economy. This suggests that PET bottles could serve as a raw material for the synthesis of porous AC which could find application in separation,19 catalysis,20 hydrogen storage,21 and as electrode materials in supercapacitor.22
Conventionally, there are two routes used for the preparation of porous ACs from PET wastes namely, the physical and chemical activation methods.16,18 The former one involves exposing the carbon precursor (PET wastes) to oxidizing gases such as water steam or CO2 at high temperature (usually between 600–1200 °C), while for the latter method, the carbon precursor is impregnated with an activating agent (KOH, NaOH or ZnCl2, etc.) before thermal treatment under inert conditions. Usually, before the application of either the physical or chemical activation methods, the PET waste is first converted into a carbon-rich matter through thermal treatment or pyrolysis. Though the physical activation method is environment-friendly, it leads to reduced particle and micro-domain sizes in the ACs which may be deleterious to the performance of the material. Moreover, the activation temperature is very high which makes the process energy and cost intensive. Comparatively, chemical activation gives lower temperatures of activation, shorter activation time, higher yields and higher specific surface area (SSA) over physical activation. Nevertheless, it still results in low yields of carbon and involves tedious washing processes (using large amounts of acid and water) to prevent corrosion. Also, the usage of activation reagents is excessive thereby limiting its commercial development and application.
Therefore, it is desirable to develop novel routes that are green, scalable and inexpensive for the efficient synthesis of porous ACs from abundant waste PET bottles. The ionothermal synthesis (IS) process combines simplicity, scalability, high yields and the possibility to tune the porosity of the AC materials. In IS, ionic liquids or deep eutectic salts (DES) are used as solvents or additives to improve the kinetics of carbonization/activation and to further increase the SSA of AC materials.23–25 This one-pot synthesis to prepare highly porous ACs simply requires aqueous washing of the as-obtained product for removal of the inorganic salts (DES or ionic liquids) after carbonization/activation of the carbon precursor. IS strategy has been used to obtain ultra-high yield porous AC from the pyrolysis of sugarcane bargasse soaked initially in ZnCl2/urea/KCl DES.25 Choline chloride–urea (CU) DES has been used as a dissolution solvent due to its solvation ability stemming from its rich hydrogen bond acceptors which can break intra- and inter-molecular hydrogen bonds.26 Particularly, CU-DES has been used in the valorisation of lignocellulosic biomass for delignification or breaking down its recalcitrant structure.27 Furthermore, since CU-DES contain rich nitrogen sources it can help to dope high amounts of nitrogen into the final carbon material framework, thereby improving its conductivity and electrochemical performance. Owing to these findings, CU-DES could be used as a solvent medium to prepare AC from waste PET bottles. It is entirely an organic solvent which can help increase the yield of the final AC material since it can also serve as a carbon source. For this reason, it is hypothesised that the use of CU-DES will not require any post-synthesis washings usually done with inorganic activating salt containing DES since it is expected to completely be degraded after carbonisation. Herein, a green ionothermal pyrolysis synthetic route using CU-DES is proposed to prepare ACs from waste PET bottles. Unlike most reports, no post-synthesis washing of the as-synthesised ACs was undertaken. Therefore, CU-DES can help to reduce the cost, complexity and toxicity of producing AC from waste PET, instead of using conventional activating chemicals, which is one of the motivations for this research. Also, this method produced high nitrogen-doped ACs that were dense and of appreciable yield which were then used as anode materials in LIB.
Experimental section
Materials
Post-consumer waste PET bottles were collected, air-dried and shredded to particle sizes of between 4 and 5 mm. The shredded PET pieces were washed again with water and air dried and stored in Ziploc bags and labelled PET-P. Choline chloride (98+%) was obtained from Alfa Aesar, urea from Merck, and other chemicals such as polyvinylidene fluoride (PVDF) and N-methyl-2-pyrrolidone (NMP) were obtained from Sigma Aldrich. Coin-type cells, Celgard separators, graphite (TIMCAL C-NERGY SFG 6 L), LP30 selectylite (BASF) electrolyte, aluminium, copper and lithium metal foils were used for electrode coating and coin cell assembling prior to electrochemical measurements.Ionothermal synthesis of activated carbons from waste PET bottles
ACs were prepared by ionothermal pyrolysis (ITP) of waste PET bottles following the modified procedures of Zou et al. and Pambel et al.23,25 The first step consists of the preparation of different mixtures of deep eutectic salt (DES). Choline chloride and urea were mixed in a molar ratio of 1![[thin space (1/6-em)]](https://www.rsc.org/images/entities/char_2009.gif) :
:![[thin space (1/6-em)]](https://www.rsc.org/images/entities/char_2009.gif) 2 inside a conical flask. The salt mixture, placed in an oil bath, was heated at 80 °C for 3 h with magnetic stirring at 500 rpm. The DES obtained was a clear homogeneous solution which was stored in a glass bottle and labelled CU-DES. In a typical procedure, 7.0 g of PET-P was mixed with 20 mL of CU-DES at room temperature to obtain the precursor (labelled PET-CU) that was used for both the annealing and pyrolysis carbonisation step. In the annealing step, PET-CU was placed in a muffle furnace and heated to 400 °C at a rate of 2 °C min−1 under air and this temperature was maintained for additional 2 h. Shiny black and coarse carbonaceous material was obtained which was ball-milled into fine powders at 500 rpm for 3 h using a FRITSCH ball-mill. The obtained powders were labelled PET-CU-A and used for further analysis. For comparison, the PET-P without impregnation with CU-DES was also annealed following the step above and was labelled PET-P-A. In the pyrolysis step, PET-CU was first stabilised by heating to 380 °C at a rate of 2 °C min−1 under air and this temperature was maintained for additional 4 min. After this short annealing step, the obtained material was ground and pyrolysed at 800 °C at a rate of 5 °C min−1 under nitrogen flow (0.55 L min−1) and this temperature was maintained for additional 1 h to carbonise and activate it. The obtained carbonaceous material was ball-milled into fine powders at 500 rpm for 3 h and it was labelled PET-CU-A-ITP2. For comparison, PET-P, without impregnation with CU-DES, was annealed and pyrolysed following the step above and was labelled PET-P-A-ITP2.
2 inside a conical flask. The salt mixture, placed in an oil bath, was heated at 80 °C for 3 h with magnetic stirring at 500 rpm. The DES obtained was a clear homogeneous solution which was stored in a glass bottle and labelled CU-DES. In a typical procedure, 7.0 g of PET-P was mixed with 20 mL of CU-DES at room temperature to obtain the precursor (labelled PET-CU) that was used for both the annealing and pyrolysis carbonisation step. In the annealing step, PET-CU was placed in a muffle furnace and heated to 400 °C at a rate of 2 °C min−1 under air and this temperature was maintained for additional 2 h. Shiny black and coarse carbonaceous material was obtained which was ball-milled into fine powders at 500 rpm for 3 h using a FRITSCH ball-mill. The obtained powders were labelled PET-CU-A and used for further analysis. For comparison, the PET-P without impregnation with CU-DES was also annealed following the step above and was labelled PET-P-A. In the pyrolysis step, PET-CU was first stabilised by heating to 380 °C at a rate of 2 °C min−1 under air and this temperature was maintained for additional 4 min. After this short annealing step, the obtained material was ground and pyrolysed at 800 °C at a rate of 5 °C min−1 under nitrogen flow (0.55 L min−1) and this temperature was maintained for additional 1 h to carbonise and activate it. The obtained carbonaceous material was ball-milled into fine powders at 500 rpm for 3 h and it was labelled PET-CU-A-ITP2. For comparison, PET-P, without impregnation with CU-DES, was annealed and pyrolysed following the step above and was labelled PET-P-A-ITP2.
Characterization
The product yields (%) were determined by obtaining the masses of the precursor (PET-P) and the obtained dried AC materials. The elemental analysis of the ACs were undertaken using a Vario micro cube from elementar with C, H, and N determined with the thermal conductivity detector while the value of S was detected by infrared detector. The SSA of the AC materials were measured by nitrogen adsorption isotherms at low temperatures (77.4 K) on a volumetric adsorption analyser (Micromeritics, Gemini VII version 5.03). Before the analysis, the samples were degassed under vacuum at 423 K. The SSA was obtained from the adsorption isotherms using the Brunauer–Emmett–Teller (BET) method. Thermogravimetric Analysis (TGA) coupled with Differential Scanning Calorimetry (DSC) was used to monitor the carbonisation/activation of PET-P and PET-CU samples using Simultaneous Thermal Analysis with combined FT-IR gas analysis operated under Ar-atmosphere (Netzsch Jupiter 449C) from 35–900 °C using a heating rate of 10 °C min−1. The structural characteristics of the ACs were obtained from their XRD patterns using a STOE Stadi P laboratory diffractometer equipped with a Cu source and with transmission geometry. Also, total scattering data of selected samples were collected on a STOE Stadi P diffractometer (Ag Kα1 radiation, λ = 0.559 Å), equipped with two MYTHEN flat plate detectors (Qmax = 18 Å−1, Qdamp = 0.011 Å−1). A NIST660b LaB6 standard and an empty capillary were measured under the same conditions to account for instrument contribution and to subtract the contribution from the glass capillaries, respectively. All samples were measured in 1.0 glass capillaries (Hilgenberg #10 glass). The calculation of the corresponding pair distribution functions was performed using the program pdfgetX3.28 In addition, a HORIBA LabRam Evolution HR (Laser wavelengths: HeNe-Laser (633 nm, 17 mW) Raman microscope was used to determine the degree of order of the carbons in these materials. The morphologies and elemental mapping of C, N, and O in the ACs were obtained by SEM-EDX Merlin microscope (Zeiss GmbH) and TEM scanning mode using a FEI Titan 80–300 microscope.Electrochemical measurements
The anode was prepared from a mixture of active materials (AC materials), carbon black, and PVDF in NMP in a weight ratio of 8![[thin space (1/6-em)]](https://www.rsc.org/images/entities/char_2009.gif) :
:![[thin space (1/6-em)]](https://www.rsc.org/images/entities/char_2009.gif) 1
1![[thin space (1/6-em)]](https://www.rsc.org/images/entities/char_2009.gif) :
:![[thin space (1/6-em)]](https://www.rsc.org/images/entities/char_2009.gif) 1, respectively after stirring the mixture for 4 h. The resulting slurry was coated on a copper foil with a wet thickness of 150 μm. The obtained material was dried in the vacuum oven at 80 °C overnight. This coated electrode film was cut into a disc (12 mm in diameter) for further tests. The electrochemical properties of the discs were tested using 2032 coin-type cells which were assembled in a glovebox (MBraun) flushed with argon gas. To assemble half cells, the as-prepared anode was used as the working electrode and lithium metal foil as the counter electrode which were separated by two Celgard 2325 (16 mm) separators, while BASF LP30 selectylite (1 M LiPF6 in a 1
1, respectively after stirring the mixture for 4 h. The resulting slurry was coated on a copper foil with a wet thickness of 150 μm. The obtained material was dried in the vacuum oven at 80 °C overnight. This coated electrode film was cut into a disc (12 mm in diameter) for further tests. The electrochemical properties of the discs were tested using 2032 coin-type cells which were assembled in a glovebox (MBraun) flushed with argon gas. To assemble half cells, the as-prepared anode was used as the working electrode and lithium metal foil as the counter electrode which were separated by two Celgard 2325 (16 mm) separators, while BASF LP30 selectylite (1 M LiPF6 in a 1![[thin space (1/6-em)]](https://www.rsc.org/images/entities/char_2009.gif) :
:![[thin space (1/6-em)]](https://www.rsc.org/images/entities/char_2009.gif) 1 volume ratio of ethylene carbonate and dimethyl carbonate) was used as the electrolyte.
1 volume ratio of ethylene carbonate and dimethyl carbonate) was used as the electrolyte.
The galvanostatic charge–discharge tests were performed in the voltage range of 0.01 and 2.8 V (vs. Li/Li+). The rate capability was measured by varying the cycling current density between 0.1–2.0 A g−1 for about 50 cycles. The cycling performance was measured by cycling the cells using a current density of 0.1 A g−1 for 100 cycles. The cyclic voltammetry measurements were performed using a scan rate of 0.1 mV s−1 in the voltage window of 0.1–2.8 V (vs. Li/Li+). A VMP3 multichannel potentiostat (Biologic, France) operating at 25 °C was used for all electrochemical tests.
Results
Optimisation of the ionothermal synthesis processes
The well-established method of obtaining AC from biomass and PET wastes is chemical activation which is usually undertaken in a single-step with pyrolysis to make the process less cumbersome.15–18,29 The synthesis of AC from waste PET bottles was done using the ionothermal pyrolysis (ITP) synthesis route. Deep eutectic salts (DES) have been used as eco-friendly solvents and porogens for the synthesis of AC from biomass.23,25 CU-DES has been the most widely used DES and the first to be studied as both choline and urea are naturally derived, biodegradable, very cheap and abundant.30 Choline chloride and urea forms a DES when mixed in a molar ratio of 1![[thin space (1/6-em)]](https://www.rsc.org/images/entities/char_2009.gif) :
:![[thin space (1/6-em)]](https://www.rsc.org/images/entities/char_2009.gif) 2 and at low temperature (i.e. 80 °C).31
2 and at low temperature (i.e. 80 °C).31
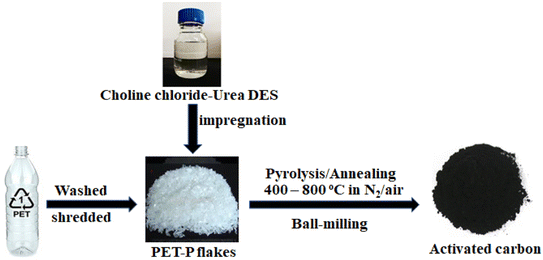
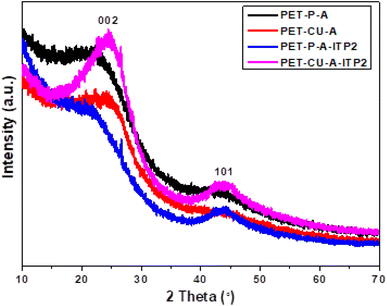
In the ITP process (as shown in Fig. 1), different operating parameters such as the impregnation with/without CU-DES, carbonisation/pyrolysis temperatures and durations, and pre-annealing/stabilisation temperatures both in air and nitrogen flow were optimised. Typically, different carbonisation/pyrolysis temperatures and duration were used to optimise the prepared AC materials. When PET-P and PET-CU were pyrolysed at 800 °C for 2 h under nitrogen atmosphere, the final products were mostly lost by sublimation while the residue had milkish colour. The same behavior was observed when the same precursors were annealed in a muffle furnace in the presence of air. Amorphous carbon with no clear characteristic graphite peaks in the XRD patterns were obtained when the pyrolysis temperature was reduced to 400 °C; the XRD reflections of the obtained carbons (PET-CU-P and PET-P-P) were very low in intensity and broad. However, when these precursors were annealed in the presence of air at 400 °C for 2 h, charred black products were obtained with XRD showing amorphous carbon with the two characteristic graphite peaks, though with low degree of graphitisation. These samples were named as PET-CU-A and PET-P-A. Notably, there was no smoke during PET-CU annealing (seen in PET-P) which can be traced to the presence of CU-DES. Since the previous pyrolysis/annealing treatments, mostly at 800 °C, resulted in the loss (sublimation) of the products, a stabilisation of the precursor at a lower temperature was introduced. It has been reported that polymeric materials such as PET require heating at low temperatures to transform into a stable structure that could withstand the high temperature pyrolysis treatment to form turbostratic carbons.32 Furthermore, Ko et al. suggested that the presence of oxygen in the structure of PET helps to withstand decomposition so that it can be carbonised as the oxygen atoms serve as linkages. Herein, PET-P and PET-CU were annealed at 380 °C for 4 min in air before transferring to a tube furnace for pyrolysis up to 800 °C for 1 h in nitrogen gas.33 No sublimation was seen with these pre-stabilised samples. These carbonaceous materials were named PET-P-A-ITP2 and PET-CU-A-ITP2, respectively. The results show that PET could either be carbonised or stabilised at low temperatures in the presence of air for extended and short-term durations, respectively to obtain carbonaceous materials (after pyrolysis for the pre-stabilised PET).
Material characterization
Thermal analysis
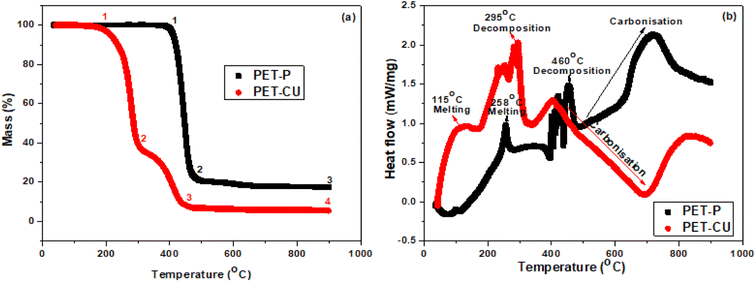
The thermal decomposition processes of PET-P impregnated with and without CU-DES were investigated by TGA and DSC. Fig. 2a shows the TGA profile obtained for the thermal analysis of PET-P and PET-CU between 35 and 900 °C, at a heating rate of 10 °C min under argon gas. The TGA profiles show that both samples had different decomposition stages labelled 1–4. The profile of PET-P shows two different decomposition stages with the first decomposition occurring at a much higher temperature and produced 23 wt% residue (between 1 and 2) while the subsequent carbonisation (between 2 and 3) resulted in 17 wt% carbonaceous materials. The profile of PET-CU shows three different decomposition stages with the first decomposition occurring at a lower temperature to produce 39 wt% residue (between 1 and 2), the second decomposition (between 2 and 3) produced 8 wt% residue which did not further change even after carbonisation (between 3 and 4). The second decomposition which is absent in the profile of PET-P could be due to the decomposition of the CU-DES which contributes to the enhancement of nitrogen doping in the final carbon material as will be shown in the elemental analysis. Also, the reduced initial decomposition temperature of the PET-CU compared to the PET-P indicates the influence of CU-DES in reducing the synthesis temperature for the preparation of AC.Fig. 2b shows the DSC profiles of the heat flow when PET-P and PET-CU were heated at temperatures between 35 and 900 °C. Three different endothermic peaks corresponding to the degradation regimes in their TGA profiles are observed for both samples. The melting, decomposition, and carbonisation occurred at much lower temperatures in the PET-CU sample compared to the PET-P. It can be seen that CU-DES helped to reduce the decomposition temperature of PET (as shown in the TG) and to reduce the carbonisation temperature, which could increase the yield of the final carbon material. CU-DES like other DES systems has rich hydrogen bond acceptors which can break intra- and inter-molecular hydrogen bonds thereby enhancing its dissolution ability.26 Therefore, CU-DES can aid the decomposition of PET which can be seen in the reduced carbonisation temperature of PET-CU compared to PET-P as shown in the DSC result.
Product yield and elemental analysis
The heat treatment conditions employed during ITP of PET, elemental analysis of obtained carbonaceous materials, and product yield are given in Table 1. The product yields of the CU-DES impregnated PET samples were slightly higher than for the pristine samples. The PET-CU-A and PET-P-A gave product yields of 17% and 15%, respectively. Furthermore, PET-CU-ITP pyrolysed at 400 °C gave a yield of 28% while PET-CU-A-ITP2 that was pre-annealed at 380 °C before pyrolysing at 800 °C gave a yield of 20%. The additional heat treatments resulted in lower yields probably due to structural rearrangement with the loss of volatiles and gases such as CO, CO2, NO2, CH4, etc.34| Sample | Temperature (°C) | Yield (%) | Elemental analysis (weight %) | |||||
|---|---|---|---|---|---|---|---|---|
| Annealing (A) | Ionothermal pyrolysis (ITP) | C | H | N | S | Residual | ||
| PET-P-A | 400 | — | 15 | 70.10 | 2.69 | 3.79 | 0.00 | 23.42 |
| PET-CU-A | 400 | — | 17 | 65.89 | 2.83 | 15.72 | 0.00 | 15.56 |
| PET-P-ITP | — | 400 | 22 | 79.26 | 3.36 | 0.83 | 0.06 | 16.49 |
| PET-CU-ITP | — | 400 | 28 | 72.37 | 4.48 | 15.28 | 0.09 | 7.78 |
| PET-P-A-ITP2 | 380 | 800 | 19 | 95.75 | 0.00 | 0.88 | 0.00 | 3.37 |
| PET-CU-A-ITP2 | 380 | 800 | 20 | 89.98 | 0.44 | 7.33 | 0.00 | 2.25 |
The elemental analysis generally shows that increasing the temperature in ITP resulted in significant increase in the carbon content and corresponding decrease in the hydrogen content. PET-P-A annealed at 400 °C gave 70.1 wt% C and 2.7 wt% H while PET-P-A-ITP2 that was pre-annealed at 380 °C before pyrolysing at 800 °C gave 95.8 wt% C and no H. These results agree with previous studies on the evolution of C and H contents with carbonisation of lignocellulosic materials.34,35 PET-CU samples gave very high amounts of nitrogen in the final carbonaceous products ranging from 7.3–15.7 wt%, which are the highest reported for most nitrogen-doped carbon materials. The high nitrogen content results from urea which is a component of the CU-DES which can be doped into the carbon structure as also reported in the ionothermal synthesis of carbon derived from biomass waste using zinc chloride-urea DES.25 There is a decrease in the nitrogen content with temperature. PET-CU-A-ITP2 pre-annealed at 380 °C before pyrolysing at 800 °C displays 7.3 wt% while PET-CU-A annealed at 400 °C gives 15.7 wt%. The residual weight fraction is an indicator of the oxygen content which has been shown to reduce along with hydrogen with higher carbonization temperature.34–36 The PET-CU samples give smaller amounts of the residual content compared to the PET-P samples. Since the C and H contents of the PET-P samples show higher carbonization temperatures, the PET-CU samples might require higher heat treatments compared to their PET-P analogues for optimal carbonization. The PET-P-A-ITP2 and PET-CU-A-ITP2 products show the highest amount of carbon, lowest amounts of hydrogen and residual content indicating the highest level of carbonization.
Structural analysis
 | (1) |
 | (2) |
 | (3) |
| Sample | d002a (Å) | Lab (nm) | Lcc (nm) |
|---|---|---|---|
| a d002 is the average graphite interlayer spacing calculated from the 002 peak centers.b La is the crystallite size of the graphitic domain obtained from 100 reflection.c Lc is the stacking height obtained from 002 reflection. | |||
| PET-P-A | 3.99 | 2.7 | 0.7 |
| PET-CU-A | 3.99 | 2.8 | 0.7 |
| PET-P-A-ITP2 | 4.14 | 1.8 | 1.3 |
| PET-CU-A-ITP2 | 3.65 | 1.7 | 0.6 |
Raman spectroscopy
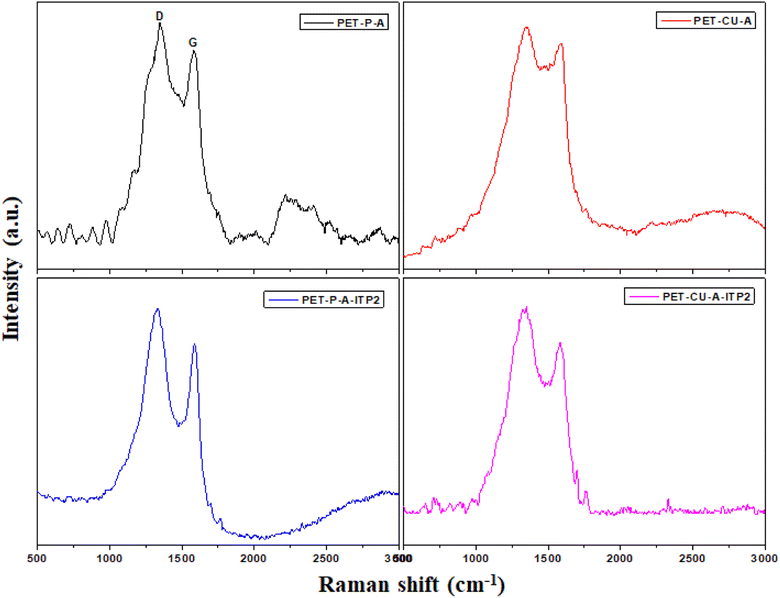
Raman spectroscopy is a very important technique to measure the extent of disorder or local changes in the structure of various carbon materials.41 The Raman spectra of the obtained carbonaceous materials are given in Fig. 4. They all display the D (∼1347 cm−1) and G (∼1590 cm−1) bands characteristic of disordered and graphitic carbons. The D band is due to disorder or defects in the carbon structure while the G band is correlated to the stretching of the carbon atoms in the graphitic layer. The results of the intensity ratio ID/IG are shown in Table 3. Surprisingly, the PET-CU-A-ITP2 sample shows the highest ID/IG value of 1.21 which can indicate lowest level of graphitization degree or highest level of disordered/defect carbon structure.25,37,42 Clearly, the XRD results have shown that the PET-CU-A-ITP2 sample displayed the highest level of graphitization/ordering of all the samples. The elemental analysis showed that nitrogen is doped both into PET-CU-A and PET-CU-A-ITP2 materials which can also introduce defects in these materials. Furthermore, it is interesting that PET-CU-A-ITP2 material which is the closest to a turbostratic-type carbon has the highest ID/IG value while PET-CU-A which is the closest to amorphous carbon has the lowest ID/IG value (1.07). This implies that the ID/IG value might also be a measure of the numeric density of interatomic distance which is sensitive to the size and microstructure of a crystallite.43 Nevertheless, all the samples including PET-CU-A-ITP2 are still highly defective graphitic materials. As observed in the XRD analysis, the crystallite size or average width of the graphitic domain (La) can be determined from the Raman spectroscopy using eqn (4).44 The La results can be found in Table 3. Particularly, PET-CU-A-ITP2 gives the smallest crystallite size (3.64 nm) of all samples, in accordance with the XRD results. Both XRD and Raman spectroscopy analysis show that the PET-CU-A-ITP2 has the smallest crystallite size. It can be seen that the crystallite size values obtained from Raman spectroscopy are higher than those from XRD analysis as also reported elsewhere.36,45 The analysis of La value from Raman spectroscopy is based on propagation of phonons which is quite different from XRD technique that is based on diffraction phenomenon.45 For example, when a carbon layer is bent, there will be a reduced detection of the coherent domains by XRD whereas the phonon propagation is less inhibited. As a result, the La value obtained from Raman spectroscopy will be larger than that calculated from XRD.45
 | (4) |
Pair distribution function analysis (PDF)
The local atomic structures of PET-P, PET-CU-A, and PET-CU-A-ITP2 which were obtained from XRD patterns and are further analysed by PDF and compared with the calculated graphite structure as presented in Fig. 5. This figure shows the evolution of the graphitic structure from PET-P to PET-CU-A-ITP2 in terms of their local atomic structures and peak alignment with the calculated graphite structure. The PET-CU-A-ITP2 carbon shows three intense peaks associated with the real space distance of 1.40, 2.42 and 3.69 Å for the 1st, 2nd, and 3rd peaks which aligns very well with those of the calculated graphite peaks seen at 1.42, 2.45, and 3.68 Å, respectively. It has been reported that the 1st and 2nd peaks correspond to the intralayer graphite distances while the 3rd peak is associated with the interlayer graphite distances.46 Also, PET-CU-A-ITP2 shows virtually similar peaks to the calculated graphite peaks in the range above 4 Å; but PET-CU-A only displays a broad sinusoidal oscillation with no distinct peaks in this region indicating a higher degree of disorder in this material. In addition, the lower intensities of PET-CU-A compared with the PET-CU-A-ITP2 and the calculated graphite peaks imply that it has a higher amount of defects/disorder resulting from the high number of non-hexagonal carbon rings in its structure.47 The PDF analysis shows that the PET-CU-A-ITP2 carbon material displays a better graphite-like layered structure and less disorder compared to the other samples as also shown in the Raman spectroscopy results.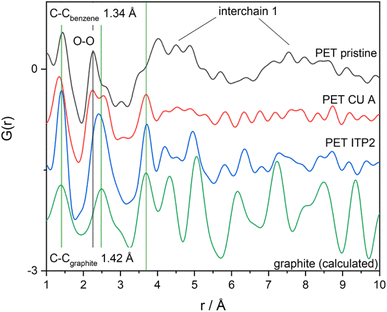 | ||
| Fig. 5 Pair distribution functions of PET-P, PET-CU-A, and PET-CU-A-ITP2 carbon materials compared with the calculated graphite structure. | ||
Adsorption analysis of the carbonaceous materials: Brunauer Emmett Teller (BET) method
The surface area of the carbonaceous materials was determined using nitrogen adsorption. The adsorption isotherm up to 0.30 relative pressure was used to determine the surface areas using the BET equation. The N2 isotherms of the samples are shown in Fig. S1† with similar trends. The adsorption amounts increase gradually starting from the low pressure with the micropores filled with N2 gas at high pressure. At the knee, more evident in the PET-P-A and PET-P-A-ITP2 isotherms, a monolayer begins to form. According to IUPAC classification, the adsorption isotherms resemble that of type I/IV behaviour.36,42 As shown in Table 4, the BET surface area of PET-P-A (328.5 m2 g−1) and PET-P-A-ITP2 (502.9 m2 g−1) are significantly higher than those of PET-CU-A (8.5 m2 g−1) and PET-CU-A-ITP2 (23.1 m2 g−1). It is clear that the presence of CU-DES must have clogged the micropores of the PET-CU-A and PET-CU-A-ITP2 samples. In order to simplify the synthesis process and due to the assumption that the pyrolysis heating will evaporate any remaining CU-DES or other contaminants, no post-synthesis washing of the samples was done. Most reports use solvents such as acetone, alcohol, acids, and water to wash the post-synthesised carbon products which complicates the process, results in the usage of toxic chemicals, and increases the cost of the materials.25,34,35,48 In addition, apart from post-synthesis washing, the results show that higher pyrolysis temperature may be required for the CU-DES treated samples since enhanced surface area is recorded for PET-CU-A-ITP2 compared to PET-CU-A.| Sample | PET-P-A | PET-CU-A | PET-P-A-ITP2 | PET-CU-A-ITP2 |
|---|---|---|---|---|
| BET surface area (m2 g−1) | 328.5 | 8.5 | 502.9 | 23.1 |
Morphological Analysis of activated carbons derived from PET
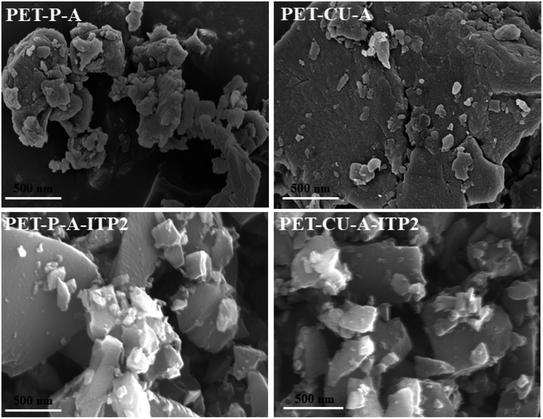
SEM was undertaken to study the morphology of the obtained activated carbons and they are shown in Fig. 6. PET-CU-A shows a highly compact structure which confirms its smallest BET surface area compared to the other samples. PET-P-A consists of agglomerated particles with few smaller particles at the surface and reveals the presence of some pores. After pyrolysis, PET-P-A-ITP2 and PET-CU-A-ITP2 show obvious morphological changes with both samples displaying larger irregular non-agglomerated particles with few smaller particles at the surface on top of them. They also show some porosity.EDX analysis was used to show the elemental distribution and mapping in the carbonaceous materials. Fig. 7 shows the STEM-EDX images of PET-P-A carbons and its corresponding EDX mapping which shows the distribution of C, N, and O elements in the materials. The STEM image shows an agglomerated particle as also revealed by the SEM analysis. Fig. S2† gives the SEM image of activated carbon powders derived from PET and their corresponding EDX mapping showing the homogeneous distribution of C, N, and O elements in the material. The elemental composition of C, N, and O elements largely agrees with the elemental distribution from the CHN analysis. STEM-EDX was used for PET-P-A to determine the elemental mapping of the material which corroborates the SEM-EDX analysis.
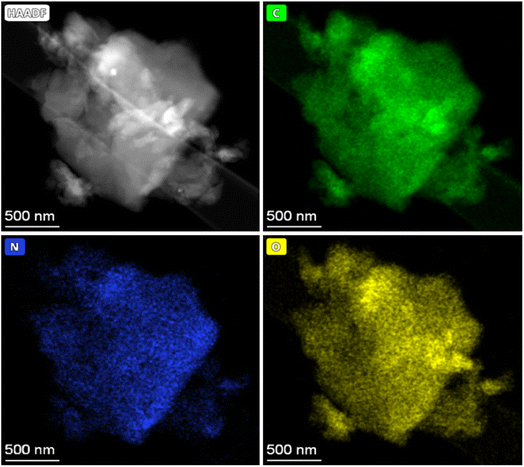 | ||
| Fig. 7 STEM image of PET-P-A carbons using HAADF detector and its corresponding EDX mapping showing the distribution of C, N, and O elements in the materials. | ||
Electrochemical performance
Cyclic voltammetry (CV)
CV measurements were used to elucidate the electrochemical behaviour and to determine the mechanism of capacitive contributions of PET-CU-A and PET-CU-A-ITP2 carbon anodes in a LIB. Fig. 8 shows the CV curves which were performed at a scan rate of 0.1 mV s−1 between the cut-off voltages of 0.01 and 2.8 V (vs. Li/Li+) at 25 °C. Typically, in CV, the positive current describes lithium de-intercalation while the negative current gives the lithium intercalation into the anode. The CV curves shows that Li+ can reversibly (de-)intercalate into the carbon anode materials. The Li+ storage mechanism in carbon materials is based on its reversible intercalation in defective graphene layers, nanopore filling, and reaction with heteroatoms.42,49 The increase in current at lower voltages shows the beginning of electrolyte decomposition leading to solid electrolyte interphase (SEI) formation as shown in other reports.42,50,51 The CV curve of PET-CU-A shows no sharp peak in contrast to that of PET-CU-A-ITP2 indicating less electrochemical activity. The 1st cycle of PET-CU-A-ITP2 shows a broad reduction peak at about 0.5 V which describes the decomposition of electrolyte on the anode surface during Li+ insertion forming the SEI film. However, this peak disappears in the subsequent cycles showing curves that are overlapped, indicating stable SEI film on the anode surface and the reversibility of the electrochemical process. It has been shown that such a stable SEI film can protect the electrolyte from further degradation during subsequent charge–discharge cycles.52 Furthermore, the one pair of weak reduction and oxidation peaks between 1.0–1.5 V (2nd–5th cycle), not seen in the PET-CU-A anode, corresponds to Li+ (de−)intercalation from the defective graphene layers. The current flow that occurs in the voltage range of 0.1–1.0 V is due to the reaction of Li+ with N heteroatoms doped into the carbon materials by using CU-DES while the current flow observed close to 0.1 V is a result of nanopore filling.51 In addition, the higher peak height and area in the CV of PET-CU-A-ITP2 anode confirms the better electrochemical performance compared to PET-CU-A anode. The results agree with the XRD results which predicted enhanced electrochemical performance for the PET-CU-A-ITP2 anode since it presented the highest level of graphitization and the most enhanced stacking structure of all the carbon materials.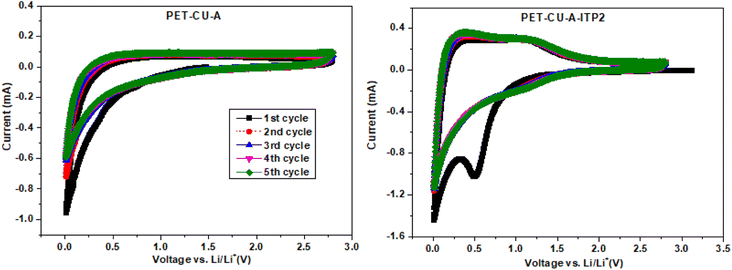 | ||
| Fig. 8 Cyclic voltammetry of the PET-CU-A and PET-CU-A-ITP2 carbon anodes measured at a scan rate of 0.1 mV s−1 between 0.01 - 2.8 V (vs. Li/Li+) for five cycles at 25 °C. | ||
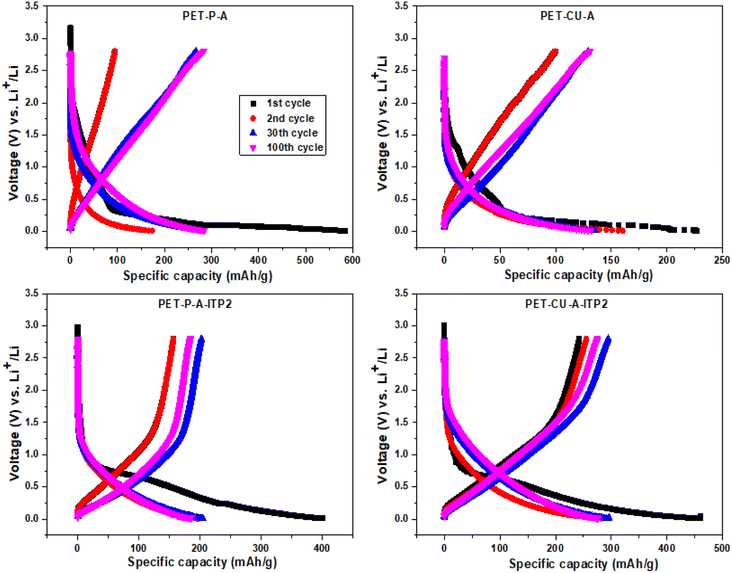
Galvanostatic charge–discharge profiles
The galvanostatic charge–discharge profiles of the obtained carbon materials used as anode in LIB and cycled at a current density of 100 mA g−1 between 0.01 - 2.8 V (vs. Li/Li+) at 25 °C are shown in Fig. 9. It is important to note that no initial activation was applied at a lower current density. The quantitative electrochemical performance data for the 1st, 2nd, 30th, and 100th cycles are given in Table S1.† All the profiles follow the typical charge–discharge curves of pseudo-graphitic carbonaceous materials used as anodes in LIBs with an extended plateau in the 1st discharge curves.48,53 The PET-P-A, PET-CU-A, PET-P-A-ITP2, and PET-CU-A-ITP2 anodes give 1st cycle discharge capacities of about 584, 227, 401, and 461 mA h g−1 and 1st cycle coulombic efficiency (CE) of about 16%, 24%, 39%, and 53%, respectively. This means that the PET-P-A anode shows the largest 1st cycle capacity loss (∼489 mA h g−1) while the PET-CU-A-ITP2 anode gave the smallest capacity loss (∼218 mA h g−1). These large irreversible 1st cycle capacity losses accompanied with low CE are typical of carbonaceous anode materials as a result of the decomposition of electrolytes and subsequent formation of SEI on the anode surfaces.53 Also, the disordering in the carbon structure has been implicated for this large 1st cycle capacity loss since Li+ could be trapped in the voids of the carbon matrix.54 This is in agreement with the XRD analysis that showed that PET-P-A (along with PET-CU-A) displayed highly disordered carbon structure which could be accounting for their larger capacity loss and lower CE.It can be seen that for all the anodes in the 2nd cycle (Table S1†), there is a reduction in the discharge capacities and capacity losses with concomitant increase in the CE. These trends continued till after the 100th cycle except that the discharge capacities of the anodes generally increase from the 2nd cycle which could be due to enhanced structural stability of the anode materials after SEI formation in the 1st cycle. For example, the PET-P-A anode recorded a discharge capacity and CE of ∼174 mA h g−1 and ∼60% in the 2nd cycle, while after the 100th cycle it showed ∼288 mA h g−1 and ∼90%, respectively. Similarly, the PET-CU-A-ITP2 anode recorded a discharge capacity and CE of ∼283 mA h g−1 and ∼90% in the 2nd cycle, while after the 100th cycle it showed ∼276 mA h g−1 and ∼100%, respectively. Comparatively, the ITP carbon anode materials (PET-P-A-ITP2 and PET-CU-A-ITP2) gave better electrochemical performance than the annealed analogues (i.e. PET-P-A and PET-CU-A) which can be traced to their higher graphitization and ordering.
The galvanostatic charge–discharge profiles of the carbon anode materials were also cycled at a current density of 50 mA g−1 between 0.01–2.8 V (vs. Li/Li+) at 25 °C as shown in Fig. S3.† The quantitative electrochemical performance data for the 1st and 2nd cycles are given in Table S2.† It is well known that the cycling current density can be used to control the kinetics of the electrochemical process. Usually, more Li+ can be (de)intercalated into the electrode materials at lower charge current density, thereby increasing the capacity and CE.35 Table 4 6 shows that the PET-P-A, PET-CU-A, PET-P-A-ITP2 and PET-CU-A-ITP2 anodes cycled with a current density of 50 mA g−1 gave 1st cycle discharge capacities of about 1191, 769, 636, and 650 mA h g−1 and CE of about 20%, 47%, 46%, and 58%, respectively; which were all significantly higher than the values obtained when these anodes were cycled at 100 mA g−1. A similar trend can also be seen with the values obtained in the 2nd cycle. Like the ones cycled at 100 mA g−1, there was a reduction in the discharge capacities and capacity losses with concomitant increase in the CE for all the anodes. Overall, the PET-CU-A-ITP2 anode gave the best electrochemical performances at both current densities.
Cycling performance
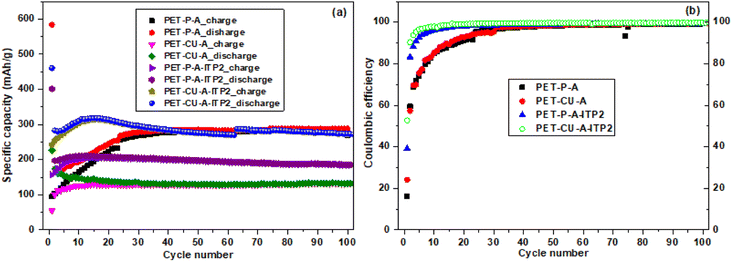
The cycling performance and coulombic efficiency of the carbon anode materials derived from PET cycled at a current density of 100 mA g−1 between 0.01 - 2.8 V (vs. Li/Li+) at 25 °C are shown in Fig. 10. All the carbon anodes show stable cycling with only weak capacity degradation as shown in Fig. 10a. A reduction of discharge capacity is seen after the 1st cycle which increased generally after the 2nd cycle. Particularly, the capacity retention (from 2nd to 100 cycles) for the PET-P-A, PET-CU-A, PET-P-A-ITP2, and PET-CU-A-ITP2 anodes is 166%, 76%, 94% and 98%, respectively. The 1st cycle CE increased from ∼16% in PET-P-A anode to 53% in PET-CU-A-ITP2 anode. The PET-CU-A and PET-P-A-ITP2 anodes show an average stable charge–discharge capacity of ∼135 and ∼200 mA h/g over 100 cycles. The PET-P-A and PET-CU-A-ITP2 anodes presented higher average stable charge–discharge capacities of ∼295 mA h g−1 for both anodes. Fig. 10b shows that the CE increased steadily for all the anode materials, but only the PET-CU-A-ITP2 anode reached ∼90% in the 2nd cycle and ∼100% from 20th–100th cycle indicating better stabilisation of the SEI.55 The PET-P-A and PET-CU-A anodes had very poor CE mostly in the first 30 cycles as also seen in the non-overlap of the charge–discharge curve in Fig. 10a.Rate performance
The rate performances of PET-P-A and PET-CU-A-ITP2 anodes were determined by performing galvanostatic charge–discharge tests for 10 cycles at different current density ranging from 100–2000 mA g−1 and it is shown in Fig. 11. The galvanostatic charge–discharge profiles (10th cycle) of these two anodes are given in Fig. S4.† These two anode materials were selected since they presented the best combination of specific capacity and capacity retention. Particularly, the two anode materials allowed for the comparison between the influence of the method of synthesis (annealing and pyrolysis) and the use/non-use of CU-DES on both their electrochemical performances. Using the 2nd cycles, the PET-CU-A-ITP2 anode delivered specific capacities of 283, 172, 97, and 42 mA h g- 2 while the PET-P-A anode delivered specific capacities of 174, 106, 30, and 6 mA h g- 2 at current densities of 100, 200, 500, and 2000 mA g−1, respectively. This result clearly shows that the rate performance of the PET-CU-A-ITP2 anode is better than that of the PET-P-A anode at all current densities tested. However, both anodes displayed good reversibility and virtually same specific capacity when they were cycled at 100 mA g−1 immediately after cycling at 2000 mA g−1.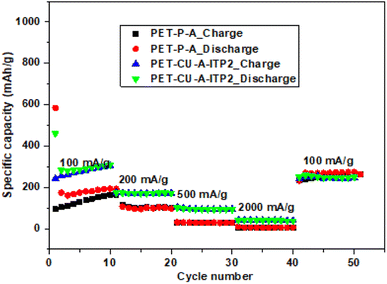 | ||
| Fig. 11 Rate performance tests of PET-P-A and PET-CU-A-ITP2 anodes cycled at varying current densities (100–2000 mA g−1) between 0.01–2.8 V (vs. Li/Li+) at 25 °C. | ||
Discussion
The electrochemical test results show clearly that PET-CU-A presented the poorest performance of all materials. This can be connected to its structure and composition. The XRD results show that PET-CU-A had the highest disorder as seen in the 101 reflection which was the least pronounced of all the samples.24 Also, the poorest electrochemical performance of this material could be traced to its highly compact structure and its smallest BET surface area compared to the other carbon materials. However, the high initial capacity of PET-CU-A carbon could be caused by the highest amount of N doped into its structure. It is well known that N doping can induce defects, increase available active sites, and can improve the electronic and chemical characteristics, resulting in the enhancement of electrochemical reactivity in LIBs.42,50,56 Generally, the PET-P-A anode displayed better electrochemical performance compared to PET-P-A-ITP2 anode; even though it had lower surface area, lesser graphitization/ordering and undesired poor CE which was the poorest of all the carbon anodes. Poor CE is due to the irreversible trapping of Li+ in the highly disordered carbon and amorphous regions. The generally poorer performance of the PET-P-A-ITP2 anode can only be explained from its poorest layer-to-layer orientation in all the samples which can influence Li+ kinetics in the anode.The elemental analysis results show that PET-CU-A-ITP2 carbon (along with PET-P-A-ITP2) shows the highest amount of carbon indicating the highest level of carbonization. This was also confirmed by the XRD results which showed that PET-CU-A-ITP2 has enhanced stacking structure and higher degree of graphitization compared to other samples. This high level of graphitization and the best layer-to-layer orientation in PET-CU-A-ITP2 carbons conferred enhanced electronic conductivity which increased the electrochemical performance compared to the other carbon materials. The specific capacity in these carbons can be due to reactions with the heteroatom, reversible adsorption on defective sites, intercalation in the graphitic sheets, and nanopore filling.42,50,56 The different charge storage mechanisms and the contributions to the specific capacity of the carbon anodes can be obtained from the plateau and slope of the galvanostatic discharge profiles. There are conflicting reports in literature on the assignment of the particular charge storage mechanisms to the plateau and slope regions of the galvanostatic discharge profiles of pseudo-graphitic carbon materials. While some researchers showed that Li+ ion intercalation in the graphitic sheets was dominant in the sloping region (above 0.1 V),57,58 others demonstrated that this same storage mechanism accounted for the plateau region (below 0.1 V).42,50 Furthermore, the plateau region (below 0.1 V) has been described based on nanopore filling56 while others showed that no nanopore filling was observed even at 0.001 V.42 Yet other researchers have shown that reversible binding on defects, surfaces and edges accounts for the sloping region.42,47,50 However, it is clear that the total capacity of these pseudo-graphitic carbon materials is a sum of different charge storage mechanisms as shown above.
Fig. 12 gives the capacity contributions from above 0.1 V (sloping region) and below 0.1 V (plateau region) of the 2nd cycle discharge profiles at both 50 and 100 mA g−1. The results show that the sloping region contributes higher capacity compared to the plateau region in all the carbon anodes at both current densities. The PET-CU-A-ITP2 and PET-P-A-ITP2 carbons show higher capacity values in the sloping region at both current densities. This might be due to the higher levels of graphitization/ordering in these materials as seen from their XRD analysis which favours intercalation in the graphitic sheets. In contrast, the PET-P-A and PET-CU-A carbons generally present higher capacity values in the plateau region at both current densities. Since these carbons displayed lower graphitization/ordering compared to the PET-CU-A-ITP2 and PET-P-A-ITP2 carbons, these defects must be the dominant charge storage centers in this region. The N doping on the PET-CU-A-ITP2 carbon which can induce defects or increase available active sites may be responsible for the capacity values in the plateau region comparable to PET-P-A and PET-CU-A carbons. These results also show that the surface area had no clear contributions to the total capacity since PET-P-A-ITP2 carbon with the highest surface area (502.9 m2 g−1) presents a smaller capacity than PET-CU-A-ITP2 carbon with a surface area of 23.1 m2 g−1. Excellent electrochemical performance has been reported for highly volumetrically densified banana peels-derived carbons with low surface areas which aided excellent electrode packing characteristics, a high volumetric capacity, and low levels of SEI formation.42 Overall, the PET-CU-A-ITP2 carbons display the highest total capacities in both the sloping and plateau regions at both current densities. The superior electrochemical performance of the PET-CU-A-ITP2 carbon anode could be due to its low surface area which can result in better electrode packing, higher capacity, less SEI formation and better CE. Even though the PET-CU-A-ITP2 carbon anode recorded small initial CE (53%), this value is comparable with the one obtained from other carbons such as graphene anode59 and N-doped graphitic carbon anode.60 These results show that dense carbons can be exploited as high-performance anode in LIBs and can further be improved by increasing the pyrolysis temperature. The use of CU-DES in a facile synthesis to prepare pseudo-graphitic carbons from abundant waste PET bottles could facilitate its commercial application since it is cheap and environmentally friendly. Also, this type of waste-to-energy approach will not only help in the sustainable management of these wastes but could also offer cheaper and greener LIBs to tackle the energy poverty presently faced by most African countries. The electrochemical performance of PET-CU-A-ITP2 carbon in LIB has been compared with a range of various types of carbon anodes in LIB and is shown in Table S3.†
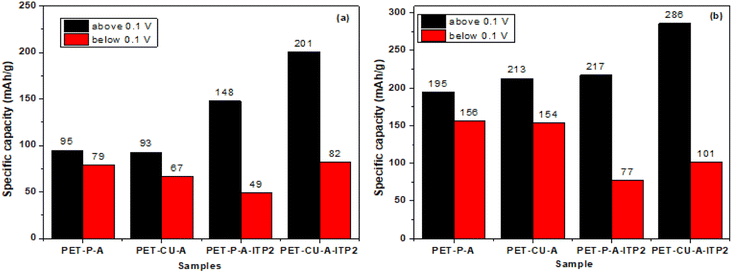 | ||
| Fig. 12 Capacity contributions from above 0.1 V (sloping region) and below 0.1 V (plateau region) of the 2nd cycle discharge profiles at both 100 mA g−1 (a) and 50 mA g−1 (b). | ||
Conclusion
In summary, pseudographitic activated carbons (AC) were prepared from waste PET bottles using ionothermal pyrolysis. The use of CU-DES as the solvent medium and nitrogen source enhanced the simplicity, reduced toxicity and resulted in low-cost ACs which could facilitate the large-scale production of this important functional material. After different optimization steps, the pre-stabilization of PET in air was found to be critical for its pyrolysis to obtain AC. Also, it was found that on extending the pre-stabilization step for a longer duration, AC material (PET-P-A and PET-CU-A) were produced which gave good electrochemical performance comparable to the ones produced from the ITP method. This method of producing AC from PET using low temperature annealing in the presence of air can even further simplify the synthesis process and the cost of AC. Furthermore, the use of CU-DES created low-surface area ACs and higher levels of graphitization/ordering in the ACs. The obtained ACs were applied as anodes in LIBs. The PET-CU-A-ITP2 gave the best electrochemical performance that could be upscaled to meet the requirements for commercial application. The results show that the electrochemical parameters such as initial coulombic efficiency, specific capacity and cycling performance are controlled by the microstructural properties of the AC materials which in turn are dependent on the method of synthesis and key parameters like the use of CU-DES. Comparing the electrochemical performance of PET-CU-A-ITP2 anode with the state-of-the-art lithium-ion batteries (LIBs) shows that it is promising and can be improved to meet large-scale LIBs application.Data availability
All data of this study are available from the corresponding author upon request.Author contributions
Ehi-Eromosele C.O. and Indris S. conceived, planned and supervised the experiments. Ehrenberg H. was the Chief Host and provided the research resources. Onwucha C.N. performed the synthesis and the electrochemical tests while Ajayi S.A. analysed the electrochemical data. Melinte G. and Hansen A.-L. performed the STEM and PDF experiments and analysis, respectively. Ehi-Eromosele C.O. wrote the first draft while all authors reviewed the manuscript.Conflicts of interest
There are no conflicts of interest to declare.Acknowledgements
This work was supported by the Karlsruhe Institute of Technology's Re-invitation Grant for Research Alumni in 2021. This work contributes to the research performed at CELEST (Center for Electrochemical Energy Storage Ulm-Karlsruhe). The STEM characterization was carried out at the Karlsruhe Nano Micro Facility (KNMF), a Helmholtz research infrastructure operated at the KIT.References
- C. O. Ehi-Eromosele, S. O. Ajayi and C. N. Onwucha, J. Alloys Compd., 2020, 861, 157972 CrossRef.
- Z. Yang, J. Zhang, M. C. Kintner-Meyer, X. Lu, D. Choi, J. P. Lemmon and J. Liu, Chem. Rev., 2011, 111, 3577–3613 CrossRef CAS PubMed.
- M. Armand and J. M. Tarascon, Nature, 2008, 451, 652–657 CrossRef CAS PubMed.
- J. B. Goodenough, Acc. Chem. Res., 2013, 46, 1053–1061 CrossRef CAS PubMed.
- F. Fu, Y. Huang, P. Wu, Y. Bu, Y. Wang and J. Yao, J. Alloys Compd., 2015, 618, 673–678 CrossRef CAS.
- M. Iftekhar, N. E. Drewett, A. R. Armstrong, D. Hesp, F. Braga, S. Ahmed and L. J. Hardwick, J. Electrochem. Soc., 2014, 161, A2109–A2116 CrossRef CAS.
- J. W. Choi and D. Aurbach, Nat. Rev. Mater., 2016, 1, 1–16 Search PubMed.
- N. Rapulenyane, E. Ferg and H. Luo, J. Alloys Compd., 2018, 762, 272–281 CrossRef CAS.
- H. Yu, H. Lan, L. Yan, S. Qian, X. Cheng, H. Zhu, N. Long and M. Shui, Nano Energy, 2017, 38, 109–117 CrossRef CAS.
- J. H. Won, H. M. Jeong and J. K. Kang, Adv. Energy Mater., 2017, 7, 1601355 CrossRef.
- C. O. Ehi-Eromosele, S. O. Ajayi and C. N. Onwucha, Mater. Chem. Phys., 2020, 259, 124055 CrossRef.
- M. Gao, S. Y. Pan, W. C. Chen and P. C. Chiang, Mater. Today Energy, 2018, 7, 58–79 CrossRef.
- K. Zou, Z. Guan, Y. Deng and G. Chen, Carbon, 2020, 161, 25–35 CrossRef CAS.
- W. Tang, Y. Zhang, Y. Zhong, T. Shen, X. Wang, X. Xia and J. Tu, Mater. Res. Bull., 2017, 88, 234–241 CrossRef CAS.
- S. Yenisoy-Karakaş, A. Aygün, M. Güneş and E. Tahtasakal, Carbon, 2004, 3, 477–484 CrossRef.
- M. Adibfar, T. Kaghazchi, N. Asasian and M. Soleimani, Chem. Eng. Technol., 2014, 37, 979–986 CrossRef CAS.
- M. T. Kartel, N. V. Sych, M. M. Tsyba and V. V. Strelko, Carbon, 2006, 44, 1019–1022 CrossRef CAS.
- W. Bratek, A. Świątkowski, M. Pakuła, S. Biniak, M. Bystrzejewski and R. Szmigielski, J. Anal. Appl. Pyrolysis, 2013, 100, 192–198 CrossRef CAS.
- K. Nakagawa, A. Namba, S. R. Mukai, H. Tamon, P. W. Ariyadejwanich and W. Tanthapanichakoon, Water Res., 2004, 38, 1791–1798 CrossRef CAS PubMed.
- S. Wang, L. Zhang, G. Sima, Y. Cui and L. Gan, Chem. Phys. Lett., 2019, 736, 136808 CrossRef.
- J. B. Parra, C. O. Ania, A. Arenillas, F. Rubiera, J. M. Palacios and J. J. Pis, J. Alloys Compd., 2004, 379, 280–289 CrossRef CAS.
- M. Domingo-García, J. A. Fernández, M. C. Almazán-Almazán, F. J. López-Garzón, F. Stoeckli and T. A. Centeno, J. Power Sources, 2010, 195, 3810–3813 CrossRef.
- J. Pampel, C. Denton and T. P. Fellinger, Carbon, 2016, 107, 288–296 CrossRef CAS.
- X. X. Lin, B. Tan, L. Peng, Z. F. Wu and Z. L. Xie, J. Mater. Chem. A, 2016, 4, 4497–4505 RSC.
- K. Zou, Z. Guan, Y. Deng and G. Chen, Carbon, 2020, 161, 25–35 CrossRef CAS.
- Z. Jiang, J. Yuan, P. Wang, X. Fan, J. Xu, Q. Wang and L. Zhang, Int. J. Biol. Macromol., 2018, 119, 423–430 CrossRef CAS PubMed.
- Y. L. Loow, E. K. New, G. H. Yang, L. Y. Ang, L. Y. W. Foo and T. Y. Wu, Cellulose, 2017, 24, 3591–3618 CrossRef CAS.
- P. Juhás, T. Davis, C. L. Farrow and S. J. L. Billinge, J. Appl. Crystallogr., 2013, 46, 560–566 CrossRef.
- P. Półrolniczak, D. Kasprzak, J. Kaźmierczak-Raźna, M. Walkowiak, P. Nowicki and R. Pietrzak, Synth. Met., 2020, 261, 116305 CrossRef.
- B. Tang and K. H. Row, Monatsh. Chem., 2013, 144, 1427–1454 CrossRef CAS.
- A. P. Abbott, D. Boothby, G. Capper, D. L. Davies and R. K. Rasheed, J. Am. Chem. Soc., 2004, 126, 9142–9147 CrossRef CAS PubMed.
- P. Bajaj and A. K. Roopanwal, J. Macromol. Sci., Part C: Polym. Rev., 1997, 3, 97–147 CrossRef.
- S. Ko, Y. J. Kwon, J. U. Lee and Y. P. Jeon, J. Ind. Eng. Chem., 2020, 83, 449–458 CrossRef CAS.
- P. Zhang, Y. Gong, Z. Wei, J. Wang, Z. Zhang, H. Li, S. Dai and Y. Wang, ACS Appl. Mater. Interfaces, 2014, 6, 12515–12522 CrossRef CAS PubMed.
- H. Yu, H. Kim, Y. Wang, P. He, D. Asakura, Y. Nakamura and H. Zhou, Phys. Chem. Chem. Phys., 2012, 14, 6584–6595 RSC.
- X. Dou, Doctoral dissertation, Karlsruher Institut für Technologie, 2019 Search PubMed.
- T. Qiu, J. G. Yang, X. J. Bai and Y. L. Wang, RSC Adv., 2019, 9, 12737–12746 RSC.
- R. E. Franklin, Acta Crystallogr., 1950, 3, 107–121 CrossRef CAS.
- F. C. Cowlard and J. C. Lewis, J. Mater. Sci., 1967, 2, 507–512 CrossRef CAS.
- W. Li and Y. Zhu, Energy Fuels, 2014, 28, 3645–3654 CrossRef CAS.
- C. Bommier, D. Mitlin and X. Ji, Prog. Mater. Sci., 2018, 97, 170–203 CrossRef CAS.
- E. M. Lotfabad, J. Ding, K. Cui, A. Kohandehghan, W. P. Kalisvaart, M. Hazelton and D. Mitlin, ACS Nano, 2014, 8, 7115–7129 CrossRef CAS PubMed.
- Z. Q. Li, C. J. Lu, Z. P. Xia, Y. Zhou and Z. Luo, Carbon, 2007, 45, 1686–1695 CrossRef CAS.
- F. Tuinstra and J. L. Koenig, J. Compos. Mater., 1970, 4, 492–499 CrossRef CAS.
- M. B. Vazquez-Santos, E. Geissler, K. Laszlo, J. N. Rouzaud, A. Martinez-Alonso and J. M. Tascón, J. Phys. Chem. C, 2012, 1, 257–268 CrossRef.
- Y. Shibazaki, Y. Kono and G. Shen, Sci. Rep., 2019, 9, 1–8 CrossRef CAS PubMed.
- C. Bommier, T. W. Surta, M. Dolgos and X. Ji, Nano Lett., 2015, 15, 5888–5892 CrossRef CAS PubMed.
- L. Wang, Z. Schnepp and M. M. Titirici, J. Mater. Chem. A, 2013, 1, 5269–5273 RSC.
- M. Liu, Z. Zhang, M. Dou, Z. Li and F. Wang, Carbon, 2019, 151, 28–35 CrossRef CAS.
- T. Zhang, J. Mao, X. Liu, M. Xuan, K. Bi, X. L. Zhang, J. Hu, J. Fan, S. Chen and G. Shao, RSC Adv., 2017, 7, 41504–41511 RSC.
- L. Wu, D. Buchholz, C. Vaalma, G. A. Giffin and S. Passerini, ChemElectroChem, 2016, 3, 292–298 CrossRef CAS.
- B. Xing, H. Zeng, G. Huang, J. Jia, R. Yuan, C. Zhang, Q. Sun, Y. Cao, Z. Chen and B. Liu, Electrochim. Acta, 2021, 376, 138043 CrossRef CAS.
- R. R. Gaddam, D. Yang, R. Narayan, K. V. S. N. Raju, N. A. Kumar and X. S. Zhao, Nano Energy, 2016, 26, 346–352 CrossRef CAS.
- J. C. Arrebola, A. Caballero, L. Hernán, J. Morales, M. Olivares-Marín and V. Gómez-Serrano, J. Electrochem. Soc., 2010, 157, A791 CrossRef CAS.
- K. Tang, L. Fu, R. J. White, L. Yu, M. M. Titirici, M. Antonietti and J. Maier, Adv. Energy Mater., 2012, 2, 873–877 CrossRef CAS.
- H. Hou, X. Qiu, W. Wei, Y. Zhang and X. Ji, Adv. Energy Mater., 2017, 7, 1602898 CrossRef.
- D. A. Stevens and J. R. Dahn, J. Electrochem. Soc., 2001, 148, A803 CrossRef CAS.
- J. M. Stratford, P. K. Allan, O. Pecher, P. A. Chater and C. P. Grey, Chem. Commun., 2016, 52, 12430–12433 RSC.
- A. Kumar, A. L. M. Reddy, A. Mukherjee, M. Dubey, X. Zhan, N. Singh, L. Ci, W. E. Billups, J. Nagurny, G. Mital and P. M. Ajayan, ACS Nano, 2011, 5, 4345–4349 CrossRef CAS PubMed.
- S.-X. Wang, S. Chen, Q. Wei, X. Zhang, S. Y. Wong, S. Sun and X. Li, Chem. Mater., 2015, 27, 336–342 CrossRef CAS.
Footnote |
| † Electronic supplementary information (ESI) available:Nitrogen adsorption isotherms data, SEM and electrochemical data of the activated carbon derived from PET are attached. See DOI: https://doi.org/10.1039/d2ra06786b |
| This journal is © The Royal Society of Chemistry 2022 |

