 Open Access Article
Hydrogenation of MTHPA to MHHPA over Ni-based catalysts: Al2O3 coating, Ru incorporation and kinetics†
Jianglong Pu *ab,
Changhao Liub,
Shenming Shic and
Junxian Yun*a
aCollege of Chemical Engineering, Zhejiang University of Technology, Changwang Road 18, Hangzhou 310032, China. E-mail: longpu@zjxu.edu.cn; yunjx@zjut.edu.cn
bCollege of Biological, Chemical Sciences and Engineering, Jiaxing University, 118 Jiahang Road, Jiaxing 314001, China
cZhejiang ZhengDa New Materials Technology Co., Ltd, 228 Mingxin Road, Jiaxing 314006, China
First published on 30th November 2022
Abstract
Because of its excellent performance, methyl hexahydrophthalic anhydride (MHHPA) is a new anhydride-based epoxy resin curing agent after methyl tetrahydrophthalic anhydride (MTHPA). To improve the activity and stability of conventional RANEY® nickel catalysts in the catalytic hydrogenation of MTHPA to MHHPA reaction, RANEY® nickel encapsulated with porous Al2O3 and alumina-supported Ni–Ru bimetallic catalysts were designed and synthesized in this study. The physicochemical properties and surface reactions over the catalysts were characterized by N2 adsorption and desorption, X-ray diffraction (XRD), hydrogen temperature-programmed reduction/desorption (H2-TPR/TPD), X-ray photoelectron spectroscopy (XPS), scanning electronic microscopy (SEM), transmission electron microscopy (TEM), Fourier transform infrared spectroscopy (FTIR), and in situ diffuse reflectance infrared Fourier transformations spectroscopy (DRIFTS). The kinetic model of MTHPA hydrogenation over NiRu/Al was established and the parameters were estimated using the least-square method. The results showed that the encapsulation of porous Al2O3 on the surface of RANEY® nickel enhanced the stability of the Ni skeleton and the adsorption ability of the reactant molecules, which improved its activity for the hydrogenation reaction. The introduction of Ru improved the dispersion and stability of metallic Ni, which greatly increased the conversion ability towards MTHPA hydrogenation, but it had a trend to cause C![[double bond, length as m-dash]](https://www.rsc.org/images/entities/char_e001.gif) C bond transfer at lower temperatures, increasing the hydrogenation difficulties. The kinetic results based on Ni–Ru bimetallic catalyst showed that the MTHPA hydrogenation reaction rate was first-order with respect to MTHPA concentration and 0.5-order with respect to hydrogen partial pressure, and the apparent activation energy of the hydrogenation reaction was 37.02 ± 2.62 kJ mol−1.
C bond transfer at lower temperatures, increasing the hydrogenation difficulties. The kinetic results based on Ni–Ru bimetallic catalyst showed that the MTHPA hydrogenation reaction rate was first-order with respect to MTHPA concentration and 0.5-order with respect to hydrogen partial pressure, and the apparent activation energy of the hydrogenation reaction was 37.02 ± 2.62 kJ mol−1.
1. Introduction
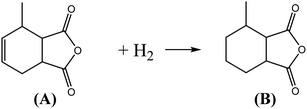
MHHPA as a new type of liquid anhydride curing agent for epoxy resin, has a wide application field and increasing annual demand, owing to its advantages of light color, high stability, short curing time, etc.1–3 MHHPA is derived from the catalytic hydrogenation of MTHPA as expressed by eqn (1). Besides the hydrogenation reaction, two types of side reactions also occur: on the one hand, the C![[double bond, length as m-dash]](https://www.rsc.org/images/entities/char_e001.gif) C within the MTHPA molecule is easily transferred when activated on the catalyst surface and tends to form p–π conjugation with C
C within the MTHPA molecule is easily transferred when activated on the catalyst surface and tends to form p–π conjugation with C![[double bond, length as m-dash]](https://www.rsc.org/images/entities/char_e001.gif) O (eqn (2)), which increases the difficulty of hydrogenation; on the other hand, the anhydride is prone to occurring side reactions such as condensation, hydrogenolysis (eqn (3)) and cross-linking under high-temperature conditions, forming coke to deactivate the catalyst. Therefore, a catalyst with high activity and stability is the key to MTHPA hydrogenation.
O (eqn (2)), which increases the difficulty of hydrogenation; on the other hand, the anhydride is prone to occurring side reactions such as condensation, hydrogenolysis (eqn (3)) and cross-linking under high-temperature conditions, forming coke to deactivate the catalyst. Therefore, a catalyst with high activity and stability is the key to MTHPA hydrogenation.
 | (1) |
 | (2) |
 | (3) |
Industrially, the catalysts used for MTHPA hydrogenation is mainly RANEY® nickel which is widely used in catalytic hydrogenation of fine petrochemicals because it has a high surface of Ni skeleton and is inexpensive and insensitive to sulfur and arsenic poisoning.4–7 However, its low mechanical strength and easy powdering loss limit its application in large tonnage continuous production units such as fixed bed.8 Usually, the RANEY® Ni catalyst is molded using inorganic or organic polymers as binders and calcined at high temperature to partially convert the Ni–Al alloy in the catalyst into α-Al2O3 with higher mechanical strength.9 Alternatively, the catalyst was prepared by incomplete alkali activation, thus the unactivated Ni–Al alloy phase with high mechanical strength could serve as support, but this also led to a decrease in the active sites, which was unfavorable to the MTHPA hydrogenation.9
Ni-based catalysts are commonly used in the liquid-phase hydrogenation reaction of maleic anhydride due to their superior ability to cleave C–C bond.10–13 Feng et al. prepared Ni particles with different sizes and polycrystalline structures by adding organic modifiers in the reduction of nickel acetate by hydrazine hydrate, and found that the size and polycrystalline structure of Ni particles had a great influence on the performance of the catalysts in the hydrogenation of maleic anhydride and the use of polar solvents could increase the diffusion of reactants and H2 to the catalyst surface and facilitated the hydrogenation reaction.10 The supported Ni catalysts are also widely used for liquid-phase hydrogenation reactions and the type of support can change the morphology of Ni0 and the metal–support interaction, which have a great influence on the hydrogenation reaction.11–13 The acidity and basicity of the support have a great influence on the conversion and selectivity during hydrogenation process, and it has been found that the acidic sites can improve the conversion of hydrogenation while the basic sites can inhibit the further hydrogenation of C![[double bond, length as m-dash]](https://www.rsc.org/images/entities/char_e001.gif) O.14 Among several common acidic oxide supports (Al2O3, TiO2, SiO2), Al2O3 exhibits excellent hydrogenation performance due to its high surface area and acidic sites.15 Compared to Al2O3, mesoporous CeO2 has better Ni dispersion due to its lattice oxygen vacancies and proper pore structure, resulting in an excellent performance in the hydrogenation reaction of maleic anhydride.16 Similarly, the lattice oxygen vacancies within ZrO2 can also form a synergistic catalytic interaction with metallic Ni to improve the activity and selectivity of the catalyst in the hydrogenation reaction of maleic anhydride.17 Mesoporous TiO2 with pure anatase phase is a good support candidate for the catalytic hydrogenation due to its strong metal–support interaction (SMSI), high chemical stability and acid–base properties, and large surface area, which is extremely favorable for metal dispersion.18
O.14 Among several common acidic oxide supports (Al2O3, TiO2, SiO2), Al2O3 exhibits excellent hydrogenation performance due to its high surface area and acidic sites.15 Compared to Al2O3, mesoporous CeO2 has better Ni dispersion due to its lattice oxygen vacancies and proper pore structure, resulting in an excellent performance in the hydrogenation reaction of maleic anhydride.16 Similarly, the lattice oxygen vacancies within ZrO2 can also form a synergistic catalytic interaction with metallic Ni to improve the activity and selectivity of the catalyst in the hydrogenation reaction of maleic anhydride.17 Mesoporous TiO2 with pure anatase phase is a good support candidate for the catalytic hydrogenation due to its strong metal–support interaction (SMSI), high chemical stability and acid–base properties, and large surface area, which is extremely favorable for metal dispersion.18
In addition, supported noble metal catalysts, such as Pt, Pd, and Ru, are also commonly used in catalytic hydrogenation reactions.19–21 The noble metals are usually loaded on porous carbon materials, such as activated carbon, carbon nanotubes, and bio-based carbon materials. Compared with transition metal catalysts, noble metal catalysts have high activity and selectivity, and fewer side reactions such as condensation, cross-linking and hydrogenolysis. However, the noble metal catalysts are very sensitive to the poisoning of sulfur and arsenic in the reactants, making the hydrogenation cost substantially higher. By adding second metals such as Co, Ce, Cr, Sn, etc., the hydrogenation ability and sulfur poisoning resistance of Pd-based catalysts can be improved.22 Among these second metals, Co has better anti-poisoning effect because it can form an alloy with Pd to make some electrons missing from the surface of Pd, thus reduce the adsorption of sulfide.22 The N-doped carbon material as a support can not only improve the stability and dispersion of Pd, but also provide additional electron activation for Pd metal.23 However, the study on various porous and non-porous oxides supported Pd catalysts indicated that the support did not significantly change the electronic state of Pd, and its activity in the hydrogenation reaction of maleic anhydride depended on the average distance between adjacent Pd particles.24 Ru-based catalysts are considered promising for liquid-phase hydrogenation reactions25 owing to their high hydrogenation activity and low price26,27 compared with other noble metal catalysts.
Currently, the literature related to the study of MTHPA hydrogenation is quite rare. The technology of MHHPA production via MTHPA hydrogenation in China is relatively backward, mostly intermittent reaction process. It is urgent to develop a highly active catalyst to achieve continuous production. In our previous study, the sintering resistance of Ni nanoparticles at high temperatures was improved by coating porous Al2O3 (ref. 28–30) and the catalytic performance in steam reforming reactions was enhanced by employing supported Ni–Ru bimetallic catalysts.31,32
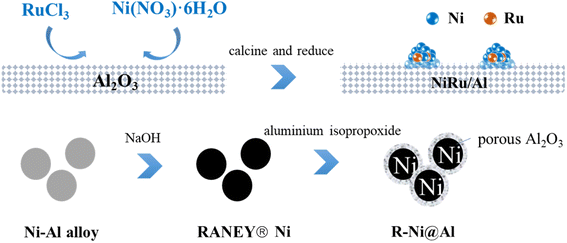
Therefore, in this study, we proposed strategies to strengthen the stability of the RANEY® nickel catalyst by encapsulating porous Al2O3 outside and to improve the catalytic performance by employing Ni–Ru bimetallic catalyst. The effects of porous Al2O3 coating and Ru incorporation on the catalyst structure and performance in the MTHPA hydrogenation reaction were investigated. The difference in surface reactions over Ni and Ni–Ru bimetallic catalysts was elucidated by the in situ DRIFTS technique. The kinetic model of MTHPA hydrogenation over the highly active Ni–Ru catalyst was established to provide a theoretical basis for the future reactor design.
2. Experimental
2.1 Reagents and materials
Ethyl acetate (Greagent, ≥99.5%), anhydrous ethanol (Greagent, ≥99.7%), MTHPA (Zhejiang Zhengda New Material Technology Co., Ltd, anhydride content ≥99.5%, free acid content ≤0.50%), RANEY® nickel (Zhejiang Zhengda New Material Technology Co., Ltd), γ-alumina (Greagent,∼20 nm, ≥99%), nickel nitrate hexahydrate (Ni(NO3)2·6H2O, Sinopharm, ≥98.0%), sodium hydroxide (NaOH, Greagent, ≥96%), ruthenium trichloride (RuCl3, Adamas, ≥97%), aluminum isopropoxide (Adamas, ≥99%), and cetyl alkyltrimethylammonium bromide (CTAB, Sinopharm, ≥99.0%) were received without further purification.2.2 Catalyst preparation
2.3 Catalyst characterization
The BET surface area and pore volume of the samples were obtained from N2 adsorption–desorption isotherms at liquid nitrogen temperature (−196 °C) in a BSD-PS1 specific surface & pore volume analyzer (BSD Corp.). Before analysis, the samples were degassed at 300 °C for 3 h to remove water and impurities. The micropore volumes of the samples were calculated from the N2 adsorption–desorption isotherms by the N–K (original) method. XRD analysis of the samples was performed in a 7000X XRD instrument (SHIMADZU) with Cu-Kα radiation (40 kV, 30 mA). The samples were scanned in the 2 theta range of 20 to 80° with a step size of 0.02°. XPS spectra of the samples were recorded with an ESCALAB 250Xi spectrometer (Thermo Fisher Scientific Corp.). TEM images were recorded with a JEM-2100F microscope operating at 200 kV. SEM-EDS analysis of the samples was performed in an S-4800 microscope (Hitachi). H2-TPR/TPD was recorded with a chemisorption instrument equipped with a gas residual analyzer (Standford RGA-200). For H2-TPR analysis, the temperature was linearly increased to 900 °C at 10 °C min−1 in 6.25 vol% H2/He flow. For H2-TPD analysis, the sample was first in situ reduced at 600 °C for 30 min using H2, then cooled down to room temperature and remained for 30 min. The H2-TPD analysis was performed from room temperature to 600 °C at 10 °C min−1. 13C-NMR and 1H-NMR analysis of the products was conducted in a Bruker 600 MHz spectrometer (AV4600) using dimethyl sulfoxide as the solvent. FTIR analysis of the samples was performed in an IRTracer-100 FTIR spectrometer (SHIMADZU). The samples were scanned 20 times in the range of 400 to 4000 cm−1 at a resolution of 4 cm−1. DRIFTS of the samples was performed in an FTIR spectrometer (IRTracer-100, SHIMADZU) equipped with a high-pressure diffuse reflectance reaction cell (HVC-DRM, Harric) with KBr windows. Approximately 20 mg of the sample was loaded and reduced with 30 mL min−1 of H2 at 600 °C for 30 min. After the temperature decreased to room temperature, 40 mg of MTHPA was loaded onto the catalyst. The background was subtracted when the hydrogen pressure was maintained at 1.0 MPa with a flow rate of 30 mL min−1. The samples were in situ scanned 20 times at different temperatures in the range of 700–4000 cm−1 at a resolution of 4 cm−1. Before each analysis, the samples were kept for 10 min at each specified temperature.2.4 Hydrogenation of MTHPA to MHHPA
The hydrogenation of MTHPA to MHHPA was carried out in a high-pressure stainless-steel batch reactor equipped with a temperature and pressure control system. 15 g of MTHPA was dissolved with 100 g of ethyl acetate and added to the 300 mL Teflon liner together with 0.15 g of the pre-reduced catalyst. Before the reaction, the reactor was replaced with hydrogen at 1.0 MPa three times to exhaust the air. After the temperature and pressure reached the specified values, the reaction was carried out under vigorous stirring at 500 rpm. After the reaction, the catalyst was separated by centrifugation and the composition of the liquid product was analyzed by GC-FID (9790, FULI) equipped with an OV-17 capillary column (30 m × 0.32 mm × 0.25 μm). The column was programmed to ramp up to 80 °C for 1 min, then to 180 °C at a rate of 5 °C min−1, and finally to 260 °C at a rate of 20 °C min−1 for 10 min. GC-MS of the products was conducted in an Agilent 7890 series gas chromatograph with an Agilent 5975A series mass spectrometer.The conversion of MTHPA (αA) and selectivity (SA) of MHHPA were calculated according to the following equations.
Kinetic experiments over NiRu/Al were designed according to the following steps. First, product concentrations were measured at different reaction times at 50, 60, 70 and 80 °C under 2 MPa. Then the conversion of MTHPA was kept within 50% to determine the reaction order of reaction rate versus concentration and calculate activation energy. Hydrogen pressure was varied (1.5, 2.0, 2.5, and 3.0 MPa) at 80 °C for a reaction time of 2 h to determine the reaction order of reaction rate versus hydrogen pressure. All kinetic experiments were carried out using the integral idea, i.e. the reaction order was first assumed, then the reaction kinetic equations were integrated and finally, the integral equations were fitted and verified by experimental data.
3. Results and discussion
3.1 Textural and structural features of the catalysts
The BET surface area and pore volume of the catalysts are listed in Table 1. The surface area of unactivated RANEY® nickel is only 0.14 m2 g−1, indicating its non-porous structure, which is because RANEY® nickel is mainly composed of nickel–aluminum alloy. After activation under alkaline conditions, the surface area of the activated RANEY® nickel (R-Ni) increased to 27.98 m2 g−1 because the metallic Al phase was etched away and the Ni skeleton with high active sites was formed. Due to the presence of porous Al2O3, the pore structure of the R-Ni@Al catalyst was greatly improved with a surface area of 60.67 m2 g−1. According to our previous study, the porous alumina shell was proven to be robust and thermally stable.28 Therefore, the coating of porous alumina was expected to improve the mechanical strength and attrition resistance of the RANEY® nickel skeleton. However, using this strategy, MTHPA need to diffuse to the Ni surface, which was not favorable for the contact between reactants and active sites. The alumina-coated RANEY® nickels showed poorer pore structures than the alumina-supported Ni and Ni–Ru catalysts because of the smaller alumina coating amount to ensure a better MTHPA diffusion. The incorporation of Ni and Ru could block the alumina pores, leading to a decrease in surface area, and some pore structures of Al2O3 also underwent collapse during the calcination procedure.31 However, it is noteworthy that the surface area of NiRu/Al (166.54 m2 g−1) is larger than that of Ni/Al (133.60 m2 g−1) under the same preparation conditions, suggesting that the pre-loaded Ru inhibited the elimination of alumina pore at high temperature. This may be owing to the strong interaction between Ru and Ni, which greatly improves the Ni sintering resistance under high-temperature conditions.| Sample | BET surface area (m2 g−1) | Pore volumea (mL g−1) | Ni contentb (wt%) | Ru contentb (wt%) | Ni dispersionc (%) |
|---|---|---|---|---|---|
| a Micropore volume calculated by H–K (original) method.b Measured by ICP-AES.c Calculated from H2-TPD results, assuming that 1 mol of Ni or Ru active sites adsorb 1 mol of H2. | |||||
| RANEY® Ni | 0.14 | 0 | — | — | — |
| R-Ni | 27.98 | 0.01 | 81.38 | — | 1.13 |
| R-Ni@Al | 60.67 | 0.02 | 64.96 | — | 3.63 |
| Ni/Al | 133.60 | 0.05 | 16.00 | — | 4.09 |
| NiRu/Al | 166.54 | 0.06 | 16.14 | 2.11 | 15.80 |
Fig. 1a shows the XRD patterns of RANEY® Ni catalysts in different states. The unactivated RANEY® Ni shows diffraction peaks at 22.09, 22.84, 24.16, 25.88, 29.66, 35.16, 36.50, 37.44, 41.38, 41.78, 43.69, 45.07, 45.31, 46.03, 47.05, 48.38, and 49.50° (JCPDS 02-0416) corresponding to the Al3Ni phase and the diffraction peaks at 18.09, 25.28, 31.22, 44.65, 45.07, 48.57, 65.29, and 82.52° (JCPDS 14-0648) corresponding to the Al3Ni2 phase. This indicates that the nickel–aluminum alloy is mainly composed of Al3Ni and Al3Ni2, which are the raw phases to form a metallic Ni skeleton. The content of Al3Ni was related to the particle size of the powder, while Al3Ni2 was more resistant to dealloying in the base environment.33 Besides, another diffraction peak at 38.5° was observed owing to the eutectic phase.34 The activated RANEY® nickel (R-Ni) showed diffraction peaks of metallic Ni0 at 44.50, 51.85, and 76.38° (JCPDS 87-0712), indicating that Al was gradually etched away under alkaline conditions to form active Ni skeletons. Meanwhile, the diffraction peak associated with AlNi also appeared at 44.37° (JCPDS 20-0019), indicating that some Al remained in the catalyst and formed an AlNi alloy. RANEY® nickel encapsulated with porous Al2O3 (R-Ni@Al) showed diffraction peaks consistent with R-Ni, indicating that the coating of porous Al2O3 did not change the original crystalline structure of Ni. Because of the amorphous state of the coated Al2O3,28 no diffraction peaks of Al2O3 were observed in the XRD pattern of R-Ni@Al. After reduction at 600 °C, the diffraction peaks of Ni in R-Ni@Al only suffered from a slight increase in intensity, indicating that the Ni skeleton was well preserved because of the protection of the robust alumina shell, showing high resistance to Ni agglomeration under severe conditions.
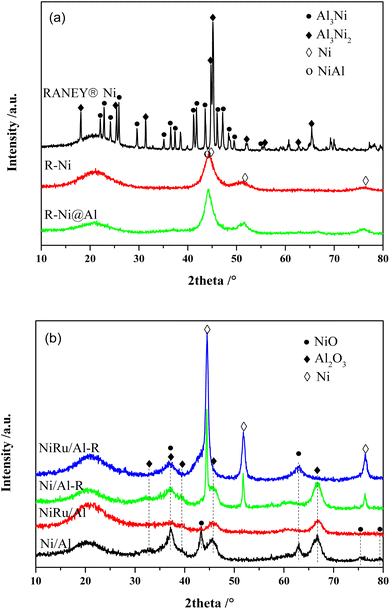 | ||
| Fig. 1 XRD patterns of the catalysts: (a) RANEY® Ni in different states; (b) Ni/Al and NiRu/Al before and after reduction. | ||
The XRD patterns of Ni/Al and NiRu/Al before and after reduction are shown in Fig. 1b. For the calcined state, both Ni/Al and NiRu/Al exhibited diffraction peaks corresponding to NiO (37.25, 43.28, 62.86, 75.39 and 79.39°, JCPDS 71-1179) and Al2O3 (31.85, 45.67, and 66.60°, JCPDS 50-0714). By comparing the diffraction peaks of NiO and Al2O3, their intensities in NiRu/Al are much weaker than those in Ni/Al, indicating that NiRu/Al has a better Ni dispersion and smaller alumina particle size. This is consistent with BET results that the incorporation of Ru inhibits the metal sintering and agglomeration of Al2O3 nanoparticles, showing a good pore structure. Due to the small loading amount of Ru with high dispersion,35 no diffraction peaks associated with the RuO2 phase were observed in the XRD patterns of NiRu/Al. For the reduced state, both Ni/Al-R and NiRu/Al-R showed diffraction peaks at 44.50, 51.85, and 76.38° corresponding to Ni, indicating that NiO was transformed to metallic Ni0 which is the active sites for MTHPA hydrogenation. Compared to Ni/Al-R, NiRu/Al-R showed smaller full width at half maximum for the diffraction peaks of Ni, indicating that the introduction of Ru improved the Ni sintering resistance under reducing conditions, which may be explained by the strong interaction between Ru and Ni, forming more stable Ni–Ru clusters.31 It is noteworthy that the diffraction peak of NiO appears in NiRu/Al-R, indicating that the reduced highly active Ni is easily re-oxidized after exposed to air.
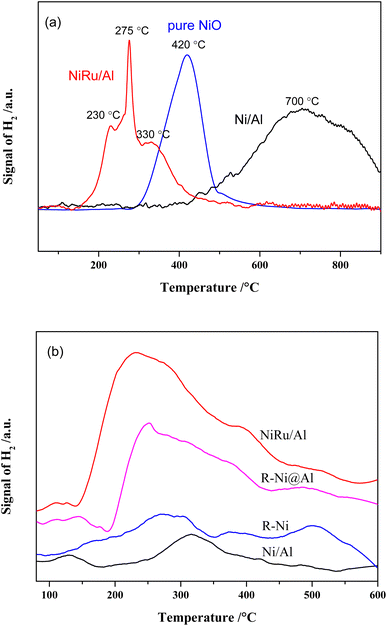
The results of H2-TPR analysis of Ni/Al, NiRu/Al as well as pure NiO prepared by calcining Ni(NO3)2 at 550 °C are shown in Fig. 2a. The reduction of NiO is related with the particle size, Ni–alumina interaction, and Ni–Ru interaction. Depending on different Ni sizes, the reduction peaks of pure NiO appeared at 300–600 °C. There are three reduction peaks for NiRu/Al, which appear mainly in the low-temperature region (152–600 °C). The peak at ∼230 °C is related to the reduction of RuO2,35 the peak at ∼330 °C is attributed to the reduction of NiO, and the peak at 275 °C is supposed to be the reduction of Ni that has interaction with Ru. It is revealed that Ni–Ru interaction makes the reduction temperature lower forming Ni–Ru clusters, which can increase the type and number of active sites in the reduction process. On the contrary, the reduction peaks of Ni/Al mainly appear in the high-temperature region (367–900 °C), where the reduction peaks from 400 to 600 °C are due to the reduction of bulk NiO, while the reduction peaks from 480 to 725 °C are associated with the reduction of NiO that interacts with Al2O3.35 The reduction peak above 725 °C is probably due to the formation of NiAl2O4 species.28,29,35 The strong Ni–Al interaction increases the reduction temperature, resulting in the difficult reduction of NiO and decrease in active sites during the reduction procedure.
H2-TPD analysis can characterize the type of hydrogen adsorbed on the catalyst surface36 and the results are presented in Fig. 2b. It is observed that the H2 desorption peaks for all samples are mainly concentrated between 200 and 400 °C. In addition, H2 desorption peaks with different intensities are also present in the low and high-temperature regions, representing different types of adsorbed H2 species. The amount of hydrogen adsorbed on the surface of the samples was calculated by peak fitting and the dispersion was calculated based on the Ni content as shown in Table 1. It is noticed that the average dispersion of Ni and Ru for NiRu/Al is much higher compared to that of Ni/Al, indicating that the addition of Ru can improve the dispersion of Ni. Considering the H2-TPR results, it appears that this is mainly due to the Ni–Ru interaction resulting in a lower reduction temperature and exposure of more active sites. In contrast, the dispersion of R-Ni and R-Ni@Al is lower, mainly due to their higher Ni content, which makes it more difficult to achieve high dispersion. The Ni dispersion of R-Ni@Al is higher than that of R-Ni, indicating that the Al encapsulation improves the dispersion of RANEY® nickel. This is probably due to the encapsulation of Al making the RANEY® nickel structure more stable and improving the sintering resistance during the H2 reduction procedure.
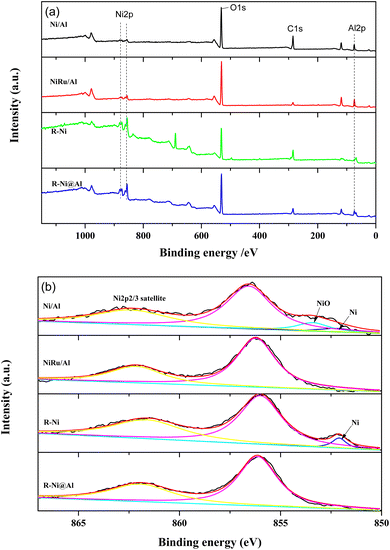
Fig. 3 presents the XPS spectra of the samples. From the XPS surveys, it is observed that the peaks of Ni 2p, O 1s, and Al 2p appear in the samples with different intensities. The peak intensities of Ni 2p in Ni/Al and NiRu/Al are weaker than those of R-Ni and R-Ni@Al, indicating their lower Ni content. While the peak intensity of Al 2p in R-Ni is much lower compared to R-Ni@Al, indicating the leaching of Al during alkaline activation and the encapsulation of Al2O3 on the surface of the Ni skeleton. Fig. 3b shows the peak splitting results of Ni 2p spectra. The binding energies of metallic Ni and NiO appear at 852.1 and 853.4 eV, respectively.36 Peaks of NiO appear in Ni/Al, indicating partial oxidation of Ni to NiO during exposure to air after reduction. Peaks of metallic Ni are present on the surface of Ni/Al and R-Ni, while no peaks of metallic Ni were observed on NiRu/Al and R-Ni@Al, which may be caused by the interaction of Ni with Ru and Al.
Fig. 4 presents SEM-EDS images of the samples. All the samples exhibit irregular bulk shapes. The sizes of Ni/Al and R-Ni are larger, while NiRu/Al and R-Ni@Al show smaller size by adhering many small particles around the bulk. This indicates that the addition of Ru in NiRu/Al improves the sintering resistance of Al2O3, while the encapsulation of Al2O3 in R-Ni@Al improves the stability of the RANEY® nickel skeleton. The EDS analysis of the samples shows that the samples exhibit different contents of Ni, Al, and O. The Ni content in Ni/Al and NiRu/Al is close to the theoretical value (15 wt%). The content of Ni after alkali activation was 76.45 wt% and some of the Al in the resulting Ni skeleton remained. The content of Al in R-Ni@Al increased significantly, indicating that Al2O3 was encapsulated into the RANEY® Ni skeleton.
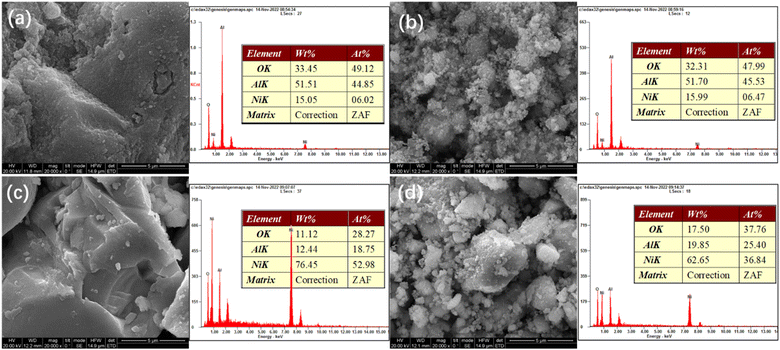 | ||
| Fig. 4 SEM images and EDS analysis of various samples: (a) Ni/Al-R, (b) NiRu/Al-R, (c) R-Ni, and (d) R-Ni@Al. | ||
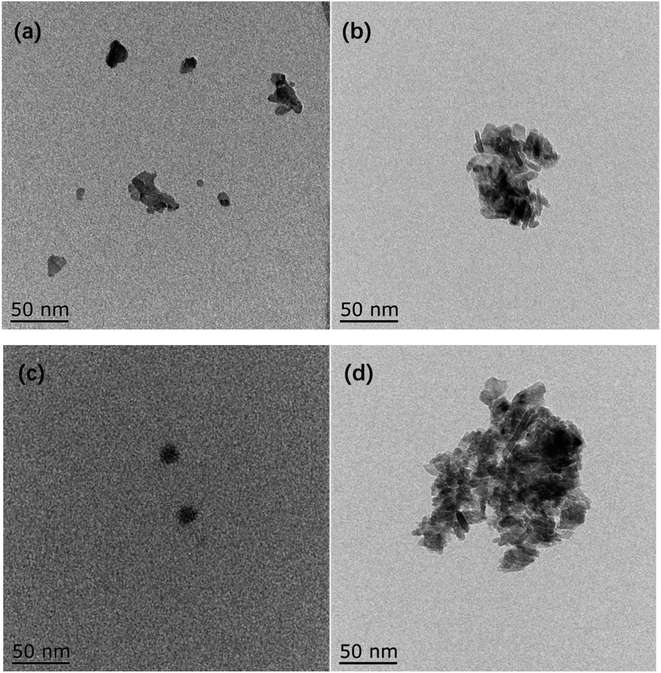
TEM images of catalysts are presented in Fig. 5. The reduced metallic Ni is mainly concentrated in the black region.28 For the Ni/Al sample, less metallic Ni is formed in the black region due to the strong interaction between Ni–Al resulting in a smaller reduction of NiO. For the NiRu/Al sample, on the other hand, the reduction temperature of Ni decreases due to the Ni–Ru interaction and much more metallic Ni is formed. The activated RANEY® nickel is mainly a Ni-based skeleton structure. The Ni body surrounded by grey regions of Al2O3 can be observed in Fig. 5d.
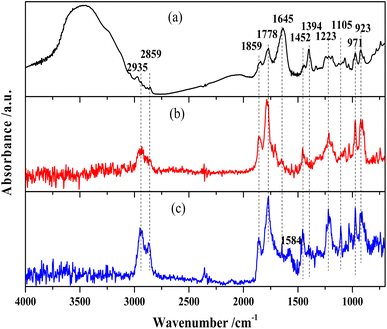
The FTIR spectra of MTHPA and products over R-Ni@Al and NiRu/Al are shown in Fig. 6. The absorption band at 3548 cm−1 is assigned to the free stretching vibration of O–H. MTHPA showed a broad peak in this region, while no peaks were observed for the products over R-Ni@Al and NiRu/Al at 160 °C, indicating that traces of moisture were contained in MTHPA and could be completely removed during the high temperature pretreatment. The absorption bands at 2935 and 2859 cm−1 correspond to the stretching vibration of the C–H bond, while the bands at 1452 and 1223 cm−1 are associated with the deformation vibration of the C–H bond. Compared with the raw material MTHPA, these absorption peaks were significantly enhanced over the two types of catalysts, indicating the hydrogenation of C![[double bond, length as m-dash]](https://www.rsc.org/images/entities/char_e001.gif) C bonds to form the additional C–H bonds. All the samples showed absorption bands at 971 and 923 cm−1 corresponding to the C–C skeleton vibration. Due to the similar C–C molecular structures of MTHPA and MHHPA, the relative intensities of other bands to C–C absorption bands can suggest a change in the molecular structures. The absorption bands at 1859 and 1778 cm−1 correspond to the stretching vibration of C
C bonds to form the additional C–H bonds. All the samples showed absorption bands at 971 and 923 cm−1 corresponding to the C–C skeleton vibration. Due to the similar C–C molecular structures of MTHPA and MHHPA, the relative intensities of other bands to C–C absorption bands can suggest a change in the molecular structures. The absorption bands at 1859 and 1778 cm−1 correspond to the stretching vibration of C![[double bond, length as m-dash]](https://www.rsc.org/images/entities/char_e001.gif) O within the anhydride group (O
O within the anhydride group (O![[double bond, length as m-dash]](https://www.rsc.org/images/entities/char_e001.gif) C–O–C
C–O–C![[double bond, length as m-dash]](https://www.rsc.org/images/entities/char_e001.gif) O). Compared to the absorption peak of the C–C skeleton vibration at 971 and 923 cm−1, the relative intensities of these absorption peaks during the hydrogenation reaction over R-Ni@Al and NiRu/Al are similar to those of the feedstock MTHPA, indicating that C
O). Compared to the absorption peak of the C–C skeleton vibration at 971 and 923 cm−1, the relative intensities of these absorption peaks during the hydrogenation reaction over R-Ni@Al and NiRu/Al are similar to those of the feedstock MTHPA, indicating that C![[double bond, length as m-dash]](https://www.rsc.org/images/entities/char_e001.gif) O was not hydrogenated under the present conditions. The hydrogenation of C
O was not hydrogenated under the present conditions. The hydrogenation of C![[double bond, length as m-dash]](https://www.rsc.org/images/entities/char_e001.gif) O over the Ni or Ru catalysts needs more severe conditions. The absorption peak at 1105 cm−1 corresponds to the stretching vibration of C–O–C within the anhydride. The absorption peaks at 1645 and 1394 cm−1 correspond to the C
O over the Ni or Ru catalysts needs more severe conditions. The absorption peak at 1105 cm−1 corresponds to the stretching vibration of C–O–C within the anhydride. The absorption peaks at 1645 and 1394 cm−1 correspond to the C![[double bond, length as m-dash]](https://www.rsc.org/images/entities/char_e001.gif) C stretching vibration in the carbon ring, indicating that the raw MTHPA has two isomers with different C
C stretching vibration in the carbon ring, indicating that the raw MTHPA has two isomers with different C![[double bond, length as m-dash]](https://www.rsc.org/images/entities/char_e001.gif) C positions. The position of C
C positions. The position of C![[double bond, length as m-dash]](https://www.rsc.org/images/entities/char_e001.gif) C in the ring has a significant effect on the hydrogenation degree due to the steric and conjugation effects caused by the C
C in the ring has a significant effect on the hydrogenation degree due to the steric and conjugation effects caused by the C![[double bond, length as m-dash]](https://www.rsc.org/images/entities/char_e001.gif) O groups. The absorption peak at this location is large for the raw MTHPA owing to the existence of many unsaturated C
O groups. The absorption peak at this location is large for the raw MTHPA owing to the existence of many unsaturated C![[double bond, length as m-dash]](https://www.rsc.org/images/entities/char_e001.gif) C bonds in the molecules. After hydrogenation over R-Ni@Al and NiRu/Al, these peaks almost disappear, indicating that the C
C bonds in the molecules. After hydrogenation over R-Ni@Al and NiRu/Al, these peaks almost disappear, indicating that the C![[double bond, length as m-dash]](https://www.rsc.org/images/entities/char_e001.gif) C bond is converted to a C–C bond, accompanying the growth of the C–H absorption peak at 2935 and 2859 cm−1. It is noteworthy that for NiRu/Al, a new absorption peak appears at 1584 cm−1 corresponding to C
C bond is converted to a C–C bond, accompanying the growth of the C–H absorption peak at 2935 and 2859 cm−1. It is noteworthy that for NiRu/Al, a new absorption peak appears at 1584 cm−1 corresponding to C![[double bond, length as m-dash]](https://www.rsc.org/images/entities/char_e001.gif) C stretching vibration, indicating that the C
C stretching vibration, indicating that the C![[double bond, length as m-dash]](https://www.rsc.org/images/entities/char_e001.gif) C transfer reaction may occur during the hydrogenation process, forming a new isomer of MTHPA. The C
C transfer reaction may occur during the hydrogenation process, forming a new isomer of MTHPA. The C![[double bond, length as m-dash]](https://www.rsc.org/images/entities/char_e001.gif) C transfer towards anhydride groups will increase the hydrogenation difficulty because of conjugation and steric effects, causing a decrease in the MHHPA selectivity.
C transfer towards anhydride groups will increase the hydrogenation difficulty because of conjugation and steric effects, causing a decrease in the MHHPA selectivity.
Fig. 7 shows the DRIFTS results of MTHPA hydrogenation over R-Ni@Al and NiRu/Al at different temperatures. Because the partial pressure of the reaction intermediates in the gas phase increases with the rising temperature, the intensity of all the absorption peaks for the two types of catalysts gradually increases. For either catalyst, no significant change in the relative ratios of the C–H bond absorption peaks (at 2935 and 2859 cm−1) to the C–C absorption peaks (971 and 923 cm−1) at different temperatures was observed, but only the intensity changed with the temperature. Compared to MTHPA, the absorption peaks corresponding to C![[double bond, length as m-dash]](https://www.rsc.org/images/entities/char_e001.gif) C stretching vibration at 1645 and 1394 cm−1 receded and almost did not change with the rising temperature, indicating that the degree of MTHPA hydrogenation reached a limit. Moreover, a high temperature is not always favorable to the hydrogenation reaction because of its exothermic features. By comparing the two catalysts, it is obvious that the percentage of C–H over NiRu/Al is larger than that of R-Ni@Al, indicating its stronger hydrogenation ability. This is mainly because the introduction of Ru gives a better Ni dispersion and forms highly active Ni–Ru clusters.31,37 However, the NiRu/Al catalyst showed a new absorption peak at 1584 cm−1 associated with the C
C stretching vibration at 1645 and 1394 cm−1 receded and almost did not change with the rising temperature, indicating that the degree of MTHPA hydrogenation reached a limit. Moreover, a high temperature is not always favorable to the hydrogenation reaction because of its exothermic features. By comparing the two catalysts, it is obvious that the percentage of C–H over NiRu/Al is larger than that of R-Ni@Al, indicating its stronger hydrogenation ability. This is mainly because the introduction of Ru gives a better Ni dispersion and forms highly active Ni–Ru clusters.31,37 However, the NiRu/Al catalyst showed a new absorption peak at 1584 cm−1 associated with the C![[double bond, length as m-dash]](https://www.rsc.org/images/entities/char_e001.gif) C stretching vibration and its intensity became larger with the increasing temperature, revealing that the introduction of Ru promoted the C
C stretching vibration and its intensity became larger with the increasing temperature, revealing that the introduction of Ru promoted the C![[double bond, length as m-dash]](https://www.rsc.org/images/entities/char_e001.gif) C transfer in the ring and this was favored by the high temperature. The transfer of C
C transfer in the ring and this was favored by the high temperature. The transfer of C![[double bond, length as m-dash]](https://www.rsc.org/images/entities/char_e001.gif) C will increase the difficulty of hydrogenation, resulting in a decrease in the MHHPA selectivity, thus the reaction temperature should not be too high.
C will increase the difficulty of hydrogenation, resulting in a decrease in the MHHPA selectivity, thus the reaction temperature should not be too high.
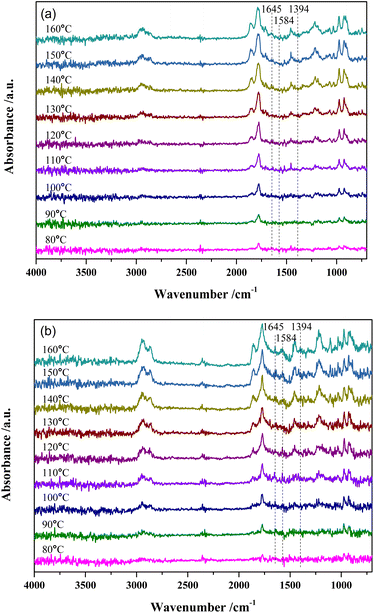 | ||
| Fig. 7 In situ DRIFTS spectra of MTHPA hydrogenation over (a) R-Ni@Al and (b) NiRu/Al at different temperatures. Conditions: 30 mL min−1 H2, 1.0 MPa. | ||
3.2 Catalytic performance in MTHPA hydrogenation
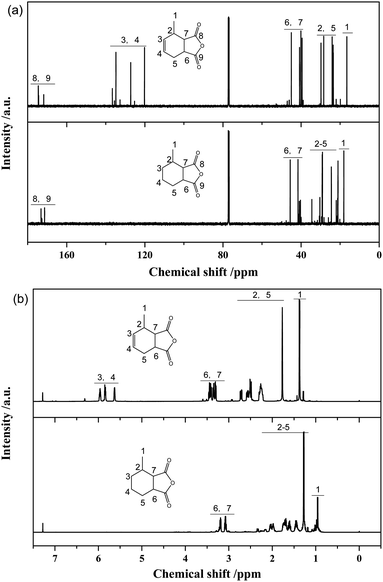
Fig. 8a presents 13C-NMR spectra of MTHPA and MHHPA. The chemical shifts of the carbonyl carbon in the anhydride appear between 175 and 177. Peaks between 38.5 and 47.3 are the chemical shifts of the C attached to the anhydride. The chemical shifts between 17.9 and 20.7 are attributed to the methyl group in the carbon ring. Two peaks with different intensities appear in this region, indicating the presence of MTHPA isomers with different positions of the methyl group in the carbon ring. Chemical shifts between 120 and 137 are associated with the chemical shifts of C in the C![[double bond, length as m-dash]](https://www.rsc.org/images/entities/char_e001.gif) C group.38 Several peaks with different intensities appear in this region, indicating the presence of MTHPA isomers with different C
C group.38 Several peaks with different intensities appear in this region, indicating the presence of MTHPA isomers with different C![[double bond, length as m-dash]](https://www.rsc.org/images/entities/char_e001.gif) C positions. In contrast, for MHHPA after the reaction, the peaks between 120 and 130 disappeared, indicating that the hydrogenation reaction saturated the C
C positions. In contrast, for MHHPA after the reaction, the peaks between 120 and 130 disappeared, indicating that the hydrogenation reaction saturated the C![[double bond, length as m-dash]](https://www.rsc.org/images/entities/char_e001.gif) C. The 1H-NMR spectra of MTHPA and MHHPA are shown in Fig. 8b. Peaks between 5.5 and 6.0 are attributed to the chemical shift of H in the C
C. The 1H-NMR spectra of MTHPA and MHHPA are shown in Fig. 8b. Peaks between 5.5 and 6.0 are attributed to the chemical shift of H in the C![[double bond, length as m-dash]](https://www.rsc.org/images/entities/char_e001.gif) C group. After hydrogenation the peak of MHHPA in this region almost disappears, indicating that the hydrogenation reaction occurs. Similarly, the position, number, and intensity of the corresponding peaks at 1, 2, 5, 6 and 7 change accordingly due to the disappearance of C
C group. After hydrogenation the peak of MHHPA in this region almost disappears, indicating that the hydrogenation reaction occurs. Similarly, the position, number, and intensity of the corresponding peaks at 1, 2, 5, 6 and 7 change accordingly due to the disappearance of C![[double bond, length as m-dash]](https://www.rsc.org/images/entities/char_e001.gif) C and the formation of isomers.
C and the formation of isomers.
Fig. S2† shows the GC-MS spectra of MTHPA and MHHPA. Consistent with the results of the NMR, MTHPA showed two signal peaks at 11.9 and 13.3 min, representing the two isomers of MTHPA. The small peak at 14.80 min, for butylated hydroxytoluene, indicates the presence of a small amount of stabilizer in the feedstock. In the MHHPA product after hydrogenation, besides the large peak at 13.11 min, a smaller signal peak at 12.06 min appeared, reflecting the hydrogenation of two different methyl-positioned MTHPA isomers. Furthermore, some small signal peaks about MTHPA were also present, indicating the occurrence of C![[double bond, length as m-dash]](https://www.rsc.org/images/entities/char_e001.gif) C transfer during the hydrogenation process.
C transfer during the hydrogenation process.
The comparison of the catalytic performance of different catalysts in MTHPA hydrogenation is shown in Fig. 9. As shown in Fig. 9a, all the catalysts showed the conversions of MTHPA gradually increased with the increasing reaction time. NiRu/Al showed the best catalytic performance, which was mainly attributed to the improved Ni dispersion and formed highly active Ni–Ru clusters due to the incorporation of Ru. On the contrary, the Ni/Al catalysts showed the lowest catalytic activity due to their poor pore structure and low metal dispersion. R-Ni also showed poor activity because the activated Ni skeleton was easily oxidized by air although they were stored in ethanol. R-Ni@Al showed a higher conversion than R-Ni, indicating that the encapsulation of porous Al2O3 promoted the catalytic performance of RANEY® Ni, which is owing to the better adsorption of reactants in the porous alumina and easier interaction with the dissociated H on the Ni surface. In addition, the coating of the porous alumina also enhanced the stability of the activated Ni skeleton and inhibited oxidation by air. As shown in Fig. 9b, the MHHPA selectivity over R-Ni and R-Ni@Al is higher than that of NiRu/Al. This is consistent with the DRIFTS analysis that the introduction of Ru promotes the C![[double bond, length as m-dash]](https://www.rsc.org/images/entities/char_e001.gif) C transfer, forming hard hydrogenated MTHPA isomers.
C transfer, forming hard hydrogenated MTHPA isomers.
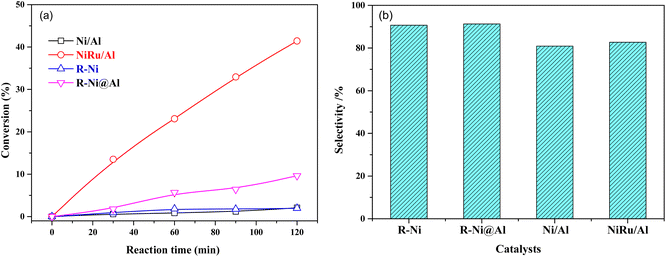 | ||
| Fig. 9 (a) Conversions of MTHPA versus reaction time and (b) selectivity of MHHPA after 2 h of reaction over various catalysts. Conditions: 80 °C, 2.0 MPa. | ||
The effect of reaction temperature on the conversion of MTHPA and selectivity of MHHPA over NiRu/Al is shown in Fig. 10. The conversion of MTHPA and the reaction rate (slope of conversion versus time) increases with the rising temperature. The effect of temperature on the selectivity of MHHPA is small, showing an increasing trend, indicating that the C![[double bond, length as m-dash]](https://www.rsc.org/images/entities/char_e001.gif) C transfer over NiRu/Al has to low sensitivity to the temperature than the hydrogenation reaction. Although the selectivity of MHHPA can be improved by appropriately increasing the temperature, high temperature also promotes the hydrogenation reaction of C
C transfer over NiRu/Al has to low sensitivity to the temperature than the hydrogenation reaction. Although the selectivity of MHHPA can be improved by appropriately increasing the temperature, high temperature also promotes the hydrogenation reaction of C![[double bond, length as m-dash]](https://www.rsc.org/images/entities/char_e001.gif) O, forming aldehydes, acids, and other by-products, which decreases the content of anhydride in the product.39
O, forming aldehydes, acids, and other by-products, which decreases the content of anhydride in the product.39
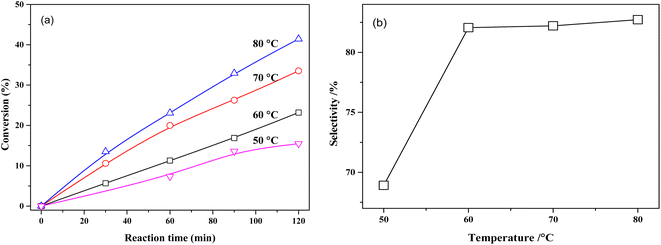 | ||
| Fig. 10 (a) Conversions of MTHPA versus reaction time and (b) selectivity of MHHPA versus reaction temperature after 2 h of reaction over NiRu/Al. Conditions: 2.0 MPa. | ||
The conversion of MTPHA and selectivity of MHHPA over NiRu/Al at different H2 pressures are presented in Fig. 11. Both the conversion of MTPHA and the selectivity of MHHPA showed a rising trend with the increasing pressure due to the increased amount of dissociated H on the catalyst surface. The more H species could accelerate the hydrogenation of MTHPA, showing a higher MHHPA selectivity.
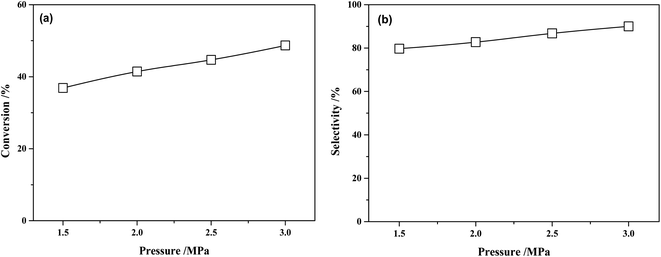 | ||
| Fig. 11 (a) Conversions of MTHPA and (b) selectivity of MHHPA after 2 h of reaction versus reaction pressure over NiRu/Al. Conditions: 80 °C. | ||
Fig. S5† presents the hydrogenation cycle test of the NiRu/Al catalyst. It is observed that after four cycle tests, the conversion of MTHPA only undergoes a slight decrease. The main reason for the decrease in NiRu/Al activity is the weight loss during recycling and partial oxidation when exposed to air.
3.3 Kinetics of MTHPA hydrogenation over NiRu/Al
Under present conditions, the MTHPA hydrogenation reaction is not limited by thermodynamic equilibrium. To make it convenient for subsequent reactor design, the reaction rate is defined as the consumed MTHPA per unit time per unit mass of catalyst. The reaction rate (rA) is related to the MTHPA concentration (xA) and the H2 pressure (pH), which can be written as the following equations.
 | (4) |
Because the pressure is kept constant during the reaction, pHn and k can be combined into k′ Therefore, the reaction rate equation can be written as.
 | (5) |
The mass transfer has a strong influence on liquid-phase hydrogenation over porous catalysts.40 To obtain intrinsic kinetic data for the MTHPA hydrogenation reaction, the effect of internal and external diffusion of the reaction process needs to be eliminated. As shown in Fig. S4,† by varying the stirring speed of the reaction process (500, 600, and 800 rpm), no significant change in the rate of the hydrogenation reaction was observed, indicating that the external diffusion has been eliminated. On the other hand, the effect of internal diffusion can also be neglected since the estimated Cwp = 4.0 × 10⁻⁵ according to Weisz–Prater internal diffusion criterion is rather small. As shown in Fig. 12, −ln(1 − α) and reaction time at different reaction temperatures showed a good linear relationship, indicating that the reaction rate is first order with respect to the MTHPA concentration. The parameter k′ in the model was obtained using the least-squares method and the results are listed in Table 2.
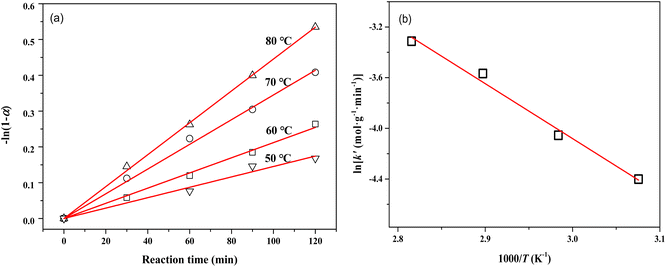 | ||
| Fig. 12 (a) Relations between −ln(1 − α) and reaction time at different temperatures; (b) Arrhenius plots of reaction rate constants versus 1/T for MTHPA hydrogenation over NiRu/Al. | ||
| Temperature /°C | k′ × 103/mol g−1 min−1 | R2 |
|---|---|---|
| 50 | 11.86 ± 0.581 | 0.991 |
| 60 | 17.34 ± 0.360 | 0.998 |
| 70 | 28.21 ± 0.499 | 0.998 |
| 80 | 36.39 ± 0.311 | 0.999 |
The relationship between k′ and T is in accordance with the Arrhenius equation.
 | (6) |
As shown in Fig. 12b, ln![[thin space (1/6-em)]](https://www.rsc.org/images/entities/char_2009.gif) k′ and 1/T showed a good linear relationship. The parameters were estimated by linear fitting and the results are Ea = 37.02 ± 2.62 kJ mol−1 and A′ = 10
k′ and 1/T showed a good linear relationship. The parameters were estimated by linear fitting and the results are Ea = 37.02 ± 2.62 kJ mol−1 and A′ = 10![[thin space (1/6-em)]](https://www.rsc.org/images/entities/char_2009.gif) 537.66 ± 2.53 mol g−1 min−1.
537.66 ± 2.53 mol g−1 min−1.
To determine the reaction order with respect to the hydrogen pressure, the following equation can be obtained by integrating eqn (4) and taking the logarithm on both sides.
 | (7) |
The relationship between ln![[thin space (1/6-em)]](https://www.rsc.org/images/entities/char_2009.gif) pH and ln[−ln(1 − αA)] is presented in Fig. 13a and the slope of the line is 0.5266 by linear regression of the data. Therefore, the reaction order with respect to hydrogen pressure is 0.5. The parameters of the kinetic model were optimized by the least-square method, obtaining the pre-exponential factor A = 7908.62 mol g−1 min−1 MPa−0.5.
pH and ln[−ln(1 − αA)] is presented in Fig. 13a and the slope of the line is 0.5266 by linear regression of the data. Therefore, the reaction order with respect to hydrogen pressure is 0.5. The parameters of the kinetic model were optimized by the least-square method, obtaining the pre-exponential factor A = 7908.62 mol g−1 min−1 MPa−0.5.
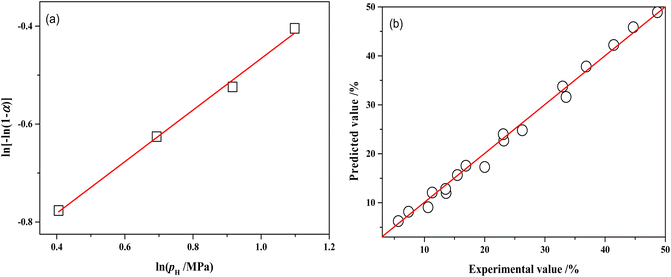 | ||
Fig. 13 (a) Relations between ln[−ln(1 − αA)] and ln![[thin space (1/6-em)]](https://www.rsc.org/images/entities/char_2009.gif) pH over NiRu/Al (80 °C, 120 min); (b) comparisons of the experimental MTHPA conversion with predicted values under different conditions. pH over NiRu/Al (80 °C, 120 min); (b) comparisons of the experimental MTHPA conversion with predicted values under different conditions. | ||
Table S1† shows the comparison of experimental and model-predicted values of MTHPA conversion under different reaction conditions. The model-predicted values are similar to the experimental values with relative errors mostly within 10%. Although the absolute errors of some data points were not large, the relative errors were more than 10%, due to the low conversion of MTHPA under some experimental conditions. As shown in Fig. 13b, all data points distribute uniformly on both sides of the diagonal, indicating that the established kinetic model has good reliability.
3.4 Possible hydrogenation mechanism over NiRu/Al
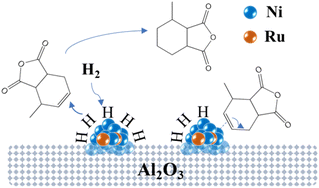
Fig. 14 illustrates the possible mechanism of the hydrogenation of MTHPA over NiRu/Al catalysts, where Ni interacts with Ru to form highly active Ni–Ru sites. H2 adsorbs and dissociates into H on the surface of the Ni–Ru active site under certain pressure, then reacts with the C![[double bond, length as m-dash]](https://www.rsc.org/images/entities/char_e001.gif) C of MTHPA to generate MHHPA. On the other hand, the Ni–Ru active site also activates the C
C of MTHPA to generate MHHPA. On the other hand, the Ni–Ru active site also activates the C![[double bond, length as m-dash]](https://www.rsc.org/images/entities/char_e001.gif) C in MTHPA, causing its transfer and increasing the difficulty of hydrogenation. The activation of H2 on the Ni–Ru surface is related to the partial pressure of H2, and the concentration of H increases with the increasing partial pressure of H2. The higher pressure can make the Ni–Ru surface occupied by more H, reducing the chance of contact with C
C in MTHPA, causing its transfer and increasing the difficulty of hydrogenation. The activation of H2 on the Ni–Ru surface is related to the partial pressure of H2, and the concentration of H increases with the increasing partial pressure of H2. The higher pressure can make the Ni–Ru surface occupied by more H, reducing the chance of contact with C![[double bond, length as m-dash]](https://www.rsc.org/images/entities/char_e001.gif) C in MTHPA, thus improving the hydrogenation activity and selectivity. When the Ni–Ru surface is saturated with H adsorption, the effect of pressure on the hydrogenation reaction becomes less pronounced.
C in MTHPA, thus improving the hydrogenation activity and selectivity. When the Ni–Ru surface is saturated with H adsorption, the effect of pressure on the hydrogenation reaction becomes less pronounced.
4. Conclusions
In this study, porous Al2O3-coated RANEY® nickel and alumina-supported Ni–Ru bimetallic catalysts were prepared to improve the activity and stability of catalysts in the hydrogenation of MTHPA to MHHPA. The results showed that the coating of porous Al2O3 not only improved the mechanical strength of the RANEY® nickel skeleton but also provided more adsorption sites for the reactant molecules, which is favorable to the hydrogenation reaction. The incorporation of Ru improved the dispersion and sintering resistance of Ni, boosting the catalytic performance significantly. However, C![[double bond, length as m-dash]](https://www.rsc.org/images/entities/char_e001.gif) C transfer in the carbon ring was facilitated over Ru, increasing the difficulty of hydrogenation. The selectivity of MHHPA can be improved by appropriately elevating the temperature and increasing the pressure. The results of the kinetic study over the NiRu/Al showed that the reaction orders with respect to the concentration of MHHPA and hydrogen pressure were 1 and 0.5, respectively, and the apparent activation energy was 37.02 ± 2.62 kJ mol−1. The established kinetic model well predicted the conversions of MTHPA under the present conditions, which could provide a theoretical basis for the subsequent reactor design.
C transfer in the carbon ring was facilitated over Ru, increasing the difficulty of hydrogenation. The selectivity of MHHPA can be improved by appropriately elevating the temperature and increasing the pressure. The results of the kinetic study over the NiRu/Al showed that the reaction orders with respect to the concentration of MHHPA and hydrogen pressure were 1 and 0.5, respectively, and the apparent activation energy was 37.02 ± 2.62 kJ mol−1. The established kinetic model well predicted the conversions of MTHPA under the present conditions, which could provide a theoretical basis for the subsequent reactor design.
Conflicts of interest
There are no conflicts to declare.Acknowledgements
The authors would like to acknowledge the funding supports obtained from Zhejiang ZhengDa New Materials Technology Co., Ltd (no. 00522014) and the Scientific Research Foundation of Jiaxing University (no. 70518058).References
- A. I. Barabanova, B. V. Lokshin, E. P. Kharitonova, E. S. Afanasyev, A. A. Askadskii and O. E. Philippova, Polymer, 2019, 178, 121590 CrossRef CAS.
- S. Kumar, S. Mohanty and S. K. Nayak, J. Macromol. Sci., Part A: Pure Appl. Chem., 2020, 57, 654–662 CrossRef CAS.
- A. I. Barabanova, B. V. Lokshin, E. P. Kharitonova, I. V. Karandi, E. S. Afanasyev, A. A. Askadskii and O. E. Philippova, Colloid Polym. Sci., 2019, 297, 409–416 CrossRef CAS.
- A. Wolf, T. Turek and L. Mleczko, Chem. Eng. Technol., 2016, 39, 1933–1938 CrossRef CAS.
- S. K. Tanielyan, S. R. More, R. L. Augustine and S. R. Schmidt, Org. Process Res. Dev., 2017, 21, 327–335 CrossRef CAS.
- Y. Liu, K. Zhou, H. Shu, H. Liu, J. Lou, D. Guo, Z. Wei and X. Li, Catal. Sci. Technol., 2017, 7, 4129–4135 RSC.
- A. A. Philippov, A. M. Chibiryaev and O. N. Martyanov, Catal. Today, 2020, 355, 35–42 CrossRef CAS.
- H. Jiang, S. Lu, X. Zhang, H. Peng and J. Qiao, Catal. Commun., 2019, 118, 60–64 CrossRef CAS.
- B. Rui, Z. Huiji and L. Chenguang, CIESC J., 2005, 56, 847–851 Search PubMed.
- Y. Feng, H. Yin, A. Wang, T. Xie and T. Jiang, Appl. Catal., A, 2012, 425–426, 205–212 CrossRef CAS.
- S. Guo and L. Shi, Catal. Today, 2013, 212, 137–141 CrossRef CAS.
- J. Li, W.-p. Tian and L. Shi, Ind. Eng. Chem. Res., 2010, 49, 11837–11840 CrossRef CAS.
- J. Li, Y. Ren, B. Yue and H. He, Chin. J. Catal., 2017, 38, 1166–1173 CrossRef CAS.
- J. Cai, J. Zhu, L. Zuo, Y. Fu and J. Shen, Catal. Commun., 2018, 110, 93–96 CrossRef CAS.
- J. Li, L.-P. Qian, L.-Y. Hu, B. Yue and H.-Y. He, Chin. Chem. Lett., 2016, 27, 1004–1008 CrossRef CAS.
- X. Liao, Y. Zhang, M. Hill, X. Xia, Y. Zhao and Z. Jiang, Appl. Catal., A, 2014, 488, 256–264 CrossRef CAS.
- L. Zhao, J. Zhao, T. Wu, M. Zhao, W. Yan, Y. Zhang, H. Li, Y. Wang, T. Xiao and Y. Zhao, Nanomaterials, 2019, 9, 406 CrossRef CAS PubMed.
- C. C. Torres, J. B. Alderete, C. Mella and B. Pawelec, J. Mol. Catal. A: Chem., 2016, 423, 441–448 CrossRef CAS.
- A. Han, J. Zhang, W. Sun, W. Chen, S. Zhang, Y. Han, Q. Feng, L. Zheng, L. Gu, C. Chen, Q. Peng, D. Wang and Y. Li, Nat. Commun., 2019, 10, 3787 CrossRef PubMed.
- S. Bai, L. Bu, Q. Shao, X. Zhu and X. Huang, J. Am. Chem. Soc., 2018, 140, 8384–8387 CrossRef CAS PubMed.
- A. Na Rungsi, A. Luengnaruemitchai, N. Chollacoop, S.-Y. Chen, T. Mochizuki, H. Takagi and Y. Yoshimura, Appl. Catal., A, 2020, 590, 117351 CrossRef CAS.
- R. Li, J. Zhao, D. Han and X. Li, Chin. Chem. Lett., 2017, 28, 1330–1335 CrossRef CAS.
- Z. Wei, Y. Gong, T. Xiong, P. Zhang, H. Li and Y. Wang, Catal. Sci. Technol., 2015, 5, 397–404 RSC.
- M. A. Kulagina, P. A. Simonov, E. Y. Gerasimov, R. I. Kvon and A. V. Romanenko, Colloids Surf., A, 2017, 526, 29–39 CrossRef CAS.
- Y. Huang, Y. Ma, Y. Cheng, L. Wang and X. Li, Appl. Catal., A, 2015, 495, 124–130 CrossRef CAS.
- X. Cui, A.-E. Surkus, K. Junge, C. Topf, J. Radnik, C. Kreyenschulte and M. Beller, Nat. Commun., 2016, 7, 11326 CrossRef PubMed.
- Y. Ma, Y. Huang, Y. Cheng, L. Wang and X. Li, Catal. Commun., 2014, 57, 40–44 CrossRef CAS.
- J. Pu, K. Nishikado, N. Wang, T. T. Nguyen, T. Maki and E. W. Qian, Appl. Catal., B, 2018, 224, 69–79 CrossRef CAS.
- J. Pu, Y. Luo, N. Wang, H. Bao, X. Wang and E. W. Qian, Int. J. Hydrogen Energy, 2018, 43, 3142–3153 CrossRef CAS.
- J. Pu, E. W. Qian, Y. Luo, K. Kim and M. Peng, Int. J. Hydrogen Energy, 2021, 46, 39108–39121 CrossRef CAS.
- J. Pu, H. Wang, M. Suzuki and E. W. Qian, RSC Adv., 2021, 11, 20570–20579 RSC.
- J. Pu, T. Toyoda and E. W. Qian, Energy Fuels, 2018, 32, 1804–1811 CrossRef CAS.
- Z. Sun, Z.-H. Zhang, T.-Q. Yuan, X. Ren and Z. Rong, ACS Catal., 2021, 11, 10508–10536 CrossRef CAS.
- H. Hu, M. Qiao, S. Wang, K. Fan, H. Li, B. Zong and X. Zhang, J. Catal., 2004, 221, 612–618 CrossRef CAS.
- J. Pu, F. Ikegami, K. Nishikado and E. W. Qian, Int. J. Hydrogen Energy, 2017, 42, 19733–19743 CrossRef CAS.
- J. Zhang, J. Mater. Sci., 2019, 54, 14197–14208 CrossRef CAS.
- A. Ishihara, E. W. Qian, I. N. Finahari, I. P. Sutrisna and T. Kabe, Fuel, 2005, 84, 1462–1468 CAS.
- L. Xiao, Z. Liu, N. Li, S. Li, P. Fu, Y. Wang, J. Huang, J. Chen and X. Nie, New J. Chem., 2020, 44, 16856–16863 RSC.
- H. Zhigen, Shanghai Chem. Ind., 2000, 19–21, DOI:10.16759/j.cnki.issn.1004-017x.2000.05.005.
- G. Zhang, B. L. Scott and S. K. Hanson, Angew. Chem., Int. Ed., 2012, 51, 12102–12106 CrossRef CAS PubMed.
Footnote |
| † Electronic supplementary information (ESI) available. See DOI: https://doi.org/10.1039/d2ra06738b |
| This journal is © The Royal Society of Chemistry 2022 |

