 Open Access Article
Creative Commons Attribution 3.0 Unported Licence
Structure and dissolution of silicophosphate glass
Kazuya Takadaa,
Tomoyuki Tamura *b and
Toshihiro Kasuga
 *a
*a
aDivision of Advanced Ceramics, Nagoya Institute of Technology, Gokiso-cho, Showa-ku, Nagoya 466-8555, Japan. E-mail: kasuga.toshihiro@nitech.ac.jp
bDivision of Applied Physics, Nagoya Institute of Technology, Gokiso-cho, Showa-ku, Nagoya 466-8555, Japan. E-mail: tamura.tomoyuki@nitech.ac.jp
First published on 7th December 2022
Abstract
P2O5–SiO2–Na2O–CaO glasses are promising therapeutic ion-releasing materials. Herein, we investigated the state of silicon (Si) in P2O5–SiO2–Na2O–CaO glass using a model with a composition of 55.0P2O5–21.3SiO2–23.7Na2O (mol%), incorporating a six-fold-coordinated silicon structure ([6]Si). The model was constructed using a classical molecular dynamics method and relaxed using the first-principles method. Further, we experimentally prepared glasses, substituting Na2O for CaO, to investigate the dissolution of glass with varying [6]Si and PO4 tetrahedra (QPn) distributions (n = number of bridging oxygens (BOs) to neighboring tetrahedra). [6]Si in the glass model preferentially coordinated with QP3. When Si was surrounded by phosphate groups, phosphorus (P) induced the formation of [6]Si by elongating the Si–O distance, and [6]Si acted like a glass network former (NWF). Na+ coordinated with [6]Si–O–P bonds via electrostatic interactions with BO. 31P and 29Si magic-angle-spinning-nuclear-magnetic-resonance spectra of three experimental glass samples with the compositions of 55.0P2O5–21.3SiO2–xCaO–(23.7 − x)Na2O (mol%, x = 0, 12.4, and 23.7) showed that QP3 and [6]Si increased with increasing Na2O. When each glass powder was immersed in a tris-HCl buffer solution at 37 °C, the dissolution of NWF ions and network modifier (NWM) ions increased almost monotonically with time for all samples, indicating that the solubility of the samples was suppressed by the coexistence of CaO and Na2O, attributed to the delocalization of the electron distribution of P in the [6]Si-coordinated QP3 units compared to that in the P- or [4]Si-coordinated QP3 units, which reduces hydrolysis.
1 Introduction
Water-soluble phosphate glasses can promote bone regeneration by releasing inorganic ions as bone-formation-promoting factors. Calcium, phosphate, and silicate ions are involved in bone formation and promote the proliferation, differentiation, and mineralization of osteoblast-like cells at appropriate concentrations. The dissolution of these ions from the glass must be reasonably controlled.The diffusion of glass network modifier (NWM) ions, such as Na+ and Ca2+ ions, in phosphate glass determines the solubility of the glass.1 In the dissolution of phosphate glasses, ion-exchange reactions (hydration reactions) between NWM ions and protons dominate, and NWM ions diffuse to the surface.2–5 To understand the relationship between the phosphate tetrahedral morphology (QPn unit: n is the number of bridging oxygen (BO)) and ion diffusion, we employed ab initio molecular dynamics (MD) simulations to study the dynamics of Na+ ions and protons in phosphate glass.6 As an example of a phosphate glass containing both QP2 and QP3 units, 55.0P2O5–21.3SiO2–23.7Na2O (mol%) glass was simulated using a model in which Na+ ions are replaced by protons, assuming a progressing state of its dissolution. When a proton was adsorbed on the nonbridging oxygen (NBO) of the QP3 unit, it desorbed in a short time within 10 fs and readsorbed on the NBO on which protons had been adsorbed. On the other hand, when a proton was adsorbed on the NBO of the QP2 unit, another proton coordinated before the adsorption could desorb sequentially, resulting in proton diffusion. When Na+ ions were present in the vicinity, proton adsorption on the QP2 unit reduced the electrostatic interaction between Na+ and O2− ions and induced the detachment of Na+ ions. This result explains the much early stages of the glass reaction with water. The solubility of the phosphate glass could be engineered by tuning their QPn distribution.
Dupree et al. reported that a six-fold-coordinated silicon (Si) structure ([6]Si) is readily formed in silicate glasses containing more than 40 mol% P2O5.7 In our previous study, we found that in P2O5–SiO2–Na2O–CaO glasses with high P2O5 content, ion dissolution is improved in an ultraphosphate glass with high [6]Si content.8 We reported the ions release behavior for two types of [6]Si-containing glasses with the P2O5 content of 45 and 50 mol%, fixed SiO2/Na2O/CaO ratios. The glass with high P2O5 content controlled the ion release amounts effectively. Note that the amounts of ions release decreased in silicophosphate glasses containing [6]Si, whereas usually the amount of ions dissolved from SiO2-free P2O5–Na2O–CaO glasses increases with increasing P2O5 content. We predicted that the hydrolysis might be controlled by the formation of Si–O–P bonds between [6]Si and QP3. These results and prediction motivate us to investigate the relation between glass structure and solubility on the basis of the importance of the [6]Si and QPn distribution. By clarifying this, it may be possible to design phosphate glasses so that their solubility can be controlled freely.
In this study, first we attempted visualizing the electron density distribution around [6]Si–QP3 using our earlier 55.0P2O5–21.3SiO2–23.7Na2O glass model and discussed the possible effect of this structure on its solubility. Then, we experimentally verified whether the solubility of P2O5–SiO2–(Na2O, CaO) glasses can be improved by varying [6]Si and QPn distributions. It has been reported that the amount of [6]Si formation in phosphate glass varies not only with P2O5 content but also with the types of NWMs (alkali and/or alkaline earth ions).7,9 In this study, we tried to form some [6]Si and QPn distribution following this phenomenon to investigate the effect of the glass structure on the durability; 55.0P2O5–21.3SiO2–xCaO–(23.7 − x)Na2O glasses (x = 0, 12.4, and 23.1) with fixed P2O5 and SiO2 contents were primarily focused upon.
P2O5–Na2O–CaO glass has been widely studied, especially its structure and chemical durability.1,10–13 However, only a few attempts have been made to modulate its solubility by introducing [6]Si. Silicon plays an effective role in bone formation. In this study, we studied the surroundings of [6]Si in P2O5–SiO2–Na2O glass MD simulations and experimentally examined the solubility of glasses with different [6]Si and QPn distributions by varying the amounts of Na2O and CaO.
2 Experimental section
2.1 Modeling of P2O5–SiO2–Na2O glass by classical MD simulation
In our previous report, we developed a 55.0P2O5–21.3SiO2–23.7Na2O (mol%) glass model using a classical MD program (DL_POLY).14 Details of the simulation can be found in our previous report.6 A system consisting of 510 atoms was melted at 1900 K for 100 ps and then cooled rapidly to 300 K at a rate of 2.0 K ps−1. An NVT ensemble with a Nosé–Hoover thermostat15 was used. The bond angles of O–Si–O and O–P–O bonds were controlled using a three-body screened harmonic potential.16,17 To reproduce a four-coordinated Si structure ([4]Si) and [6]Si, the potential of θ0 = 109.47° and kb = 250 eV rad−1 was assigned to the number of Si atoms corresponding to [4]Si with reference to the coordination number distribution revealed by 29Si magic-angle-spinning-nuclear-magnetic-resonance (MAS-NMR) spectroscopy. The classical MD model was relaxed by density functional theory (DFT) calculations.18,19 We employed the projector augmented-wave (PAW) method20,21 with the generalized gradient approximation (GGA) with the Perdew–Burke–Ernzerhof functional22 for the exchange–correlation energy functional, as implemented in the Viena Ab initio Simulation Package code (VASP).21,23 We used only a single k-point (Gamma point) and plane waves with energies of up to 400 eV. Full structural optimization was performed using a conjugate-gradient method24 until the forces became smaller than 10 meV Å−1. No large structural changes, such as bond recombination, were observed. For the electronic structure analysis, we used a model consisting of 198 atoms prepared under similar conditions.2.2 Glass sample preparation
55.0P2O5–21.3SiO2–xCaO–(23.7 − x)Na2O glasses (mol%; x = 0, 12.4, and 23.7 for samples PSi–Na, PSi–NaCa, and PSi–Ca, respectively) were prepared. H3PO4 (85.0%, solution), SiO2 (99.0%), NaH2PO4 (99.0%) were purchased from Kishida Chemical, Osaka, and CaHPO4·2H2O (98.0%) was purchased from Fujifilm Wako Pure Chemical, Osaka. The reagents were poured mixed with distilled water (DW) in a Pyrex® beaker to form a slurry. The slurry was stirred and then dried overnight under an infrared lamp to obtain the batch mixtures. Thereafter, the products were melted in a platinum crucible in an electric furnace at 1200 °C for 30 min under atmospheric conditions, after which they were cast onto a stainless-steel plate and subjected to iron-press quenching to obtain the glass samples. The compositions of the samples were analyzed by energy-dispersive spectrometry (EDX, JED-2300, JEOL) (Table 1). The compositions of the resulting glass samples were comparable to their nominal compositions.| Glass code | Composition (mol%) | |||
|---|---|---|---|---|
| P2O5 | SiO2 | Na2O | CaO | |
| PSi–Ca | 55.0 (54.0 ± 1.1) | 21.3 (19.3 ± 1.6) | — | 23.7 (26.7 ± 0.7) |
| PSi–NaCa | 55.0 (54.1 ± 1.2) | 21.3 (21.2 ± 2.2) | 11.3 (11.2 ± 0.7) | 12.4 (13.5 ± 1.0) |
| PSi–Na | 55.0 (55.5 ± 0.9) | 21.3 (20.4 ± 1.1) | 23.7 (24.1 ± 1.5) | — |
2.3 Spectroscopic analysis of the glasses
Raman spectroscopy (NRS-3300, JEOL, Tokyo) was performed using an Nd:YAG laser to examine the chemical bonding in the glass samples.MAS-NMR (HNM-ECA A600II, JEOL, Tokyo) analysis was performed to examine the structure around P and Si atoms in the glass samples. 31P MAS-NMR was performed using a 3.2 mm probe with a Larmor frequency of 242.95 MHz, spinning at 20 kHz, under the conditions of a single-pulse experiment with a 1.1 μs width, 5.0 s recycle delay, and cumulated number of 256. Ammonium dihydrogen phosphate (NH4H2PO4, 99%; Kishida Chemical, Osaka) was used as a reference at 1 ppm. 29Si MAS-NMR was performed using an 8.0 mm probe with a Larmor frequency of 119.24 MHz, spinning at 6 kHz, a 5.0 μs pulse width, and a 120.0 s recycle delay. The accumulation was performed 120–360 times depending on the signal-to-noise ratio of the peak. The chemical shift was adjusted to 1.534 ppm for 4-dimethyl-4-silacyclopentane-1-sulfonic acid sodium salt (C6H13NaO3SSi). For the 29Si MAS-NMR measurement, glass samples containing 0.1 wt% MnCO3 were prepared and used to shorten the relaxation time.
2.4 Number of ions dissolved in a tris-HCl buffer solution
A tris-HCl buffer solution (TBS) at pH 7.40 was prepared by dissolving 6.118 g of tris-hydroxymethylaminomethane [NH2C(CH2OH)3, Kishida Chemical, Osaka] in 1 L of DW at 37 °C and adding 1 M HCl (Kishida Chemical, Osaka). Each glass sample was crushed using an alumina mortar and sieved to particle sizes of 125–250 μm. Next, 20 mg of the glass particles were immersed in 20 mL of TBS and stirred using an incubator shaker (KS4000i, IKA, Osaka) at 37 °C and a speed of 125 rpm for 3 days (n = 3). The concentrations of P5+, Si4+, Ca2+, and Na+ ions in the TBS after immersion were measured by inductively coupled plasma atomic emission spectrometry (ICP-AES, ICPS-7000, Shimadzu, Kyoto). Although P and Si existed as phosphate and silicate ions in the solution, they were measured as P5+ and Si4+ ions, respectively, for the convenience of standard reagents.3 Results
3.1 Structural analysis with a PSi–Na glass model
The QPn and Si-coordination number distributions of the simulated model are listed in Table 2. The QPn distribution was estimated assuming that Si acts as an NWF regardless of the coordination number. The network connectivity (NC),25 calculated as the weighted average of the corresponding QPn distributions, was 2.86, which is close to the experimental value (2.80), indicating that [6]Si in the glass acts as an NWF. Although 8.3% of QP4 units, which were not observed in the experiment, were observed in the model, the presence of QP4 units has been reported in several glass systems,26,27 and they could be present. However, considering that the amount of QP4 was small, the simulated and experimental values are comparable. The Si–O coordination number distribution showed 23.8% [4]Si, 9.5% [5]Si, and 70.4% [6]Si. These values are consistent with the experimental results, except for [5]Si, which was not quantitatively evaluated by 29Si MAS-NMR.| QPn distribution (%) and NC | Si–O coordination number distribution (%) | ||||||||
|---|---|---|---|---|---|---|---|---|---|
| QP0 | QP1 | QP2 | QP3 | QP4 | NC | [4]Si | [5]Si | [6]Si | |
| Sim. | 0.0 | 0.0 | 23.1 | 68.5 | 8.3 | 2.86 | 23.8 | 9.5 | 66.7 |
| Exp. | — | — | 19.8 | 80.3 | — | 2.80 | 29.4 | — | 70.9 |
The P–O and Si–O radial distribution functions (RDFs, g(r)) are shown in Fig. 1. The RDF of P–O shows two peaks at 1.47 and 1.58 Å, which are attributed to the P–NBO and P–BO bonds, respectively, and are consistent with X-ray diffraction results for 50P2O5–50Na2O (mol%) glass.28 The RDF of Si–O shows two peaks at 1.64 and 1.77 Å, respectively, which are attributed to the [4]Si–O and [6]Si–O bonds, respectively, and are consistent with X-ray absorption fine structure (XAFS) analysis results for R2O–SiO2–P2O5 (R = Li, Na, and K) glass.9
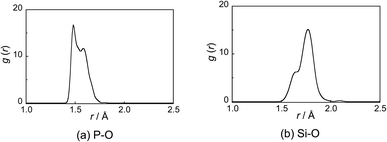 | ||
| Fig. 1 (a) Phosphorus (P)–oxygen (O) and (b) silicon (Si)–O radial distribution functions (RDFs: g(r)) for the PSi–Na model. | ||
The fractions of [4]Si–O–X and [6]Si–O–X (X = P, Si, and Na) bonds are shown in Fig. 2(a). The fractions of [4]Si–O–P and [4]Si–O–Si bonds were 0.85 and 0.15, respectively, which are consistent with the fractions of P and Si in the glass (P![[thin space (1/6-em)]](https://www.rsc.org/images/entities/char_2009.gif) :
:![[thin space (1/6-em)]](https://www.rsc.org/images/entities/char_2009.gif) Si = (55.0 × 2)
Si = (55.0 × 2)![[thin space (1/6-em)]](https://www.rsc.org/images/entities/char_2009.gif) :
:![[thin space (1/6-em)]](https://www.rsc.org/images/entities/char_2009.gif) 21.3), indicating that the phosphate and silicate groups are randomly coordinated to [4]Si. On the other hand, the fractions of [6]Si–O–P and [6]Si–O–Si bonds were 0.96 and 0.04, respectively, indicating that the phosphate group is preferentially coordinated to [6]Si. Fig. 2(b) shows the results divided by the QPn units bound to Si in Fig. 2(a). For the [4]Si–O–P bond, QP2
21.3), indicating that the phosphate and silicate groups are randomly coordinated to [4]Si. On the other hand, the fractions of [6]Si–O–P and [6]Si–O–Si bonds were 0.96 and 0.04, respectively, indicating that the phosphate group is preferentially coordinated to [6]Si. Fig. 2(b) shows the results divided by the QPn units bound to Si in Fig. 2(a). For the [4]Si–O–P bond, QP2![[thin space (1/6-em)]](https://www.rsc.org/images/entities/char_2009.gif) :
:![[thin space (1/6-em)]](https://www.rsc.org/images/entities/char_2009.gif) QP3
QP3![[thin space (1/6-em)]](https://www.rsc.org/images/entities/char_2009.gif) :
:![[thin space (1/6-em)]](https://www.rsc.org/images/entities/char_2009.gif) QP4 = 17.6
QP4 = 17.6![[thin space (1/6-em)]](https://www.rsc.org/images/entities/char_2009.gif) :
:![[thin space (1/6-em)]](https://www.rsc.org/images/entities/char_2009.gif) 76.5
76.5![[thin space (1/6-em)]](https://www.rsc.org/images/entities/char_2009.gif) :
:![[thin space (1/6-em)]](https://www.rsc.org/images/entities/char_2009.gif) 5.9, which is consistent with the ratios estimated from the QPn distribution in the model (Table 2). On the other hand, for the [6]Si–O–P bond, QP2
5.9, which is consistent with the ratios estimated from the QPn distribution in the model (Table 2). On the other hand, for the [6]Si–O–P bond, QP2![[thin space (1/6-em)]](https://www.rsc.org/images/entities/char_2009.gif) :
:![[thin space (1/6-em)]](https://www.rsc.org/images/entities/char_2009.gif) QP3
QP3![[thin space (1/6-em)]](https://www.rsc.org/images/entities/char_2009.gif) :
:![[thin space (1/6-em)]](https://www.rsc.org/images/entities/char_2009.gif) QP4 = 4.9
QP4 = 4.9![[thin space (1/6-em)]](https://www.rsc.org/images/entities/char_2009.gif) :
:![[thin space (1/6-em)]](https://www.rsc.org/images/entities/char_2009.gif) 79.0
79.0![[thin space (1/6-em)]](https://www.rsc.org/images/entities/char_2009.gif) :
:![[thin space (1/6-em)]](https://www.rsc.org/images/entities/char_2009.gif) 16.0, with QP3 showing higher values, indicating that QP3 units are preferentially coordinated to [6]Si.
16.0, with QP3 showing higher values, indicating that QP3 units are preferentially coordinated to [6]Si.
 | ||
| Fig. 2 Bridging-type distribution probability of QPn species estimated from a PSi–Na glass model. (a) Si–O–X (X = P, Si, and Na) and (b) Si–O–P bonds. | ||
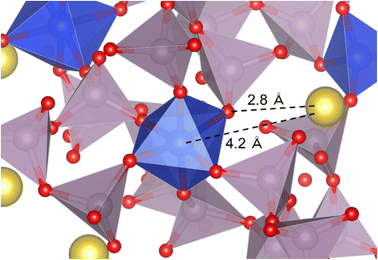
Fig. 3 shows an example of a coordination model around the SiO6 octahedron. The Na+ is located 4.2 Å away from [6]Si and interacts electrostatically with BO in the [6]Si–O–P bond at an interatomic distance of 2.8 Å.
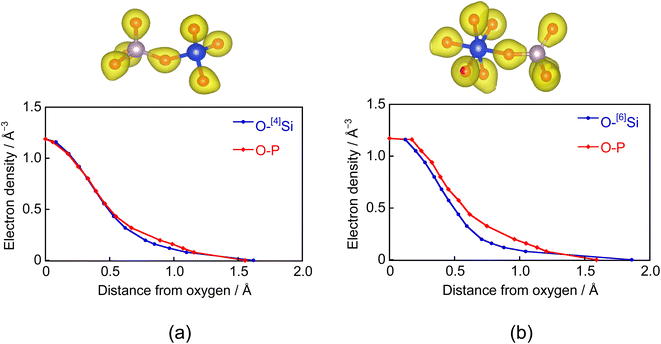
Fig. 4 shows the electron densities between the O–Si and O–P atoms in the Si–O–P bond. The horizontal axis represents the distance from BO in the bond direction. Electrons between the O–[4]Si atoms in the [4]Si–O–P bond are strongly attracted toward O. However, since the electronegativities of Si and P are close, their distributions are similar. A similar trend was observed between the O–[6]Si atoms forming [6]Si–O–P bonds. However, the distribution differs from that between O–P atoms, showing a strong distribution toward the O side. These results indicate that the [6]Si–O bond is more ionic than the [4]Si–O bond. To confirm this, we evaluated the Born effective charges in SiO2 crystals via first-principles force calculations under an electric field,29 similar to our previous study.30 Born effective charges for [4]Si and O in alpha-quartz SiO2 are 3.46 and −1.73, and those for [6]Si and O in stishovite SiO2 are 4.04 and −2.02.
3.2 Spectroscopic analysis of the glass structures
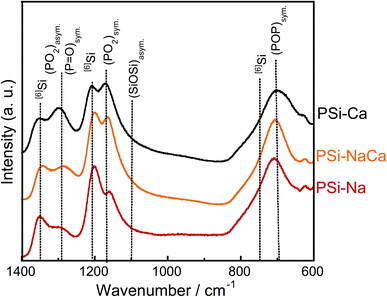
Fig. 5 shows the Raman spectra of the glass samples. They show peaks corresponding to P–O–P symmetric vibration around 700 cm−1 ((POP)sym.),31,32 [4]Si–O–[4]Si asymmetric vibration around 1100 cm−1 ((SiOSi)asym.),33 [4]Si–O–[4]Si symmetric vibration around 1170 cm−1, O–P–O symmetric vibrations of NBO ((PO2)sym.),31,32 O–P–O asymmetric vibrations with NBO ((PO2)asym.),34 and P![[double bond, length as m-dash]](https://www.rsc.org/images/entities/char_e001.gif) O symmetric vibrations with NBO ((P
O symmetric vibrations with NBO ((P![[double bond, length as m-dash]](https://www.rsc.org/images/entities/char_e001.gif) O)sym.)31,32 around 1280 cm−1. Peaks related to [6]Si are observed around 740, 1200, and 1350 cm−1.35,36 The peaks originating from NBO vibrations ((PO2)sym., (PO2)asym., and (P
O)sym.)31,32 around 1280 cm−1. Peaks related to [6]Si are observed around 740, 1200, and 1350 cm−1.35,36 The peaks originating from NBO vibrations ((PO2)sym., (PO2)asym., and (P![[double bond, length as m-dash]](https://www.rsc.org/images/entities/char_e001.gif) O)sym.) blue-shifted with the addition of CaO, attributed to the weakening of the P–NBO interaction due to the replacement of Na+ ion coordinating to NBO with Ca2+ ion, which has a higher electronegativity. The peaks related to [6]Si (1200 and 1350 cm−1) red-shifted with the addition of Na2O.
O)sym.) blue-shifted with the addition of CaO, attributed to the weakening of the P–NBO interaction due to the replacement of Na+ ion coordinating to NBO with Ca2+ ion, which has a higher electronegativity. The peaks related to [6]Si (1200 and 1350 cm−1) red-shifted with the addition of Na2O.
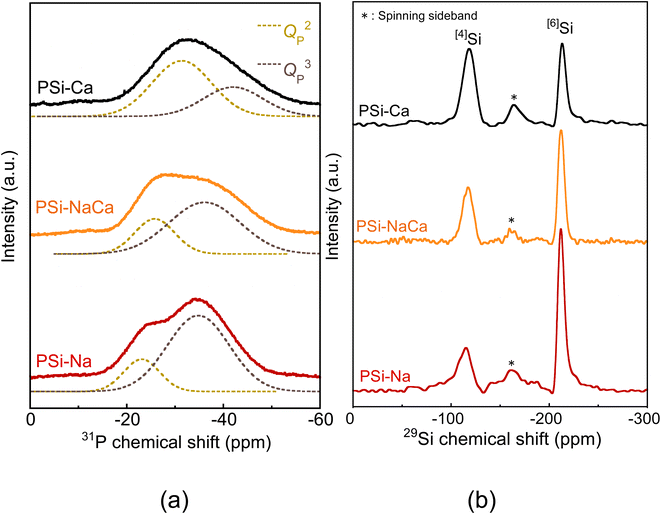
Fig. 6 shows the 31P and 29Si MAS-NMR spectra of the glass samples. The 31P MAS-NMR spectra, which originate from the QP2 and QP3 units, were well fitted by two Gaussian functions. The 29Si MAS-NMR also showed peaks originating from [4]Si at approximately −120 ppm and [6]Si at approximately −210 ppm. The peak near −160 ppm is ascribed to five-fold-coordinated Si,37–39 and it was excluded from the quantitative evaluation since it overlaps with the spinning sideband. Table 3 lists the percentages of the structures estimated from the peaks. The QP3 unit and [6]Si increased with an increase in the amount of Na2O.
| Glass code | QPn distribution (%) | Si–O coordination number distribution (%) | ||
|---|---|---|---|---|
| QP2 | QP3 | [4]Si | [6]Si | |
| PSi–Ca | 65.4 | 34.6 | 62.1 | 37.9 |
| PSi–NaCa | 27.6 | 72.4 | 43.7 | 56.3 |
| PSi–Na | 19.7 | 80.3 | 29.1 | 70.9 |
3.3 Dissolution of the glasses in a TBS
Fig. 7 shows the percentage of ions dissolved in TBS, which is the ratio of the dissolved ions from the glass to the ion amount in the glass before immersion. The dissolution of the NWF components (P5+ and Si4+) and the NWM components (Na+ and Ca2+) increased almost monotonically with time for all glasses. The changes were larger for PSi–Na, PSi–Ca, and PSi–NaCa, in that order. In all samples, the ionic dissolution behavior of the NWF and NWM components were similar and judged to be congruent: almost all of PSi–Na was dissolved after 48 h of immersion. Uo et al. reported that binary P2O5–(100 − a)Na2O (mol%, a = 50–80) glass samples dissolved rapidly within 5 h of immersion in DW; thus, the dissolution of the glass in this study was considerably controlled.1 Furthermore, the solubility of PSi–NaCa is suppressed more effectively than that of PSi–Ca, whereas that of P2O5–CaO glasses without SiO2 (ref. 3 and 23) is suppressed with an increase in the CaO content.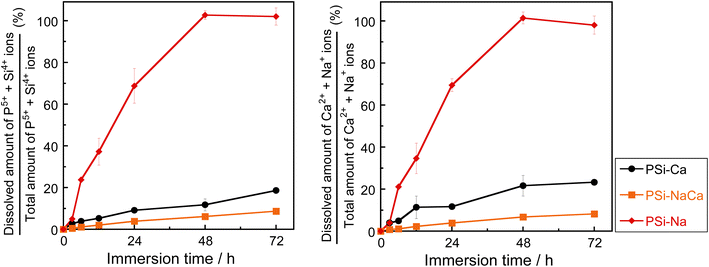 | ||
| Fig. 7 Percentages of ions released in TBS relative to the total amount in the glass samples. Error bar shows the standard deviation. | ||
4 Discussion
4.1 Characteristic structures of glass samples containing six-fold-coordinated silicon
31P and 29Si MAS-NMR analyses revealed increases in the formation of QP3 units and [6]Si with the addition of Na2O. Analysis of the PSi–Na glass model also suggested that [6]Si acts almost exclusively as NWF. These results may indicate that the increase in BO due to the six-fold coordination of Si significantly influences the formation of QP3 units.The [6]Si in the glass model preferentially coordinates to the QP3 unit, and the sharpness of [6]Si peaks in the 29Si MAS-NMR spectra could be attributed to this coordination environment, which is consistent with the experimental structural analysis reported by Ren et al.37 As shown by the RDF of the Si–O bond (Fig. 1(b)), the average of the [6]Si–O interatomic distance is larger than that of the [4]Si–O interatomic distance. Since the electronegativity of P is higher than that of Si, the Si–O interatomic distance would likely be elongated in an environment surrounded by phosphate groups, which favors the formation of [6]Si.
As shown in Fig. 4, the BO in the P–O–[6]Si bond generates strong electrostatic interaction with Na+ ions due to the high electron density around the bond. In the case of the Na2O-containing glass samples, the redshifts of the Raman peaks related to [6]Si (1200 and 1350 cm−1) are most likely due to the influence of NWM ions present near the SiO6 octahedron.
Considering the Na+ ions around [6]Si (within 4.5 Å), as shown in an example in Fig. 3, only one Na+ ion was identified in this model. Miyabe et al.40 proposed a structure with two Na+ ions within 3.5–3.8 Å around [6]Si as charge compensation based on molecular orbital cluster simulation. However, their simulation was based on the assumption that the phosphate groups coordinating to [6]Si are terminated with protons without considering the atomic interactions in the range of medium to long distances, which is different in thus study. Zeng et al.36,41 reported that the QPn distribution in glasses containing [6]Si strongly depends on the number of NWM ions, and the fraction of [6]Si changes after aging slightly below their glass transition temperature (Tg). Thus, they rejected the structure of SiO6 octahedra with two Na+ ions as charge compensation. [6]Si forms in binary P2O5–SiO2 glasses containing no NWM ions.42,43 Based on these results, we conclude that, although Na+ ions have a strong tendency to coordinate around BO in [6]Si–O–P bonds via electrostatic interactions, its number is not limited to two.
4.2 Relationship between glass structure and the ionic dissolution behavior
As shown in Fig. 7, the solubility of the samples decreased in the order of PSi–Na, PSi–Ca, and PSi–NaCa. In PSi–Na, all Ca2+ ions in PSi–Ca and PSi–NaCa were replaced by Na+ ions with lower field strength. Thus, the PSi–Na structure is more open than those of PSi–Ca and PSi–NaCa, resulting in the higher solubility of PSi–Na. The solubility of PSi–NaCa was reduced compared to that of PSi–Ca. Ahmed et al.12 reported that the solubility of P2O5–Na2O–CaO glasses (45 ≤ P2O5 ≤ 60 (mol%)) increases with increasing Na2O content. The coordination state of Si could influence the difference in the dissolution behavior of the glass samples herein from that reported in the previous study.In the PSi–Na glass model, [6]Si coordinates preferentially to the QP3 unit. Wazer et al.44 reported that the QP3 unit is easily hydrolyzed by H2O since the electron distribution around P is localized between P–NBO bonds. In this study, not only the P–O–P bond but also P–O–[4]Si and P–O–[6]Si bonds are present in the glass samples, and the electron density distribution (Fig. 4) shows that the [6]Si–O bond is highly ionic. Since the electron distribution of P in the [6]Si-coordinated QP3 unit would be more delocalized compared to that in the P- or [4]Si-coordinated QP3 units, hydrolysis is reduced. As described in section 4.1, the presence of Na+ ions facilitates the [6]Si formation; in PSi–NaCa, the incorporation of Na+ ions is considered to increase the [6]Si content, resulting in the controlled solubility.
5 Conclusions
We investigated the structure of P2O5–SiO2–Na2O–CaO glass via theoretical simulation and spectroscopy. We found that [6]Si contributes to the formation of the glass network, producing QP3 units with a stable electronic configuration, and [6]Si–O bonds are more ionic than [4]Si–O and P–O bonds. QP3 units are preferentially coordinated to [6]Si, and Na+ ions easily coordinate around [6]Si–O–P bonds by interacting with O in the [6]Si–O–P bond. These results show that incorporating [6]Si into P2O5–SiO2–Na2O–CaO can alter the electronic state of the phosphate groups and the coordination state of the NWM ions. The solubility of the glass samples in a TBS varied nonlinearly with the Na2O content, indicating that the formation of [6]Si could suppress the hydrolysis of the QP3 units and Na+ ion diffusion. Controlling phosphate glass structure using [6]Si is, therefore, an effective technique for tuning the chemical dissolution of the glass. In P2O5–SiO2–Na2O–CaO glass, the [6]Si content and QPn distribution can be controlled by balancing Na2O and CaO contents.Author contributions
All authors contributed to the writing of this manuscript and have approved its final version. K. T.: data curation, formal analysis, visualization, and writing – original draft; T. T.: methodology and writing – review and editing; T. K.: conceptualization, methodology, and writing – review and editing.Conflicts of interest
The authors declare no competing interests.Acknowledgements
This work was partly supported by JSPS KAKENHI grants, #20H00304 and #22H01808. The authors would like to thank Enago (https://www.enago.jp) for the English language review.References
- M. Uo, M. Mizuno, Y. Kuboki, A. Makishima and F. Watari, Properties and cytotoxicity of water soluble Na2O–CaO–P2O5 glasses, Biomaterials, 1998, 19, 2277–2284 CrossRef CAS PubMed.
- N. H. D. L. S. E. Ruiz-Hernandez and R. I. Ainsworth, A molecular dynamics study of the effect of water diffusion into bioactive phosphate-based glass surfaces on their dissolution behavior, J. Non-Cryst. Solids, 2020, 548, 120332 CrossRef.
- A. Tilocca and A. N. Cormack, Modelling the water-bioglass interface by ab initio molecular dynamics simulations, ACS Appl. Mater. Interfaces, 2009, 1, 1324–1333 CrossRef CAS PubMed.
- E. M. Pierce, P. Frugier, L. J. Criscenti, K. D. Kwon and S. N. Kerisit, Modeling interfacial glass-water reactions: recent advances and current limitation, Int. J. Appl. Glass Sci., 2014, 5, 421–435 CrossRef.
- S. H. Hahn and A. C. T. van Duin, Surface reactivity and leaching of a sodium silicate glass under an aqueous environment: a ReaxFF molecular dynamics study, J. Phys. Chem. C, 2019, 123, 15606–15617 CrossRef CAS.
- K. Takada, T. Tamura, H. Maeda and T. Kasuga, Diffusion of protons and sodium ions in silicophosphate glasses: insight based on first-principles molecular dynamic simulations, Phys. Chem. Chem. Phys., 2021, 23, 14580–14586 RSC.
- R. Dupree, D. Holland and M. G. Mortuza, Six-coordinated silicon in glasses, Nature, 1987, 328, 416–417 CrossRef CAS.
- A. Miura, A. Obata and T. Kasuga, Ion release behavior of silicophosphate glasses containing six-fold coordinated silicon structure, Phosphorus Res. Bull., 2022, 38, 1–4 CrossRef CAS.
- J. Ide, K. Ozutsumi, H. Kageyama, K. Handa and N. Umesaki, XAFS study of six-coordinated silicon in R2O–SiO2–P2O5 (R = Li, Na, K) glasses, J. Non-Cryst. Solids, 2007, 353, 1966–1969 CrossRef CAS.
- J. K. Christie, R. I. Ainsworth, S. E. R. Hernandez and N. H. de Leeuw, Structures and properties of phosphate-based bioactive glasses from computer simulation: a review, J. Mater. Chem. B, 2017, 5, 5297–5306 RSC.
- J. C. Knowles, Phosphate based glasses for biomedical applications, J. Mater. Chem., 2003, 13, 2395–2401 RSC.
- A. A. Ahmed, A. A. Ali and A. El-Fiqi, Glass-forming compositions and physicochemical properties of degradable phosphate and silver-doped phosphate glasses in the P2O5–CaO–Na2O–Ag2O system, J. Mater. Res. Technol., 2019, 8, 1003–1013 CrossRef CAS.
- D. A. A. Salazar, P. Bellstedt, A. Miura, Y. Oi, T. Kasuga and D. S. Brauer, Unravelling the dissolution mechanism of polyphosphate glasses by 31P NMR spectroscopy: ligand competition and reactivity of intermediate complexes, Dalton Trans., 2021, 50, 3966–3978 RSC.
- I. T. Todorov, W. Smith, K. Trachenko and M. T. Dove, DL_POLY_3: new dimensions in molecular dynamics simulations via massive parallelism, J. Mater. Chem., 2006, 16, 1911–1918 RSC.
- S. Nosé, A unified formulation of the constant temperature molecular dynamics methods, J. Chem. Phys., 1984, 81, 511–519 CrossRef.
- A. Pedone, G. Malavasi and M. C. Menziani, Computational insight into the effect of CaO/MgO substitution on the structural properties of phosphosilicate bioactive glasses, J. Phys. Chem. C, 2009, 113, 15723–15730 CrossRef CAS.
- A. Tilocca, N. H. de Leeuw and A. N. Cormack, Shell-model molecular dynamics calculation of modified silicate glasses, Phys. Rev. B: Condens. Matter Mater. Phys., 2009, 73, 104209 CrossRef.
- P. Hohenberg and W. Kohn, Inhomogeneous electron gas, Phys. Rev., 1964, 136, B864–B871 CrossRef.
- W. Kohn and L. J. Sham, Self-consistent equations including exchange and correlation effects, Phys. Rev., 1965, 140, A1133–A1138 CrossRef.
- P. E. Blöchl, Projector augmented-wave method, Phys. Rev. B: Condens. Matter Mater. Phys., 1994, 50, 17953–17979 CrossRef PubMed.
- G. Kresse and D. Joubert, Efficient iterative schemes for ab initio total-energy calculations using a plane-wave basis set, Phys. Rev. B: Condens. Matter Mater. Phys., 1999, 59, 1758–1775 CrossRef CAS.
- J. P. Perdew, K. Burke and M. Ernzerhof, Generalized gradient approximation made simple, Phys. Rev. Lett., 1996, 77, 3865–3868 CrossRef CAS PubMed.
- G. Kresse and J. Furthmüller, Efficient iterative schemes for ab initio total-energy calculations using a plane-wave basis set, Phys. Rev. B: Condens. Matter Mater. Phys., 1996, 54, 11169–11186 CrossRef CAS PubMed.
- M. R. Hestenes and E. Stiefel, Methods of conjugate gradients for solving linear systems, J. Res. Natl. Bur. Stand., 1952, 49, 409–436 CrossRef.
- G. Malavasi, A. Pedone and M. C. Menziani, Study of the structural role of gallium and aluminum in 45S5S bioactive glasses by molecular dynamics simulations, J. Phys. Chem. B, 2013, 117, 4142–4150 CrossRef CAS PubMed.
- A. Nizamutdinova, T. Uesbeck, T. Grammes, D. S. Brauer and L. van Wüllen, Structural role of phosphate in metaluminous sodium aluminosilicate glasses as studies by solid state NMR spectroscopy, J. Phys. Chem. B, 2020, 124, 2691–2701 CrossRef CAS PubMed.
- L. Zhang and H. Eckert, Short- and medium-range order in sodium aluminophosphate glasses: new insights from high-resolution dipolar solid-state NMR spectroscopy, J. Phys. Chem. B, 2006, 110, 8946–8958 CrossRef CAS PubMed.
- K. Suzuki and M. Ueno, Experimental discrimination between bridging and nonbridging oxygen–phosphorus bonds in P2O5, Na2O glass by pulsed neutron total scattering, J. Phys., 1985, 45, 261–265 Search PubMed.
- I. Souza, J. Íñiguez and D. Vanderbilt, First-principles approach to insulators in finite electric fields, Phys. Rev. Lett., 2002, 89, 117602 CrossRef PubMed.
- T. Tamura, S. Tanaka and M. Kohyama, Full-PAW calculations of XANES/ELNES spectra of Ti-bearing oxide crystals and TiO–SiO glasses: relation between pre-edge peaks and Ti coordination, Phys. Rev. B: Condens. Matter Mater. Phys., 2012, 85, 205210 CrossRef.
- I. Ardelean, D. Rusu, C. Andronache and V. Ciobotă, Raman study of xMeO·(100 − x)[P2O5·Li2O] (MeO = Fe2O3 or V2O5) glass systems, Mater. Lett., 2007, 61, 3301–3304 CrossRef CAS.
- C. Ivascu, A. T. Gabor, O. Cozar, L. Daraban and I. Ardelean, FT-IR, Raman and thermoluminescence investigation of P2O5–BaO–Li2O glass system, J. Mol. Struct., 2011, 993, 249–253 CrossRef CAS.
- P. González, J. Serra, S. Liste, S. Chiussi, B. León and M. Pérez-Amor, Raman spectroscopy study of bioactive silica based glasses, J. Non-Cryst. Solids, 2003, 320, 92–99 CrossRef.
- M. A. Karakassides, A. Saranti and I. Koutselas, Preparation and structural study of binary phosphate glasses with high calcium and/or magnesium content, J. Non-Cryst. Solids, 2004, 347, 69–79 CrossRef CAS.
- H. Yamashita, H. Yoshino, K. Nagata, I. Yamaguchi, M. Ookawa and T. Maekawa, NMR and Raman studies of Na2O–P2O5–SiO2 glasses, J. Ceram. Soc. Jpn., 1998, 106, 539–544 CrossRef CAS.
- H. Zeng, Q. Jiang, X. Li, F. Ye, T. Tian, H. Zhang and G. Chen, Anneal-induced enhancement of refractive index and hardness of silicophosphate glasses containing six-fold coordinated silicon, Appl. Phys. Lett., 2015, 106, 021903 CrossRef.
- J. Ren and H. Eckert, Superstructural units involving six-coordinated silicon in sodium phosphosilicate glasses detected by solid–state NMR spectroscopy, J. Phys. Chem. C, 2018, 122, 27620–27630 CrossRef CAS.
- M. Nogami, K. Miyamura, Y. Kawasaki and Y. Abe, Six-coordinated silicon in SrO–P2O5–SiO2 glasses, J. Non-Cryst. Solids, 1997, 211, 208–213 CrossRef CAS.
- J. F. Stebbins, NMR evidence for five-coordinated in a silicate glass at atmospheric pressure, Nature, 1991, 351, 638–639 CrossRef CAS.
- D. Miyabe, M. Takahashi, Y. Tokuda, T. Yoko and Y. Uchino, Structure and formation mechanism of six-coordinated silicon in phosphosilicate glasses, Phys. Rev. B: Condens. Matter Mater. Phys., 2005, 71, 172202 CrossRef.
- H. Zeng, Q. Jiang, Z. Liu, X. Li, J. Ren, G. Chen, F. Liu and S. Peng, Unique sodium phosphosilicate glasses designed through extended topological constraint theory, J. Phys. Chem. B, 2014, 118, 5177–5183 CrossRef CAS PubMed.
- T. L. Weeding, B. H. W. S. de Jong, W. S. Veeman and B. G. Altken, Silicon coordination changes from 4-fold to 6-fold on devitrification of silicon phosphate glass, Nature, 1985, 318, 352–353 CrossRef CAS.
- M. de Oliveira Jr, B. Altken and H. Eckert, Structure of P2O5–SiO2 pure network former glasses studied by solid state NMR spectroscopy, J. Phys. Chem. C, 2018, 122, 19807–19815 CrossRef.
- J. R. van Wazer and K. A. Holst, Structure and properties of the condensed phosphatesI. Some general considerations about phosphoric acids, J. Am. Chem. Soc., 1950, 72, 639–644 CrossRef CAS.
| This journal is © The Royal Society of Chemistry 2022 |

