 Open Access Article
Nanocomposite of graphene oxide decorated Al-waste sludge for removal of rhodamine B from water†
Buddini Nissanka and
Dilushan R. Jayasundara
 *
*
Department of Physics, University of Colombo, Colombo 00300, Sri Lanka. E-mail: dilushanj@phys.cmb.ac.lk
First published on 14th December 2022
Abstract
The contamination of land and water resources is reaching its breaking point due to increased human activities. This research attempts to provide a smart solution based on the concept of waste to treat waste, in which solid waste from the aluminium anodizing industry is upcycled and used with graphene oxide to engineer a composite material to treat dye contaminated water. Here, highly porous upcycled aluminium waste sludge is combined with less than 1% (w/w) of graphene oxide and then thermally treated to partially reduce the graphene oxide within the nano matrix. Partial reduction enhances π–π interaction with dye molecules while preserving the hydrophilicity and porosity of the overall composite. Studies carried out with rhodamine B, a toxic dye with intense colour, show complete and efficient removal of the dye from water, independent of any pH adjustment. Moreover, the adsorbed material shows no leachate of the dye nor heavy metals back into water over a wide range of pH values. This facilitates alternative product developments such as building materials and eliminates secondary waste generation. Therefore, the composite described herein is sustainable in both material development and in its usage for wastewater treatment and solid waste management.
1. Introduction
Waste management is a complex and resource consuming operation common to all industries. Increasing activities in the agriculture and manufacturing sectors along with the rapidly growing global population that they cater for have intensified the demand for clean water and land usage. The same activities on the other hand have resulted in increased volumes of solid waste and effluent being discharged into the environment. This has led to much pressure being exerted on existing useable land and clean water resources. With a United Nations mandate through sustainable development goals, goal number 6 and 15: “Ensure availability and sustainable management of water and sanitation for all and life on land”, a significant worldwide attempt is being made to solve these problems.1The complexity of constituents and their concentration in wastewater poses a greater challenge for effluent treatment to the point of reuse or discharge into the environment. Among these pollutants in wastewater, organic dyes with intense color and high toxicity have been identified as a significant contaminant. It has been estimated that over 90![[thin space (1/6-em)]](https://www.rsc.org/images/entities/char_2009.gif) 000 different dyes are used in various industries, consuming around 700
000 different dyes are used in various industries, consuming around 700![[thin space (1/6-em)]](https://www.rsc.org/images/entities/char_2009.gif) 000 tons of dye annually.2 Rhodamine B (RhB) is a synthetic cationic dye that is water soluble and extensively utilized as a colorant for cosmetic, textile, paint, food, ink and paper making. It is non-biodegradable and highly resistant to light, heat and oxidants due to the complexity and large size of their structure.3,4 It also tends to accumulate in living organisms and causes serious health issues to brain, liver, reproductive and nervous systems due to its high toxicity, mutagenicity and carcinogenicity.5,6 Therefore, the contamination of water even with very low quantities of RhB (1 ppm) is highly undesirable and significantly affects both humans and aquatic life.7 Thus, the removal of this dye from wastewater to the required environmental quality standards is urgent and highly challenging for researchers.
000 tons of dye annually.2 Rhodamine B (RhB) is a synthetic cationic dye that is water soluble and extensively utilized as a colorant for cosmetic, textile, paint, food, ink and paper making. It is non-biodegradable and highly resistant to light, heat and oxidants due to the complexity and large size of their structure.3,4 It also tends to accumulate in living organisms and causes serious health issues to brain, liver, reproductive and nervous systems due to its high toxicity, mutagenicity and carcinogenicity.5,6 Therefore, the contamination of water even with very low quantities of RhB (1 ppm) is highly undesirable and significantly affects both humans and aquatic life.7 Thus, the removal of this dye from wastewater to the required environmental quality standards is urgent and highly challenging for researchers.
Among several treatment techniques, adsorption onto solid materials is considered as a most reliable and efficient method to treat dyes in wastewater since it is simple, economically feasible, and easy for operation.2,8–10 Therefore, adsorbents with high adsorption capacity and low cost play a crucial role in removing dyes from wastewater. Removal of RhB by adsorption using cost-effective adsorbents such as agricultural waste, industrial waste, zeolite, clay, perlite, carbon based materials, and graphene oxide (GO) based materials have been reported.11–14
Recently, industrial waste sludge consists of insoluble metal oxide/hydroxides has been used as a cost effective adsorbent to remove dyes from effluents.15–22 This has attracted significant attention as an adsorbent due to the existence of metals in the type of oxides or hydroxides. The main disposal routes to many of these waste sludge include incineration and landfilling. The management and disposal of sludge is expensive and causes environmental problems like contamination of the land, ground water and air. Therefore, these waste materials with high disposal issues and no economic value can be utilized as a lucrative and eco-friendly alternative to treat toxic dyes.23 However, this metal hydroxide sludge shows higher affinity towards anionic dyes than cationic dyes because of its positive surface charge that favors the anionic dye removal.16,20,24 Therefore, removal of cationic dyes such as RhB using metal hydroxide sludge is neither effective nor efficient.
Graphene oxide (GO) and reduced graphene oxide (rGO) with large surface area have also emerged as potential adsorbents for RhB removal.14,25–29 The presence of predominant oxygenated groups in GO and π–π conjugated structure in rGO provide electrostatic and π–π interactions, respectively, that promote the RhB adsorption. Furthermore, the surface charge density of these GO based materials can easily be adjusted, providing greater control over the dye adsorption process. Even though there are several advantages of GO based materials as potential adsorbent, the separation of the dye adsorbed GO from the reaction vessel under industrial conditions is highly challenging. In most cases, other chemicals, such as coagulants and flocculants are required to facilitate separation, which can itself create a secondary pollutant. Furthermore, despite the ease of production and its cost effectiveness, the usage of GO is mostly limited to the field of research. Thereby, the utilization of this material for industrial application on a large scale basis is still in its infancy.
In this study, we describe the preparation of a commercially viable composite from waste Al hydroxide sludge discharged from the anodizing industry and GO, and its application for the removal of RhB, from water. In this method, upcycled Al hydroxide sludge is mixed with a minimum amount of GO and then thermally reduced to partially reduced graphene oxide (pGO) within the mixture. This composite of porous Al hydroxide sludge with pGO favors the synergic effect of high surface area while preserving hydrophilicity; hence improving the dye adsorption capacity. Therefore, this composite can be utilized as a potential adsorbent for efficient dye removal on large scale application.
2. Materials and method
2.1. Chemicals and materials
Sodium hydroxide (Sigma Aldrich), nitric acid (≥69%, Sigma Aldrich), hydrogen peroxide (30.0 w/v%, Breckland Scientific Supplies), phosphoric acid (88%, Sigma-Aldrich), potassium permanganate (Research-Lab Fine Chem Industries), sulfuric acid (98%, Sigma Aldrich), sodium chloride (≥99.5%, Sigma Aldrich), and rhodamine B (≥98%, Thermo Scientific) were used as received. All aqueous solutions were prepared using deionized (DI) water.2.2. Synthesis of GO
The Improved Hummers' method was used to synthesize GO using high purity vein type graphite (99.9%, Bogala) from Sri Lanka.30,31 Concisely, a mixture of graphite and KMnO4 (mass ratio of 1![[thin space (1/6-em)]](https://www.rsc.org/images/entities/char_2009.gif) :
:![[thin space (1/6-em)]](https://www.rsc.org/images/entities/char_2009.gif) 6) was added to a mixture of conc. H2SO4 and conc. H3PO4 (volume ratio of 9
6) was added to a mixture of conc. H2SO4 and conc. H3PO4 (volume ratio of 9![[thin space (1/6-em)]](https://www.rsc.org/images/entities/char_2009.gif) :
:![[thin space (1/6-em)]](https://www.rsc.org/images/entities/char_2009.gif) 1) that was kept at 0 °C, under continuous stirring. Here, an exothermic reaction raised the temperature of the mixture slightly to 35–40 °C. Then, the reaction mixture was heated up to 50 °C while stirring and kept at this temperature for 12 h. Afterwards, the mixture was allowed to cool to room temperature before being poured into ice flakes (400 g). In order to stop the reaction, 10 mL of 30% (w/v) H2O2 solution was added slowly, where the color of the mixture turned yellow. Next, the mixture was allowed to settle down before decanting the supernatant. The residual solid material was rinsed several times using DI water until the rinse water pH became more than 5. GO sludge (25 mL) was evaporated on a Petri dish and prepared GO films that were vacuum desiccated before experimental use.
1) that was kept at 0 °C, under continuous stirring. Here, an exothermic reaction raised the temperature of the mixture slightly to 35–40 °C. Then, the reaction mixture was heated up to 50 °C while stirring and kept at this temperature for 12 h. Afterwards, the mixture was allowed to cool to room temperature before being poured into ice flakes (400 g). In order to stop the reaction, 10 mL of 30% (w/v) H2O2 solution was added slowly, where the color of the mixture turned yellow. Next, the mixture was allowed to settle down before decanting the supernatant. The residual solid material was rinsed several times using DI water until the rinse water pH became more than 5. GO sludge (25 mL) was evaporated on a Petri dish and prepared GO films that were vacuum desiccated before experimental use.
2.3. Preparation of GO-modified aluminium hydroxide sludge (pGO-mAHS)
First, Al sludge obtained from the aluminium anodizing industry (Lanka Aluminium PLC) was dried in an oven up to 200 °C to remove water. The dried sludge was then ball milled and sieved to obtain powdered form of the Al-hydroxide sludge with particle size less than 100 μm. This is referred to as modified Al hydroxide sludge (mAHS).In the second step, a stable homogeneous GO solution was prepared by dissolving GO in DI water followed by sonication. mAHS (5 g) was weighed and mixed with 10 mL of GO solution to obtain GO loading of 7 mg g−1 (w/w). The paste was then heated at 150 °C for 1 h under vacuum conditions in order to obtain partially reduced GO (pGO). Fig. 1 evidently shows the color change of mAHS to brown color powder after the modification with GO.
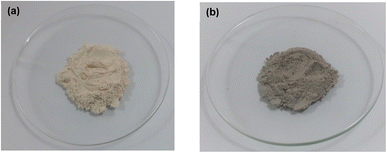 | ||
| Fig. 1 Images of (a) modified Al hydroxide sludge (mAHS, less than 100 μm particle size) and (b) GO-modified Al hydroxide sludge (pGO-mAHS) to visualize the color difference. | ||
2.4. Characterization
The X-ray diffraction (XRD) data was collected between scattering angles (2θ) of 5–40° (GO and pGO) and 5–80° (mAHS and pGO-mAHS) at a scanning rate of 0.02° min−1 using an X-ray diffractometer (D8 Advance Eco, Bruker) with Cu Kα radiation (λ = 1.54056 Å). Raman spectra analysis was carried out on RENISHAW inVia microscope spectrometer with 514 nm laser excitation. Chemical structure characterization was performed using FTIR spectrophotometer (Spectrum Two, PerkinElmer) in ATR mode from 450 to 4000 cm−1 with a resolution of 1.0 cm−1 against an air background. X-ray photoelectron spectroscopy (XPS) analysis was performed at 1 × 10⁻¹⁰ mbar base pressure in an ultra-high vacuum chamber using Thermo Scientific TM ESCALAB Xi+ spectrometer with a monochromatic Al Kα source (1486.6 eV). The spectra were collected with an analyzer resolution of 0.05 eV.Zeta potential of GO, pGO, mAHS and pGO-mAHS was measured using Zetasizer Nano ZS (Malvern). The particle size analysis of mAHS was determined using particle size analyzer (FRITSCH Analysette 22). The total surface area of pGO-mAHS composite was measured with a Brunauer–Emmett–Teller (BET) surface area analyzer (Quantachrome Autosorb iQ) and the average pore size of it was calculated using the Barrett–Joyner–Halenda (BJH) method. Chemical composition of the mAHS was analyzed using a scanning electron microscope (SEM, Zeiss evo LS15) combined with energy dispersive X-ray spectroscopy (EDS). The surface morphology of mAHS and pGO-mAHS were obtained using a SEM (Zeiss evo 18) and a transmission electron microscope (TEM, JEOL JEM-2100). The concentration of the RhB was measured using a UV-visible spectrophotometer (Thermo Scientific). The concentrations of heavy metals that leached from the composite to the treated water and from the dye adsorbed composite to the aqueous solution were measured with inductively coupled plasma – mass spectroscopy (ICP-MS, Agilent 7900). All data were analyzed using a commercial software of Igor Pro 8.
2.5. Dye removal experiment
The removal of RhB dye from the aqueous solution was studied using pGO-mAHS for different contact times at room temperature under neutral conditions. pGO-mAHS (0.3 g) was shaken in 10 mL of RhB solution (2 mg L−1) at 2000 rpm for 1, 5 and 15 min and then allowed for gravity settlement. The supernatant was then filtered through a filter paper (0.45 μm) for analysis. The concentration of the remaining RhB in the filtrate was measured by monitoring the absorbance at its corresponding λmax = 553 nm using a UV-visible spectrophotometer. RhB dye removal using mAHS (0.3 g) was carried out as a control experiment.The initial pH effect on RhB removal was studied at pH values ranging from 2 to 10 using a 30 g L−1 dosage of pGO-mAHS in a dye solution of 2 mg L−1. The initial pH of the dye solution was changed by adding a few drops of 0.1 M HNO3 or 0.1 M NaOH. After 5 min of shaking at 2000 rpm, the concentration of RhB that remained in the filtrate was measured as mentioned above.
The influence of initial dye concentration and contact time on the removal of RhB was investigated at different dye concentrations (2, 3, 4, 5,10, 50 and 100 mg L−1) with a fixed dosage of pGO-mAHS (10 g L−1) at initial pH 6. The solutions were shaken at 2000 rpm and the aliquots were taken out at 5, 15, 30, 45 and 60 min time intervals to determine the effect of contact time.
The ionic strength effect on dye removal was evaluated with varying concentrations of NaCl (0.05, 0.1, 0.5 mol dm−3) using a 10 g L−1 dosage of pGO-mAHS in a 3 mg L−1 dye solution at initial pH 6. After shaking for 5 min at 2000 rpm, the remaining dye concentration was measured.
All these experiments were performed in triplicates. The adsorbed amount of RhB (mg g−1) and the dye removal (%) was calculated using eqn (1) and (2) given below.
 | (1) |
 | (2) |
The leachate of dye from pGO-mAHS composite into aqueous solution was investigated at various initial pH values. Here, RhB adsorbed pGO-mAHS was collected after the adsorption process and dried at 100 °C. RhB adsorbed pGO-mAHS (0.3 g) was then mixed with DI water (10 mL) at initial pH of 3, 7, and 10, and the solutions were kept for a period of 10 months. Dye leaching was then evaluated by measuring the dye concentration in the filtered solution.
In addition, the heavy metals leachate from pGO-mAHS during the dye removal process was studied at different initial pH values. After using pGO-mAHS 3% (w/v) to treat 2 mg L−1 RhB solution at initial pH values of 3, 7, and 10, heavy metal concentration in the treated water was measured by ICP-MS. Similarly, heavy metal leaching from RhB adsorbed pGO-mAHS (3% (w/v)) in DI water was also investigated at initial pH values of 3, 7 and 10, where the solutions were kept for 10 months before analysis.
3. Results and discussion
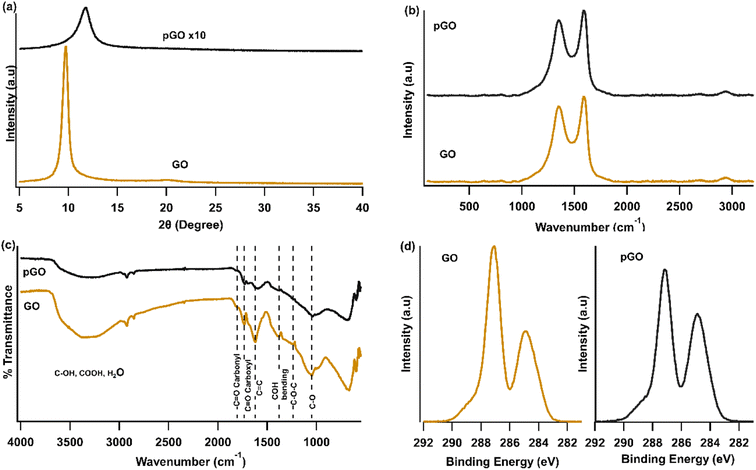
In this study, upcycled waste from the aluminium anodizing industry has been combined with graphene oxide to form a composite material to remove dyes from aqueous solutions. The modified aluminium sludge was mixed with a minimal amount of GO (0.7% (w/w)) and then heated to 150 °C to obtain the new composition. Here, heating is done to partially reduce GO while preserving some of its hygroscopic properties within the composite.The chemical and structural characterization of GO and pGO were performed using FTIR, XPS spectroscopy, XRD and Raman, and results are shown in Fig. 2. While the results of GO are similar to those previously reported,32,33 the spectra of pGO differ from that of GO. Both XRD and Raman data show the extent of structural difference in pGO compared to that of GO. FTIR spectra of both GO and pGO shows presence of similar functional groups. However, the intensities are smaller for pGO compared to that of GO which is evidence of partial reduction of GO during thermal annealing at 150 °C. Furthermore, XPS C 1s spectral data in Fig. 2(d) exhibits a reduction in the O bound carbon to total carbon of pGO compared to GO, which is 61% in GO to that of 55% in pGO. This further confirms the partial reduction in oxygen functionalities of pGO. A more detailed analysis of the spectra shown in Fig. 2 can be seen in the ESI.†
The waste sludge discharged from anodizing industry was dried, ball milled and sieved to obtain mAHS. The mAHS was then analyzed for its average particle size distribution. This is shown in the ESI (Fig. SI1†). The results show that the average particle size of mAHS is approximately 50 μm. The small particle size imparts a high surface area, resulting in an improved adsorptive capacity of the composition towards RhB. The chemical composition of the mAHS was obtained through EDS and is shown in Fig. 3(a). The main elements found are oxygen (74%), aluminium (21%), sulfur (4%), and sodium (1%) in the dry sample. The XRD patterns of mAHS and pGO-mAHS composite are shown in Fig. 3(b). It can be observed that the sharp peaks with maximum intensities at 2θ values of 18.80, 20.29, 27.83, 40.63, and 53.17 are characteristic to the crystal plane of (001), (110), (021)/(111), (13![[1 with combining macron]](https://www.rsc.org/images/entities/char_0031_0304.gif) ), and (202)/(13
), and (202)/(13![[2 with combining macron]](https://www.rsc.org/images/entities/char_0032_0304.gif) ) of aluminium hydroxide (bayerite – PDF: 01-074-1119), respectively. Moreover, the crystalline peak at 2θ value of 26.66 is corresponding to the (001) plane of silicon dioxide (quartz – PDF: 01-085-0794). However, the diffraction peak of pGO is not observed in the XRD spectrum of composite, which can be due to the low amount of GO. The results of EDS and XRD together indicate that mAHS mainly contains aluminium which is generated during the finishing stage of the aluminium anodizing process and is present as aluminium hydroxide.
) of aluminium hydroxide (bayerite – PDF: 01-074-1119), respectively. Moreover, the crystalline peak at 2θ value of 26.66 is corresponding to the (001) plane of silicon dioxide (quartz – PDF: 01-085-0794). However, the diffraction peak of pGO is not observed in the XRD spectrum of composite, which can be due to the low amount of GO. The results of EDS and XRD together indicate that mAHS mainly contains aluminium which is generated during the finishing stage of the aluminium anodizing process and is present as aluminium hydroxide.
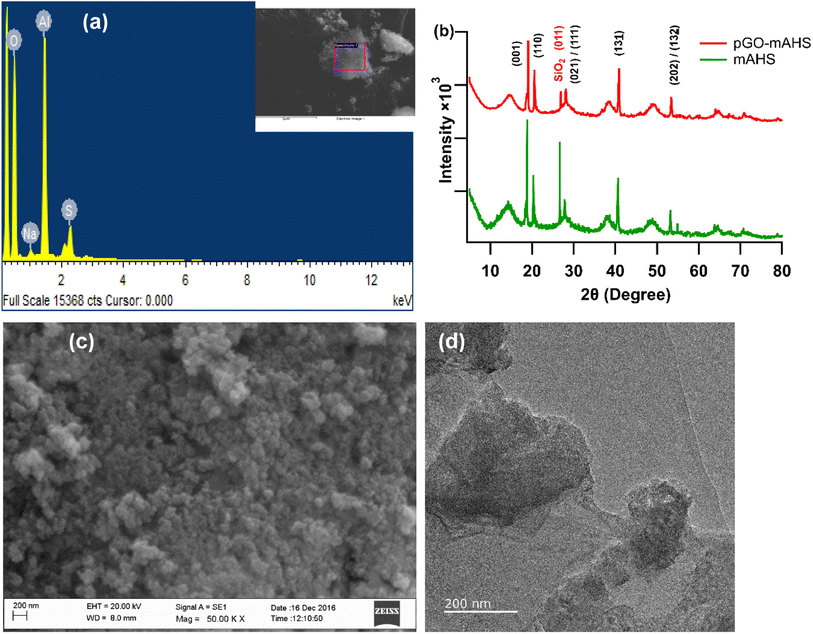 | ||
| Fig. 3 (a) EDS of the mAHS (b) XRD spectra of mAHS and pGO-mAHS (c) SEM image of the mAHS (d) TEM image of the pGO-mAHS. | ||
The morphological features of the mAHS and pGO-mAHS were then analyzed using SEM and TEM as shown in Fig. 3(c) and (d), respectively. The SEM image in Fig. 3(c) shows the porous structure of mAHS. Moreover, the SEM image of the composite in ESI (Fig. SI2†) exhibits the flake-like structure of GO in the composite. The TEM image of composite shown in Fig. 3(d) reveals completely exfoliated GO on the surface of mAHS. This further confirms the absence of diffraction peaks corresponding to pGO in the XRD spectrum of the composite. These microscopic results of the composite indicate the successful incorporation of GO to mAHS through the modification process described above. In addition, the measured zeta potential values of mAHS and GO are 5.1 and −35.2 mV, respectively. This facilitates the electrostatic interactions between the positively charged mAHS and the negatively charged GO, as shown in Fig. SI3(a).† The measured BET surface area of the pGO-mAHS composite is 236.40 m2 g−1, which is greater than that of other stated GO based composite and metal hydroxide sludge adsorbents summarized in Table 1. This high surface area of the composite is due to the combination of GO and porous mAHS. The calculated average pore size of the pGO-mAHS is found to be 5 nm, which is larger than the dimensions of RhB molecule (1.44 nm × 1.09 nm × 0.64 nm).34 This suggests that the RhB molecules can access pores in the composite without space restrictions. Therefore, high surface area along with larger pore size of the composite give possible binding sites to adsorb and trap RhB molecules.
| Adsorbent | Adsorbate (dye) | Surface area (m2 g−1) | Ref. |
|---|---|---|---|
| Carboxy-GO/zeolite | RhB | 17.86 | 35 |
| RGO-Ni nanocomposite | RhB | 18.00 | 28 |
| MOF-5@GO nanocomposite | RhB | 135.37 | 36 |
| Ni-decorated GO-CNT nanocomposite | RhB | 175.35 | 37 |
| Aluminium hydroxide sludge | Reactive blue 222 | 130.00 | 22 |
| Red mud | RhB, Methylene blue, Fast Green | 108.00 | 12 |
| Metal hydroxide sludge (Ca, Fe and Na containing) | Brilliant blue (NB 180) | 87.14 | 18 |
| Metal hydroxide sludge (iron oxide containing) | Congo red, Naphthol Green B | 14.02 | 21 |
| pGO-mAHS | RhB | 236.40 | Current study |
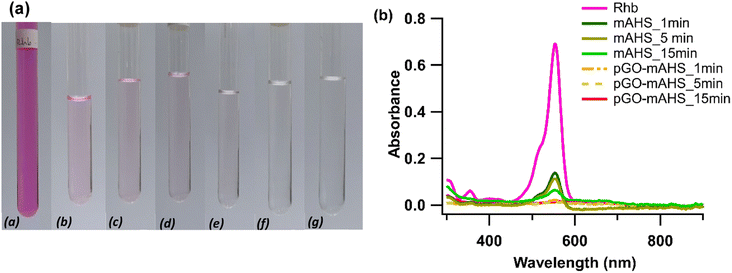
The removal efficiency of RhB by mAHS and pGO-mAHS at three different contact times (1, 5, and 15 min) was studied and the resulting colour changes of filtered supernatant are shown in Fig. 4(a). It can be observed that the residual RhB dye remains in the solution even after the 15 min adsorption by mAHS. However, with the modification of mAHS using GO, the composite showed nearly complete removal of RhB from solution within 1 min contact time. Therefore, pGO-mAHS composite shows high adsorption performance with efficient RhB removal. This is clearly visible from the absorbance spectra of filtered solutions shown in Fig. 4(b). The high adsorption performance of pGO-mAHS can be attributed to the porous structure of mAHS which has the ability to absorb and trap dye molecules. Additionally, early reports have shown the dye adsorption onto reduced GO through π–π interactions.32 Consequently, it can be hypothesized that the pGO adsorbs RhB onto the composite through π–π interactions. Therefore, further modification of mAHS using pGO favors the synergic effect of high surface area; hence improving the adsorption capacity.
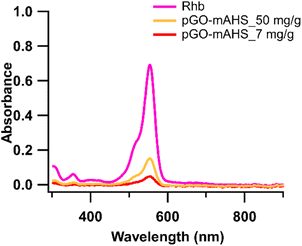
As a result of the observed improvement in RhB adsorption with the incorporation of GO, the dye removal was further studied by increasing the GO loading in the composite. The absorbance spectra of treated water by 0.1 g of pGO-mAHS with GO loadings of 7 mg g−1 and 50 mg g−1 are shown in Fig. 5, where 10 mL of 2 mg L−1 RhB solution was used. It is evident from the spectral data that pGO-mAHS with 7 mg g−1 GO loading shows higher dye removal with 90%, while 73% of dye has been removed with 50 mg g−1 GO loading. This indicates that the dye removal is decreased with increasing GO loading. RhB adsorption onto pGO-mAHS is related directly to synergic effect of high surface area from mAHS and pGO. Therefore, the reduction in dye removal with high content of GO loading can be an indication to restricted access to the porous structure in the composite.
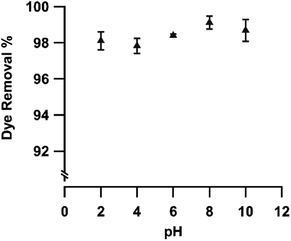
The dye removal process is affected by various parameters such as initial pH, ionic strength, initial dye concentration and contact time. Therefore, the influence of these parameters on the RhB dye removal using pGO-mAHS composite was investigated in the present work. The initial pH effect on the RhB dye removal using pGO-mAHS was studied at different pH values. Fig. 6 shows the change in the dye removal% as a function of pH values. It can be seen that RhB dye removal is >98% with no significant variation observed when the initial pH of the dye solution is varied from 2 to 10. Therefore, the results show that the RhB adsorption onto pGO-mAHS composite is pH independent. Furthermore, the measured zeta potential value of pGO-mAHS composite is 4.6 mV. Both zeta potential and the pH independency, thus confirm that RhB adsorption is associated with π–π interactions between dye molecules and graphitic domains of pGO, as shown in Fig. SI3(c).† This indicates that the pGO-mAHS can be simply utilized for RhB dye removal over a wide range of pH values without the need to adjust the pH.
At various initial RhB concentrations, the removal of RhB using pGO-mAHS was studied as a function of contact time. Fig. 7(a) shows the variation in the amount of RhB adsorbed onto 1 g of pGO-mAHS with contact time at various initial dye concentrations. For all dye concentrations, it can be observed that the RhB adsorption is accelerated in the first 5 min of the contact time and then incrementally increases over time until reaching an equilibrium. Further, the amount of RhB adsorbed onto pGO-mAHS at the equilibrium increases from 0.14 to 0.93 mg g−1 as the initial dye concentration increases from 2 to 50 mg L−1, respectively. However, no further increase in the amount of adsorbed dye is observed at concentration greater than 50 mg mL−1. Moreover, as shown in Fig. 7(a), the rate of initial dye adsorption also increases with the increase in the dye concentration.
 | ||
| Fig. 7 Effect of contact time and initial RhB concentration on (a) the amount of dye adsorbed and (b) dye removal%. Adsorbent dosage: 10 g L−1; initial pH: 6. | ||
Adsorption is a physiochemical process that requires the mass transfer of dye molecules from an aqueous solution to the adsorbent surface. A higher initial dye concentration delivers a strong driving force to minimize resistance of mass transfer of dye molecules between the aqueous and solid phases. Furthermore, as the dye concentration increases, the solution becomes denser, with more dye molecules competing for adsorption sites on the adsorbent surface. Therefore, the probability of RhB molecules colliding with the adsorbent is much higher than that of water molecules, thus increasing the dye adsorption. Once all available adsorption sites have been saturated with RhB, there is no further increase in the amount of dye adsorbed.
Furthermore, Fig. 7(b) shows the variation in the dye removal% as a function of contact time at various initial concentrations of RhB. Even though the amount of RhB adsorbed increased as the initial RhB concentration increased from 2 mg L−1 to 50 mg L−1, the complete removal of the dye was not observed at each concentration level. Further, the highest dye removal% (∼90%) can be seen at low dye concentrations and it decreases with increasing dye concentration. This suggests that the active sites on the pGO-mAHS composition are not fully saturated with RhB.
During dye adsorption, RhB molecules are adsorbed by the pores in the composite and on to the pGO through π–π interactions. Herein, water molecules also compete to occupy the pores, resulting in the active sites being saturated with both RhB and water molecules. At lower dye concentration, less amount of dye molecules are in the solution. Therefore, these molecules can bind to the available active sites in the composition together with water molecules, resulting in higher dye removal%. When the dye concentration is increased, the adsorbed amount of RhB increases, limiting the available adsorption sites in the composition. Thereby, a large number of RhB remains in the solution, resulting in lower dye removal.
This was confirmed by re-using the RhB adsorbed pGO-mAHS multiple times for dye removal after drying at 100 °C. Herein, pGO-mAHS (0.1 g) was shaken with 2 mg L−1 RhB solution (10 mL) at 2000 rpm for 5 min. After the adsorption, the solution was filtered, and absorbance was measured. RhB adsorbed pGO-mAHS was collected and washed with DI water to remove unabsorbed RhB. It was then dried at >100 °C to remove all adsorbed water. The dried RhB adsorbed pGO-mAHS was again shaken with a new RhB solution in the same concentration as mentioned above. This was repeated for several cycles and the results of the dye removal% are shown in Fig. 8. As shown, the dye removal% after each cycle up to the fourth cycle is around 90%, 85%, 65%, and 30%, respectively. The data reveals that RhB is adsorbed onto the pGO-mAHS after each cycle, where the dye removal% reduces as the cycles are repeated. Therefore, at lower dye concentrations, the composite can be re-used over several cycles until active sites are fully saturated with dye molecules. Re-usability of this composite after the RhB adsorption at lower dye concentrations is an important aspect for industrial applications. However, at high concentrations (50 and 100 mg L−1), all the binding sites are saturated with RhB molecules, limiting the re-usability of dye adsorbed composite.
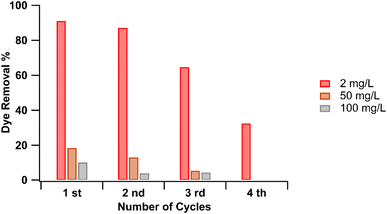 | ||
| Fig. 8 Dye removal% for recycled adsorbent at the RhB concentrations of 2, 50, and 100 mg L−1 for different cycles. | ||
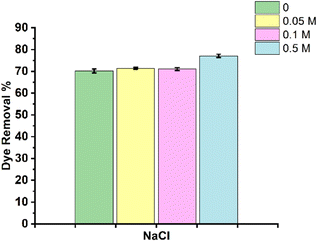
Further, high salt concentrations in solution have been reported to have an effect on dye adsorption.38 Therefore, the influence of the ionic strength on RhB removal was evaluated in the present work using NaCl salt. Fig. 9 shows the RhB dye removal% in the absence and presence of various concentrations of NaCl. As shown, no discernible variation in the dye removal% is seen at lower salt concentrations compared to that in the absence of salt. However, at higher salt concentrations (0.5 mol dm−3), a significant increase in the dye removal is observed. The increased dye removal% can be due to the suppression of the electrostatic repulsion between the positively charged composite and cationic dye molecules. As the concentration of NaCl is increased, the Cl-ions in the solution screen the positive charge on the composite, leading to a reduction in the electrostatic repulsion. Therefore, this enhances the adsorption of RhB through π–π interactions and also its trapping into the pores.
Effectiveness of an adsorbent used in effluent treatment also depends on its ability to retain adsorbed species without letting it back into the environment. Therefore, RhB dye and heavy metals retaining ability of pGO-mAHS composite was analyzed by measuring leachate of these species into aqueous solution. Desorption of RhB from dye adsorbed pGO-mAHS to aqueous solution was evaluated at pH values of 3, 7 and 10. It was found no leachate of RhB occurred at the above acidic, basic and neutral pH values. This can be attributed to the strong interactions between RhB dye molecules and the pGO-mAHS composite surface, which is stable in the given pH conditions.
Furthermore, heavy metals leachate from pGO-mAHS and dye adsorbed pGO-mAHS into aqueous solution at different pH conditions was studied and the results are summarized in Table 2. Heavy metal concentrations leached from both composite and dye adsorbed composite at the pH range of 3–10 are approximately within the limits of Zero Discharge of Hazardous Chemicals (ZDHC) wastewater guidelines. This indicates that after the RhB adsorption the treated water can be safely discharged. In addition, highly stable RhB adsorbed pGO-mAHS composite can be directly disposed through secure landfilling without the need for stabilization. Also, it can be used in other applications, such as producing building materials that could generate a secondary income.
| Heavy metals | Concentration of heavy metals (μg L−1) | ZDHC limit (mg L−1) | |||||
|---|---|---|---|---|---|---|---|
| Leachate from RhB adsorbed pGO-mAHS | Leachate from pGO-mAHS | ||||||
| pH 3 | pH 7 | pH 10 | pH 3 | pH 7 | pH 10 | ||
| Fe | <0.000 | <0.000 | <0.000 | <0.000 | <0.000 | <0.000 | — |
| Ni | 541.330 | 258.794 | 32.737 | 25.022 | 19.161 | 4.916 | 0.2 |
| Cr | 2.769 | 0.574 | 0.465 | 2.024 | 3.992 | 3.275 | 0.2 |
| Zn | 284.708 | 236.491 | 251.450 | 245.275 | 116.917 | 348.177 | 5.0 |
| Cd | 0.527 | 0.143 | 0.031 | 0.255 | 0.095 | 0.035 | 0.1 |
4. Conclusions
In this study, waste aluminium hydroxide sludge with disposal problems and no economic value is upcycled and used with GO to produce an environmentally sustainable and economically viable composite for RhB removal from water. The composite is engineered utilizing the porous structure of dehydrated and ball milled aluminium waste sludge and flake-like structure of GO that together provide a large surface area for dye adsorption. Here, GO facilitates RhB adsorption via π–π interaction and the pores in mAHS act as trapping agents for the dye molecules. The results show complete adsorption and efficient gravity separation of the dye adsorbed composite from water. Furthermore, dye adsorption is pH independent, thus eliminating the need for pH neutralization as is the case with most dye adsorbents used in water treatment. The composite exhibits a great potential to remove RhB at higher dye concentrations, where the increase in dye concentration tends to increase the adsorption of RhB. It is also shown that the composite can be reused under low dye loading conditions up to several cycles simply by heating just above 100 °C. Leachate of both RhB and heavy metal constituents of the composite into water is not detected under acidic or basic conditions, indicating that the adsorbent is stable in either environment. This allows the dye adsorbed composite to be used in other applications such as building materials. Moreover, this composite can be used as an adsorbent for both anionic and cationic dye removal.The use of this composite in the dye removal, especially in industrial effluent treatment, while being efficient will also result in significant reduction in net solid waste being discarded into the environment. With the possibility of full utilization of the solid waste generated at the aluminium anodizing industry to prepare the composite and its use in place of commercial dye adsorbents, where the latter can end up as secondary waste, is largely eliminated. Therefore, the technology reported here provides a sustainable and eco-friendly wastewater treatment and solid waste utilization method that allow for closed loop water reuse or discharge into the environment.
Author contributions
Buddini Nissanka: conceptualization, methodology, formal analysis, writing- original draft. Dilushan R. Jayasundara: conceptualization, methodology, formal analysis, writing- review and editing, supervision.Conflicts of interest
There are no conflicts to declare.Acknowledgements
The financial assistance for this study was given by the research grant of University of Colombo, Sri Lanka (grant number AP/3/2/2016/CG/29). We highly appreciate the support given by Prof. Nilwala Kottegoda, Department of Chemistry, University of Sri Jayewardenepura, Sri Lanka, Department of Geology, University of Peradeniya, Sri Lanka, National Institute of Fundamental Studies (NIFS), Sri Lanka, Techno Solutions (Pvt) Ltd, Sri Lanka, Postgraduate Institute of Science, University of Peradeniya, Sri Lanka, Sri Lanka Institute of Nanotechnology (SLINTEC) and the Department of Chemistry, University of Colombo, Sri Lanka.References
- Take Action for the Sustainable Development Goals, https://www.un.org/sustainabledevelopment/sustainable-development-goals/, United Nations Sustainable Development, accessed 19 July 2022 Search PubMed.
- V. Katheresan, J. Kansedo and S. Y. Lau, J. Environ. Chem. Eng., 2018, 6, 4676–4697 CrossRef CAS.
- J. Tian, M. M. Sharshar, M. Yang, T. Mu and J. Xing, Environ. Prog. Sustainable Energy, 2018, 37, 989–995 CrossRef CAS.
- K. Wang, R. Jin, Y. Qiao, Z. He, Y. Wang and X. Wang, Water Sci. Technol., 2019, 80, 1571–1580 CrossRef CAS PubMed.
- K. Kaur and R. Jindal, J. Environ. Chem. Eng., 2018, 6, 7091–7101 CrossRef CAS.
- Y. Zhou, J. Lu, Y. Zhou and Y. Liu, Environ. Pollut., 2019, 252, 352–365 CrossRef CAS PubMed.
- L. Peng, P. Qin, M. Lei, Q. Zeng, H. Song, J. Yang, J. Shao, B. Liao and J. Gu, J. Hazard. Mater., 2012, 209–210, 193–198 CrossRef CAS PubMed.
- S. Wong, N. A. Ghafar, N. Ngadi, F. A. Razmi, I. M. Inuwa, R. Mat and N. A. S. Amin, Sci. Rep., 2020,(10), 1–13 Search PubMed.
- S. Banerjee and M. C. Chattopadhyaya, Arabian J. Chem., 2017, 10, S1629–S1638 CrossRef CAS.
- P. Kumari, M. Alam and W. A. Siddiqi, Sustainable Mater. Technol., 2019, 22, e00128 CrossRef CAS.
- A. A. Al-Gheethi, Q. M. Azhar, P. Senthil Kumar, A. A. Yusuf, A. K. Al-Buriahi, R. M. S. Radin Mohamed and M. M. Al-shaibani, Chemosphere, 2022, 287, 132080 CrossRef CAS PubMed.
- V. K. Gupta, Suhas, I. Ali and V. K. Saini, Ind. Eng. Chem. Res., 2004, 43, 1740–1747 CrossRef CAS.
- M. Rahmani, M. Kaykhaii and M. Sasani, Spectrochim. Acta, Part A, 2018, 188, 164–169 CrossRef CAS PubMed.
- I. Khurana, A. Saxena, Bharti, J. M. Khurana and P. K. Rai, Water, Air, Soil Pollut., 2017, 228, 1–17 CrossRef CAS.
- S. C. R. Santos, V. J. P. Vilar and R. A. R. Boaventura, J. Hazard. Mater., 2008, 153, 999–1008 CrossRef CAS PubMed.
- S. Netpradit, P. Thiravetyan and S. Towprayoon, Water Res., 2003, 37, 763–772 CrossRef CAS PubMed.
- B. Uçar, A. Güvenç and Ü. Mehmetoğlu, Hydrol.: Curr. Res., 2011, 2, 112 Search PubMed.
- A. M. S. Baptisttella, A. A. D. Araújo, M. C. Barreto, V. S. Madeira and M. A. da Motta Sobrinho, Environ. Technol., 2019, 40, 3072–3085 CrossRef CAS PubMed.
- C. Namasivayam, R. Jeyakumar and R. T. Yamuna, Waste Manag., 1994, 14, 643–648 CrossRef CAS.
- C. K. Lee, K. S. Low and S. W. Chow, Environ. Technol., 1996, 17, 1023–1028 CrossRef CAS.
- M. F. Attallah, I. M. Ahmed and M. M. Hamed, Environ. Sci. Pollut. Res., 2012, 20, 1106–1116 CrossRef PubMed.
- E. Güneş and T. Kaygusuz, Desalin. Water Treat., 2013, 53, 2510–2517 CrossRef.
- S. De Gisi, G. Lofrano, M. Grassi and M. Notarnicola, Sustainable Mater. Technol., 2016, 9, 10–40 CrossRef CAS.
- K. Ramakrishna and T. Viraraghavan, Water Sci. Technol., 1997, 36, 189–196 CrossRef CAS.
- C. Hu, D. Grant, X. Hou and F. Xu, Mater. Today: Proc., 2021, 34, 184–193 CAS.
- X. Wang, Y. Guo, Z. Jia, H. Ma, C. Liu, Z. Liu, Q. Shi, B. Ren, L. Li, X. Zhang and Y. Hu, Desalination, 2021, 516, 115220 CrossRef CAS.
- Y. Zhang, K. Li and J. Liao, Appl. Surf. Sci., 2020, 504, 144377 CrossRef CAS.
- U. Jinendra, D. Bilehal, B. M. Nagabhushana and A. P. Kumar, Heliyon, 2021, 7, e06851 CrossRef CAS PubMed.
- P. Avetta, M. Sangermano, M. Lopez-Manchado and P. Calza, J. Photochem. Photobiol., A, 2015, 312, 88–95 CrossRef CAS.
- D. Perera, A. Abeywickrama, F. Zen, P. E. Colavita and D. R. Jayasundara, Mater. Chem. Phys., 2018, 220, 417–425 CrossRef CAS.
- D. C. D. Marcano, D. D. V. Kosynkin, J. M. Berlin, A. Sinitskii, Z. Z. Sun, A. Slesarev, L. B. Alemany, W. Lu and J. M. Tour, ACS Nano, 2010, 4, 4806–4814 CrossRef CAS PubMed.
- B. Nissanka, N. Kottegoda and D. R. Jayasundara, J. Mater. Sci., 2019, 55, 1996–2005 CrossRef.
- B. Nissanka, N. Jayawardana and D. R. Jayasundara, Mater. Chem. Phys., 2022, 277, 125577 CrossRef CAS.
- J. H. Huang, K. L. Huang, S. Q. Liu, A. T. Wang and C. Yan, Colloids Surf., A, 2008, 330, 55–61 CrossRef CAS.
- Y. Yu, B. N. Murthy, J. G. Shapter, K. T. Constantopoulos, N. H. Voelcker and A. V. Ellis, J. Hazard. Mater., 2013, 260, 330–338 CrossRef CAS PubMed.
- G. Kumar and D. T. Masram, ACS Omega, 2021, 6, 9587–9599 CrossRef CAS PubMed.
- C. Hu, A. T. Le, S. Y. Pung, L. Stevens, N. Neate, X. Hou, D. Grant and F. Xu, Mater. Chem. Phys., 2021, 260, 124117 CrossRef CAS.
- Y. Hu, T. Guo, X. Ye, Q. Li, M. Guo, H. Liu and Z. Wu, Chem. Eng. J., 2013, 228, 392–397 CrossRef CAS.
Footnote |
| † Electronic supplementary information (ESI) available. See DOI: https://doi.org/10.1039/d2ra06691b |
| This journal is © The Royal Society of Chemistry 2022 |

