DOI:
10.1039/D2RA06124D
(Paper)
RSC Adv., 2022,
12, 34652-34659
Visible-light-activated photocatalytic degradation of rhodamine B using WO3 nanoparticles
Received
28th September 2022
, Accepted 21st November 2022
First published on 2nd December 2022
Abstract
Semiconductor photocatalysis is touted to be one of the most efficient and cost-effective methods of degrading organic pollutants in various water matrices. Herein, highly agglomerated WO3 nanoparticles were synthesized via a facile acid precipitation method and tested on rhodamine B dye as the model pollutant. The physicochemical properties of the particles were investigated using various characterization techniques which include X-ray diffraction (XRD), scanning electron microscopy (SEM), transmission electron microscopy (TEM), Brunauer–Emmett–Teller (BET) and zeta potential measurements. The effects of calcination temperature, initial pH, catalyst loading and initial pollutant concentration were investigated. The results showed that under optimum conditions of 300 °C calcination temperature, 5 g L−1 catalyst loading, 5 ppm initial pollutant concentration and a pH of 9.5, the catalyst achieved an excellent degradation efficiency of 96.1% after 4 h of visible light irradiation. The degradation tests revealed a strong dependence on initial pH with acidic pHs favouring adsorption and alkaline pHs favouring photocatalysis. The degradation kinetics followed the Langmuir–Hinshelwood model for catalyst loadings of less than 10 g L−1, which typically describes heterogenous photocatalytic surface reactions. Scavenging experiments revealed that reactive superoxide and hydroxyl free radicals were the primary drivers for rhodamine B dye degradation.
Introduction
Wastewater reuse and reclamation is becoming more critical due to diminishing fresh water sources. Seventy one percent of the Earth's surface is covered by water, however, less than 1% is potable.1 This is largely due to a combination of factors such as rapid increase in industrialization and population. The effluent released by various industrial processes contains both organic (synthetic dyes, pharmaceuticals, microbes, phenolic compounds, pesticides, petroleum, etc.) and inorganic (heavy metals, nitrates, nitrites, etc.) pollutants. Amongst these pollutants is rhodamine B dye which belongs to the xanthene class. Rhodamine B is difficult to biodegrade due to its high solubility and stable nature. The release of rhodamine B from industrial activities into wastewater even at concentrations as low as 1.0 mg L−1 renders the water unsuitable for human consumption and aquatic life.2 Rhodamine B is neurotoxic, carcinogenic, mutagenic and is an irritant to the respiratory tract, eyes, and skin. Dye contaminated wastewater is classified as refractory wastewater due to the fact that it increases biological oxygen demand and chemical oxygen demand in surface water. This alters the demand ratio above allowable discharge limits.3 Semiconductor photocatalysis is an interesting approach in the area of wastewater reclamation, offering the possibility to completely degrade organic pollutants without generating secondary pollution.4 The mechanism mimics photosynthesis and is characterized by the generation of transient in situ highly reactive oxidants and radicals (predominantly OH˙ and O2˙−) which results in the mineralization of wastewater pollutants upon UV or visible light irradiation with energy exceeding or equal to the energy gap.5 Upon irradiation, the electrons are excited to the conduction band and holes remain on the valence band. This generates electron–hole pairs (e−/h+) which migrate to the surface of the catalyst and are trapped in superficial sites where they react with adsorbed species. The void states that are created on the valence band of the catalyst react with electron-donating species, forming reactive hydroxyl radicals which are primarily responsible for the degradation of organic pollutants.6 One of the greatest inducements for visible-light-driven photocatalysis, in preference to UV-light-driven photocatalysis, is the fact that UV light only accounts for 5% of the solar spectrum while visible light constitutes 45%. This implies that using UV light requires high photon energy input for a higher production of reducing and oxidizing agents.7 Semiconductor photocatalysis is still limited to laboratory scale applications. Scalability of this technology is dependent on the intense understanding of the mechanism of photocatalysis, the concept of designing photocatalysts and increasing efficiency of visible light absorption. Tungsten(VI) oxide (WO3) has attracted considerable attention as a semiconductor photocatalyst for wastewater reclamation. WO3 holds distinguished advantages which include high absorption in the visible spectrum (up to 480 nm), a tunable bandgap ranging between 2.4 to 2.8 eV, excellent optical properties, non-toxic nature, low-cost and stability in both oxidative and acidic conditions.8 Another major advantage of WO3 is the position of its valence band edge in relation to the standard hydrogen electrode which increases its activity over a wider range of organic pollutants due to an extended hole diffusion length (∼150 nm) and considerable electron mobility (6.5 cm2 V−1 s−1). These factors prolong the carrier lifetime which is responsible for the generation of reactive oxygen species.9 This study evaluates the efficiency of synthesized WO3 as a promising visible light activated photocatalyst with rhodamine B dyes serving as the pollutant simulant.
Experimental
Chemicals and reagents
Rhodamine B ≥95 wt% HPLC grade powdered dye, sodium tungstate dihydrate (Na2WO4·2H2O) and p-benzoquinone were purchased from Sigma-Aldrich (Johannesburg, South Africa). Hydrochloric acid 30–33 wt% (HCl), sodium hydroxide pellets (NaOH), sulphuric acid (H2SO4) 98 wt% and hydrogen peroxide 30 wt% (H2O2) were purchased from Glassworld (Johannesburg, South Africa). 2-Propanol was purchased from Chemical Suppliers (Pty) Ltd (Johannesburg, South Africa). Moir's Bicarbonate of Soda was purchased from Checkers (Pretoria, South Africa). Ultrapure water from an Elga Purelab Chorus unit was used throughout this synthesis. All materials were of analytical grade and used without further purification.
Catalyst synthesis
The synthesis of WO3 particles followed a method described by Altanany et al.10 and illustrated in Scheme 1. Na2WO4·2H2O (3 g) was dissolved in 200 mL of ultrapure water under continuous stirring. The resulting sodium tungstate solution was precipitated with 10 mL HCl and kept under stirring for an additional 5 h at room temperature. The solution turned yellow upon addition of HCl. The precipitate was allowed to age at room temperature for 24 h. The precipitate was recovered through centrifugation and washed several times with ultrapure water and thereafter oven-dried at 100 °C for 1 h. After which, the product was calcined in a muffle furnace at 300 °C, 500 °C and 700 °C for 4 h. The synthesis followed a two-step process that required minimal energy as described by eqn (1) and (2).11| | |
Na2WO4·2H2O + 2HCl + H2O → H2WO4·3H2O + 2NaCl
| (1) |
| | |
H2WO4·3H2O → WO3 + 4H2O
| (2) |
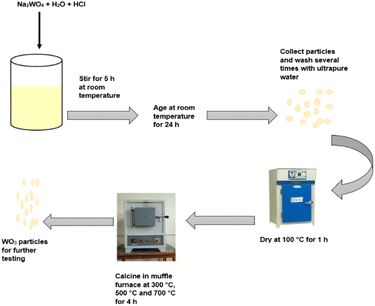 |
| | Scheme 1 Schematic illustration of the synthesis process of WO3. | |
Photocatalytic activity
Photodegradation tests were conducted by dispersing a predetermined amount of catalyst in a 100 mL rhodamine B solution of 5 ppm concentration. For the photocatalysis tests, the reaction mixture was stirred in the dark for 30 min prior to irradiation to reach adsorption–desorption equilibrium. Upon visible light irradiation, the solution/catalyst suspension was continuously stirred for 4 h. Two mL aliquots of sample were withdrawn from the reactor at 30 min intervals. Two control tests were also conducted, i.e., photolysis (without the catalyst) and adsorption (without the light). Both experiments followed the same procedure and were conducted under the same conditions. Optimization studies to determine the optimum degradation conditions were conducted while varying calcination temperature, pH, catalyst loading and initial concentration. The initial pH of the solution was adjusted using 0.1 M NaOH and 0.1 M H2SO4. The change in dye concentration was analyzed using a WPA, LIGHT Wave, Labotech UV-vis spectrophotometer (South Africa) at a characteristic wavelength of 555 nm using ultrapure water as a blank. The tests were conducted in triplicate for statistical purposes. The photodegradation percentage was determined using the expression shown in eqn (3):| |
 | (3) |
where C0 is the initial rhodamine B concentration and Ct is the concentration of rhodamine B at any given time, t. To understand the mechanism of the reaction, scavenger tests were performed. These were conducted by adding 5 mmol of p-benzoquinone (superoxide radicals scavenger), sodium bicarbonate (hydroxyl radicals scavenger), hydrogen peroxide (electron scavenger) and 2-propanol (positive hole scavenger). The reusability potential of the material was investigated for 4 cycles. After each run, the particles were collected via centrifugation and rinsed a few times with deionized water and thereafter dried at 100 °C for 2 h before beginning the next cycle.
Characterization
The X-ray diffraction (XRD) samples were prepared according to the standardized Panalytical backloading system, which provides a nearly random distribution of the particles. The samples were analyzed using a PANalytical X'Pert Pro powder diffractometer in θ–θ configuration with an X'Celerator detector and variable divergence- and fixed receiving slits with Fe filtered Co-Kα radiation (λ = 1.789 Å). The mineralogy was determined by selecting the best-fitting pattern from the ICSD database to the measured diffraction pattern, using X'Pert Highscore plus software. Scanning electron microscopy (SEM) images were obtained using a Zeiss 540 Ultra FEGSEM while the transmission electron microscopy (TEM) images were obtained using a Joel 2100 FEGTEM. The BET surface area and pore size of the particles was determined using Micromeritics Tristar II 3020 Version 3.02 in liquid nitrogen at 77.350 K. The particles were degassed at 110 °C overnight prior to the specific surface area analysis. The zeta potential was determined using a Malvern Zetasizer Nano series (ZEN 3600, UK). pH solutions of 3, 5.6 and 9.5 were prepared using sulphuric acid and sodium hydroxide for adjustment.
Results and discussion
Characterization
Fig. 1 shows the XRD spectra of the neat and the calcined particles. The neat particles were highly amorphous with a broad peak emerging at a 2 theta value of 31.5° indicating that the atoms had a short-range order in the crystal lattice. Furthermore, the amorphous structure indicates the presence of weak and wide peaks.12 The particles calcined at 300 °C assumed crystallinity implying that the applied heat provided sufficient energy for phase transformation. The crystallinity observed at 300 °C was however lower than that observed at calcination temperatures of 500 °C and 700 °C. A lower crystallinity often indicates the presence of structural defects which are usually favourable for photocatalysis due to the increased surface area.12 Diffraction peaks observed at 2 theta values of 12°, 24°, 26.5°, 32.5°, 36°, 42°, 62°, 65°, 68.5°, and 72° were indexed to monoclinic structure (JCPD = 24-0747, space group: P21/n) of WO3. Increasing the calcination temperature above 300 °C resulted in an increase in purity and crystallinity of the material and thus complete elimination of the amorphous phase.
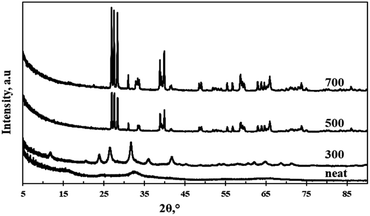 |
| | Fig. 1 XRD spectra of neat and calcined WO3 particles. | |
Fig. 2a–c shows the SEM images of the particles calcined at 300 °C, 500 °C and 700 °C. Singh et al.13 reported that temperature plays a vital role in controlling agglomeration and size of nanostructures. It can be observed from Fig. 2a–c that the particle size and agglomeration increased with an increase in calcination temperature. The particles were aggregated and irregular shaped throughout the entire calcination range. This observation was confirmed by the TEM images (Fig. 3a–c). The average size of the primary particles of the sample calcined at 300 °C as depicted by the TEM images (Fig. 3a) is in the range 20 nm < particle size < 50 nm. The particle size evidently increased as the calcination temperature increased (Fig. 3b). The particles calcined at 700 °C (Fig. 3c) have an average particle size of greater than 200 nm.
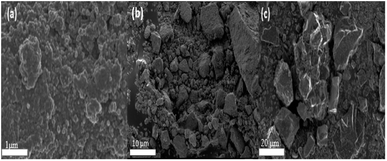 |
| | Fig. 2 (a) SEM images for WO3 particles calcined at 300 °C (b) 500 °C (c) 700 °C. | |
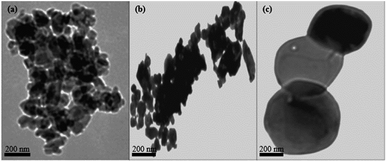 |
| | Fig. 3 (a) TEM images for WO3 particles calcined at 300 °C (b) 500 °C (c) 700 °C. | |
The average particle size shown in Table 1 was calculated using eqn (4) which assumes that all particles have the same spherical shape and size.14
| |
 | (4) |
where
D is the particle size,
SBET is the BET-specific surface area and
ρ is the true density (
ρ for WO
3 is 7.16 g cm
−3).
Table 1 Surface area and pore size measurement of WO3 particles by BET analysis
| WO3 materials |
Surface area (m2 g−1) |
BJH adsorption average pore width (4 V A−1) |
BJH desorption average pore width (4 V A−1) |
Average particle size (nm) |
| 300 °C |
25.4 |
66.5 Å |
114.8 Å |
32.9 |
| 500 °C |
2.9 |
53.3 Å |
55.5 Å |
284.2 |
| 700 °C |
0.4 |
74.4 Å |
76.2 Å |
2365.9 |
The average theoretical size of the particles increased with increasing calcination temperature. These results agree with the trend observed from the TEM images of the various particles. The BET surface area of the particles also decreased with an increase in calcination temperature, with 25.4 m2 g−1 recorded for the WO3 calcined at 300 °C compared to 0.4 m2 g−1. This observation can be attributed to the fact that a high calcination temperature results in fusion of the particles which resulted in the formation of agglomerates as depicted by the SEM and TEM results. The increased surface area leads to an improved adsorption performance which results in improved photocatalytic activity.15 Furthermore, the high surface area provides more active sites and increased light absorption.12 The particles with the lowest surface area portrayed a higher BJH adsorption average pore width. For the particles calcined at 300 °C, there was a notable difference in BJH adsorption and desorption average pore width. This implies that there was a Langmuir type IV hysteresis loop in the mesopore region.16
Effect of calcination temperature
Calcination temperature is one of the key strategies of tuning the physicochemical properties of nanostructures.17 Fig. 4 shows the degradation profile of rhodamine B at 300 °C, 500 °C and 700 °C under preliminary conditions of pH 5.6 and a catalyst loading of 7.5 g L−1. WO3 calcined at 300 °C resulted in 78.4% dye removal, with 72.8% being attributed to adsorption. The influence of photolysis was negligible. WO3 particles calcined at 500 °C and 700 °C had no appreciable effect on the initial concentration of the dye, with 1.5% and 1.8% dye removal being recorded. It is clear that adsorption was the dominant removal mechanism under the given reaction conditions.
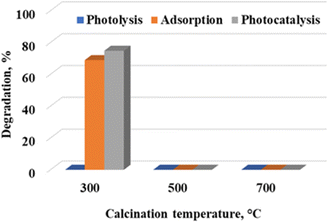 |
| | Fig. 4 Effect of calcination temperature on the photocatalytic degradation of rhodamine B at a catalyst loading of 7.5 g L−1, ambient pH of 5.64 and 5 ppm rhodamine B concentration. | |
Amorphous materials are generally regarded as better adsorbents compared to materials that are more crystalline. This accretion holds true in the present study since the material calcined at 300 °C was less crystalline compared to the material treated at higher temperatures (Fig. 1). Several researchers have reported that photocatalytic activity increases with an increase in crystallinity. One of these researchers is Bellardita et al.18 who attributed this observation to the reduced number of defects on highly crystalline materials as opposed to amorphous materials which lowered the probability of entrapment of the electron–hole pairs thus improving the degradation efficiency. Yu et al.19 reported a similar observation and attributed it to a phase change that accompanied the temperature increment. However, Akurati et al.20 indicated that the relationship between crystallinity and photocatalytic activity is also dependent on other reaction parameters such as matrix pH, nature and concentration of the pollutant. It is therefore possible that some of these factors play a major role in the present study, and this might explain why photocatalysis did not play a role under the initial test conditions.
Effect of pH
The WO3 nanoparticles calcined at 300 °C were further analyzed to investigate the effect of pH on the degradation efficiency of rhodamine B under acidic (pH 3) and basic (9.5) conditions. These pH values were obtained by adjusting the solution with an ambient pH (5.6) through the addition of requisite amounts of 0.1 M NaOH and 0.1 M H2SO4. Fig. 5 shows the degradation profile of rhodamine B with an initial concentration of 5 ppm at a catalyst loading of 7.5 g L−1. It is evident that the dye removal mechanism was highly pH dependent. Acidic pH conditions strongly favoured adsorption. The ambient pH (5.6) and pH 3 were in the acidic zone, and it was evident that adsorption was the dominant mechanism. Percentage differences of 13.3% and 5.2% were recorded for rhodamine B removal under adsorption and photocatalytic conditions at pH 3 and 5.6, respectively. These were lower than the 43.6% difference observed at pH 9.5. Solution pH has also been shown to influence the net surface charge on photocatalytic materials.21
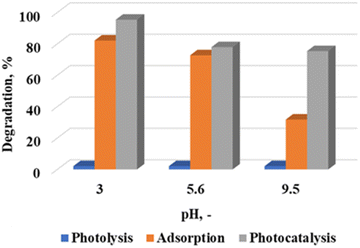 |
| | Fig. 5 Effect of pH on the photocatalytic degradation of rhodamine B at a calcination temperature of 300 °C, catalyst loading of 7.5 g L−1 and 5 ppm rhodamine B concentration. | |
In the present study, the net surface charge at the various pH values was determined by measuring the zeta potential. Values of −43.8, −32.7 and −40.5 mV were obtained at the different pH values. Theoretically, this implies that there will be strong electrostatic attraction between the material surface and the cationic rhodamine B dye. The fairly high adsorption values shown in Fig. 5 supports this assertion. While it would follow that adsorption would play a major role at pH 9.5, it has been reported that alkaline conditions aid in the generation of hydroxyl radicals,22 which were necessary for the reaction to proceed. It is therefore postulated lead to the change in the dominant dye removal mechanism under these conditions. Complimentary scavenger tests reported later in the manuscript detail the rate determining free radical species which influences dye removal.
Effect of catalyst loading
Photocatalyst loading is one of the most important factors affecting the degradation efficiency. Fig. 6 depicts the degradation profile of rhodamine B at varying catalyst loadings (0.5 g L−1 to 10 g L−1) at an initial dye concentration of 5 ppm and pH of 9.5 using the WO3 particles calcined at 300 °C. Photodegradation efficiency of rhodamine B increased as the catalyst loading increased. Maximum degradation (96.1%) occurred at a dosage of 5 g L−1, after which the photocatalytic activity decreased significantly with 10.2% recorded after doubling the dosage to 10 g L−1. This result can be accounted for by considering the effect of turbidity at heightened loadings which led to shielding of light thereby hindering light penetration consequently decreasing the number of photons absorbed and thus lowering the degradation efficiency.23 Yunus et al.24 suggested that another probable reason for the reduced activity at high dosages was due to formation of agglomerates which led to the undesirable reduction in surface area and thus reduced degradation efficiency.
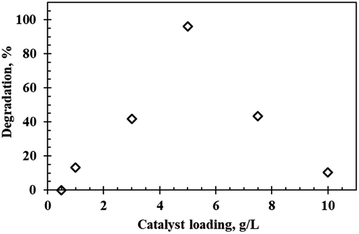 |
| | Fig. 6 Effect of catalyst loading on the photocatalytic degradation of rhodamine B at a calcination temperature of 300 °C, pH 9.5 and 5 ppm rhodamine B concentration. | |
The intrinsic kinetics of the reaction at different catalyst loadings were investigated using the Langmuir–Hinshelwood kinetics model shown in eqn (5).25
| |
 | (5) |
where
Kapp (min
−1) is the pseudo-first-order rate constant.
The rate constants (Table 2) showed a similar trend as the degradation percentage results presented in Fig. 6.
Table 2 Pseudo-first-order kinetics parameters for rhodamine B degradation under visible light using WO3 particles
| Catalyst loading (g L−1) |
Kapp (min−1) |
Linear regression (R2) |
| 0 |
−0.0005 |
0.8783 |
| 0.5 |
−0.0009 |
0.8739 |
| 1 |
0.0005 |
0.9156 |
| 3 |
0.003 |
0.8799 |
| 5 |
0.0111 |
0.9571 |
| 7.5 |
0.0045 |
0.9145 |
| 10 |
0.0047 |
0.6605 |
A gradual increase in Kapp was observed as the loading increased. The rate constant increased from 0.0005 min−1 at 1 g L−1 loading to 0.011 min−1 for 5 g L−1. The postulated combined effect of shielding and particle agglomeration resulted in a sharp decrease to 0.0047 min−1 when the amount of catalyst was doubled to 10 g L−1. It is also worth noting that the data at this loading did not fit the model well, with an R2 value of 0.66 being obtained.
Effect of initial rhodamine B concentration
Fig. 7 shows the degradation profile and the influence of concentration on the reaction kinetics of rhodamine B degradation at varying initial concentrations (5 ppm to 20 ppm) under optimum conditions of pH 9.5 and 5 g L−1 catalyst loading using the WO3 particles calcined at 300 °C. Degradation efficiency decreased with increasing initial concentration. This was somewhat expected since the number of dye molecules in solution increase and saturate the active sites on the catalyst surface. Additionally, increased rhodamine B concentrations result in darkening of the red colour, as a result, some of the light ends up getting adsorbed by the solution before it can initiate electron hole separation in the catalyst. This then leads to a reduction in the concentration of the hydroxyl radicals generated, and ultimately low degradation values are recorded. Wen et al.26 theorized that another probable explanation for the results obtained is the generation of intermediate products at higher concentrations which compete with the pollutant for limited reactive sites on the surface of the catalyst which leads to reduced interaction between the catalyst and the contaminant thus reducing degradation efficiency. The highest degradation and the fastest rate were attained when the initial concentration was 5 ppm. The rate constants also decreased as concentration increased, 0.011 min−1 was recorded for the 5 ppm solution compared to 0.0005 min−1 for the 20 ppm solution.
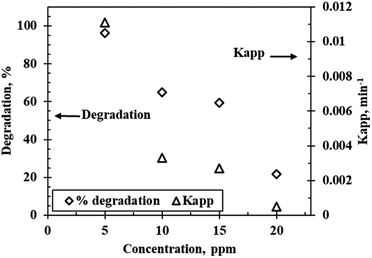 |
| | Fig. 7 Reaction kinetics and effect of initial concentration on the photocatalytic degradation of rhodamine B at a calcination temperature of 300 °C, a catalyst loading of 5 g L−1 and pH 9.5. | |
Optimum conditions
Fig. 8 shows the results of the photocatalytic degradation of rhodamine B under optimum conditions of 300 °C calcination temperature, pH of 9.5, catalyst loading of 5 g L−1 and initial rhodamine B concentration of 5 ppm after 4 h of visible light irradiation. A degradation efficiency of 96.1% was achieved with no sizable contribution from adsorption (without light) and photolysis (without catalyst). This result proves that the catalyst and the light were necessary for the degradation process. Adhikari et al.27 performed a similar experiment using WO3 nanoparticles with a specific surface area of 9.9 m2 g−1 using rhodamine B as a model pollutant. A degradation efficiency of 99% within 5 h of visible light irradiation was reported. This result was similar to the result of the present study. Adhikari et al.27 also performed a similar experiment, however, using WO3 nanorods (as opposed to nanoparticles) with a specific surface area of 6.6 m2 g−1 and reported a degradation efficiency of 95% of rhodamine B within 3 h of visible light irradiation. From these studies, it is evident that particle morphology plays a significant role in the photocatalytic process. Kolhar et al.28 stipulated that the enhanced activity of the nanorods is due to high aspect ratio. Interestingly, the surface area of the catalyst in this study was notably higher (25.4 m2 g−1) than that of the referenced studies. It was therefore expected that the present study would exhibit higher degradation efficiencies. The discrepancy between the expected result and reported results can be attributed to possible agglomeration of the primary nanoparticles which reduced the effective surface area of the material, whereas the elongated interconnections of the nanorod-type catalysts provides channels which enhanced adsorption.27
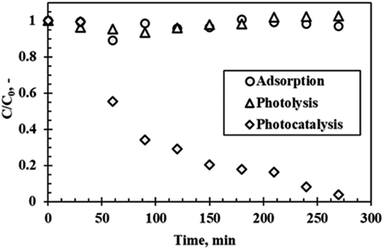 |
| | Fig. 8 Rhodamine B degradation as a function of time under visible light irradiation at optimum conditions. | |
Proposed mechanism
To gain a better understanding of the degradation mechanism and to be able to optimize the process further, a range of scavenger compounds capable of trapping and consuming reactive species in the system were studied.29 Hydroxyl radicals are widely believed to be the main contributors in the photodegradation process. However, researchers have reported on the contribution of other species which include superoxide ion radicals, singlet oxygen and the hole in the valence band of photocatalysts. Herein, 5 mmol of p-benzoquinone (BQ), sodium bicarbonate (SBC), 2-propanol (IPA) and hydrogen peroxide (HP) which serve as superoxide ion radicals and/or hydroperoxyl radicals (O2˙−/HO2˙),30 hydroxyl radicals (OH˙),31 positive hole (h+)32 and electron (e−) scavengers,33 respectively, were added to the reaction mixture under optimum conditions.
Fig. 9 shows the effect of the different scavengers on the photocatalytic degradation of rhodamine B. Rapid degradation was observed in the reaction where no scavenger was added. The addition of p-benzoquinone (O2˙−) and sodium bicarbonate (OH˙) evidently inhibited the degradation process, with dye removal efficiencies of 1.6% and 0.4% being recorded. It can therefore be inferred that the formation of reactive superoxide and hydroxyl radical species was responsible for the organic decomposition of rhodamine B into CO2 and H2O using WO3 particles according to eqn (6)–(11). This observation confirms an earlier postulation on the effect of solution pH and the subsequent formation of hydroxyl free radicals as the dominant reactive species. Surprisingly, addition of electron (e−) and hole (h+) scavengers did not significantly retard the degradation process. Ordinarily, both species are required as precursors to the formation of the superoxide and hydroxyl radical as illustrated in eqn (6)–(11) with the overall process presented in Fig. 10. The reason for this observation is not well understood at the moment. However, Mureithi et al.34 who studied the impact of hole scavengers on photocatalytic reduction of nitrobenzene using cadmium sulfide quantum dots postulated that the reported percentage of hole scavenging may relate to the reducing ability and the affinity of the hole scavengers to the catalyst surface, but it does not directly determine the pollutant reduction rates or pathways. This is speculatively the case with electron scavengers as well.
| | |
WO3 + hv → WO3 (h+(vb)…e−(cb))
| (6) |
| | |
WO3 (e−(cb)) + O2 → WO3 + O2˙−
| (7) |
| | |
WO3 (e−(cb)) + HO2˙ + H+ → H2O2
| (9) |
| | |
H2O2 + WO3 (e−(cb)) → OH˙ + OH−
| (10) |
| | |
Rhodamine B + O2˙−/OH˙ → degradation products
| (11) |
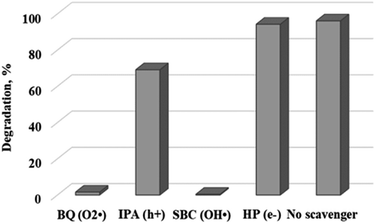 |
| | Fig. 9 Effect of different scavengers on the photocatalytic degradation of rhodamine B. | |
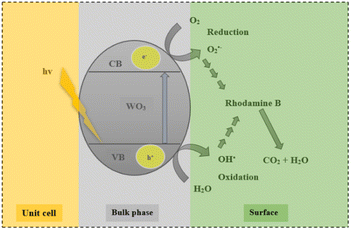 |
| | Fig. 10 Proposed mechanism of WO3 in the photocatalytic degradation of rhodamine. | |
Catalyst reuse, recyclability, and phase stability
Photocatalyst reuse and recyclability is an important factor to consider from an economic, environmental, and practical application point of view. The photocatalytic stability of the WO3 particles used in this study is reported in Fig. 11. The results revealed that the photocatalytic performance remained fairly stable for 3 cycles. Thereafter, the photocatalytic degradation efficiency reduced dramatically by 41.5% compared to the first cycle. This observation was attributed to the change in crystal structure as shown in Fig. 12. The decline in photocatalytic activity can also be attributed to the presence of absorbed intermediates on the surface of the catalyst or the possible leaching of the particles into the reaction solution making it difficult for the catalyst to maintain the desired initial performance.35
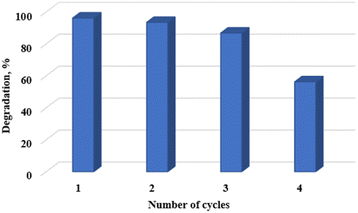 |
| | Fig. 11 WO3 photocatalyst stability and recyclability for 4 cycles. | |
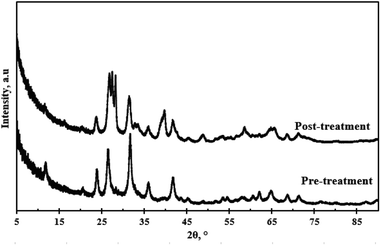 |
| | Fig. 12 XRD patterns of WO3 pre-treatment and post-treatment. | |
Fig. 12 depicts the XRD pattern of the WO3 particles pre-treatment and the XRD pattern after four cycles. There was no evidence of peak shift post-treatment. The relative intensities of the prominent peaks after four cycles were lower compared to the pre-treatment sample. The peak at 2θ = 26.5° split into three peaks of approximately equal intensity, and the peak at 2θ = 32.5° followed a similar trend, however, the intensities were significantly lower. The peak splitting was attributed to the distortion of the monoclinic symmetry. A broad peak emerged at 2θ = 39° after the fourth cycle. This signalled a slight change in the catalyst structure possibly due to the presence of impurities that might have bonded on to the WO3 particles during the recycling process or leaching of the particles into solution.
Conclusions
WO3 nanoparticles were successfully synthesized via a facile acid precipitation method. The material properties were characterized using a range of analysis techniques. Dye removal experiments revealed that the solution pH played a critical role in determining the dominant removal mechanism. Adsorption was favoured under acid conditions while photocatalysis was dominant at alkaline pH values. Optimum conditions of 300 °C calcination temperature, 5 g L−1 catalyst loading, initial pH of 9.5 and initial concentration of 5 ppm, the catalyst achieved a 96.1% degradation efficiency under visible light irradiation. Scavenger experiments showed that both superoxide and hydroxyl free radicals were responsible for dye removal. Their addition resulted in negligible dye removal. Based on the results, it can be concluded that visible-light-activated photocatalysis using WO3 particles is a viable technique for the degradation of organic pollutants such as rhodamine B in wastewater.
Author contributions
Nompumelelo Mzimela: conceptualization, investigation, methodology, project administration, validation, visualization, writing-original draft. Shepherd Tichapondwa: conceptualization, methodology, resources, supervision, writing-review & editing. Evans Chirwa: conceptualization, resources, supervision, writing-review & editing.
Conflicts of interest
There are no conflicts to declare.
Notes and references
- P. Jangid and M. P. Inbaraj, Mater. Today: Proc., 2021, 43, 2877–2881 CAS
 .
. - K. A. Adegoke, O. R. Adegoke, A. O. Araoye, J. Ogunmodede, O. S. Agboola and O. S. Bello, Bioresour. Technol. Rep., 2022, 18, 101082 CrossRef CAS
 .
. - T. O. Ajiboye, O. A. Oyewo and D. C. Onwudiwe, FlatChem, 2021, 29, 100277 CrossRef CAS
 .
. - A. V. P. Rao, A. M. Umabala and P. Suresh, International Peer Reviewed Journal, 2015, 4, 1145–1172 CAS
 .
. - M. Bodzek and M. Rajca, Ecol. Chem. Eng. S, 2012, 19, 489–512 CAS
 .
. - Z. Long, Q. Li, T. Wei, G. Zhang and Z. Ren, J. Hazard. Mater., 2020, 395, 122599 CrossRef CAS PubMed
 .
. - R. Molinari, C. Lavorato and P. Argurio, Catalysts, 2020, 10, 1–38 Search PubMed
 .
. - V. Dutta, et al., J. Environ. Chem. Eng., 2021, 9, 105018 CrossRef CAS
 .
. - S. G. Kumar and K. S. R. K. Rao, Appl. Surf. Sci., 2015, 355, 939–958 CrossRef
 .
. - S. M. Altanany, M. A. Gondal and U. Baig, AIP Conf. Proc., 2018, 1976, 5042381 CrossRef
 .
. - A. K. H. Bashir, et al., J. Nanopart. Res., 2021, 23, 1–11 CrossRef
 .
. - W. Shi, et al., J. Hazard. Mater., 2022, 436, 129141 CrossRef CAS PubMed
 .
. - R. C. Singh, M. P. Singh, O. Singh and P. S. Chandi, Sens. Actuators, B, 2009, 143, 226–232 CrossRef
 .
. - K. Joseph, A. Raj and B. Viswanathan, Indian J. Chem., Sect. A: Inorg., Phys., Theor. Anal., 2009, 48, 1378–1382 Search PubMed
 .
. - F. Guo, C. Shi, W. Sun, Y. Liu, X. Lin and W. Shi, Chin. J. Chem. Eng., 2022, 48, 1–11 CrossRef
 .
. - Y. Shu, S. Yan, K. Dong and J. Chen, Open J. Appl. Sci., 2018, 8, 532–544 CrossRef CAS
 .
. - S. mei FU, et al., Trans. Nonferrous Met. Soc. China, 2020, 30, 765–773 CrossRef
 .
. - M. Bellardita, A. di Paola, B. Megna and L. Palmisano, Appl. Catal., B, 2017, 201, 150–158 CrossRef CAS
 .
. - J. G. Yu, H. G. Yu, B. Cheng, X. J. Zhao, J. C. Yu and W. K. Ho, J. Phys. Chem. B, 2003, 107, 13871–13879 CrossRef CAS
 .
. - K. K. Akurati, A. Vital, G. Fortunato, R. Hany, F. Nueesch and T. Graule, Solid State Sci., 2007, 9, 247–257 CrossRef CAS
 .
. - S. M. Tichapondwa, J. P. Newman and O. Kubheka, Phys. Chem. Earth, Parts A/B/C, 2020, 118, 102900 CrossRef
 .
. - A. A. Al-Kahtani, J. Biomater. Nanobiotechnol., 2017, 8, 66–82 CrossRef CAS
 .
. - A. Gnanaprakasam, V. M. Sivakumar and M. Thirumarimurugan, Indian Journal of Materials Science, 2015, 2015, 1–16 CrossRef
 .
. - N. N. Yunus, F. Hamzah, M. S. So'Aib and J. Krishnan, IOP Conf. Ser.: Mater. Sci. Eng., 2017, 206, 012092 Search PubMed
 .
. - A. Iqbal, et al., Surfaces, 2020, 3, 301–318 CrossRef CAS
 .
. - X. J. Wen, C. G. Niu, L. Zhang and G. M. Zeng, ACS Sustainable Chem. Eng., 2017, 5, 5134–5147 CrossRef CAS
 .
. - S. Adhikari, K. Sarath Chandra, D. H. Kim, G. Madras and D. Sarkar, Adv. Powder Technol., 2018, 29, 1591–1600 CrossRef CAS
 .
. - P. Kolhar, et al., Proc. Natl. Acad. Sci. U. S. A., 2013, 110, 10753–10758 CrossRef CAS PubMed
 .
. - A. Cavicchioli and I. G. R. Gutz, J. Braz. Chem. Soc., 2002, 13, 441–448 CrossRef CAS
 .
. - J. T. Schneider, D. S. Firak, R. R. Ribeiro and P. Peralta-Zamora, Phys. Chem. Chem. Phys., 2020, 22, 15723–15733 RSC
 .
. - M. Mehrvar, W. A. Anderson and M. Moo-Young, Int. J. Photoenergy, 2001, 3, 187–191 CrossRef CAS
 .
. - S. Kaneco, Y. Shimizu, K. Ohta and T. Mizuno, J. Photochem. Photobiol., A, 1998, 115, 223–226 CrossRef CAS
 .
. - B. Abramovic, V. Despotovic, D. Šojic and N. Fincur, React. Kinet., Mech. Catal., 2015, 115, 67–79 CrossRef CAS
 .
. - A. W. Mureithi, Y. Sun, T. Mani, A. R. Howell and J. Zhao, Cell Rep. Phys. Sci., 2022, 3, 100889 CrossRef CAS
 .
. - C. H. Nguyen, C. C. Fu and R. S. Juang, J. Cleaner Prod., 2018, 202, 413–427 CrossRef CAS
 .
.
|
| This journal is © The Royal Society of Chemistry 2022 |
Click here to see how this site uses Cookies. View our privacy policy here.  Open Access Article
 *,
Shepherd Tichapondwa and
Evans Chirwa


.
.
.
.
.
.
.
.
.
.
.
.
.
.
.
.
.
.
.
.
.
.
.
.
.
.
.
.
.
.
.
.
.
.
.


