 Open Access Article
Improving natural products identification through molecular features-oriented precursor ion selection and targeted MS/MS analysis: a case study of Zhi-Ke-Yang-Yin capsule†
Hongping Wang a,
Qiong Yina,
ZiJian Wanga,
Ping Penga,
Chunlan Fanc,
Run Zhangb,
Chen Zhaoa and
Zhaozhou Linc
aScientific Research Institute of Beijing Tongrentang Co., Ltd., Beijing 100011, China. E-mail: sungirl9626@163.com; Fax: +86 10 87632655; Tel: +86 10 87632655
bBeijing Tongrentang Technology Development Co., Ltd., Beijing 100079, China
cBeijing Zhongyan Tongrentang Pharmaceutical R & D Co., Ltd., Beijing 100000, China
First published on 22nd November 2022
Abstract
Chemical substance identification is an indispensable step in research on therapeutic materials based on traditional Chinese medicine and its formulas. The successful characterization of chemical substances mainly relies on high-quality MS/MS spectra. However, to date, relatively few studies have specifically addressed the issues of improving the acquisition of MS/MS spectra of compounds for characterization. The current auto-MS/MS mode, where the precursor ions are selected depending on their signal intensity, encounters a drawback when the sample contains many overlapping signals, leading to compounds with a lower or much lower abundance missing identification. To solve this problem, a strategy in which molecular features oriented precursor ion selection was followed by targeted MS/MS analysis for structure elucidation was proposed. The precursor ions were selected according to their first and second molecular features, namely m/z and retention time, irrespective of their intensities. By performing targeted MS/MS analysis, the MS/MS spectra of many more compounds of interest can be obtained, leading to an improvement in natural product identification. As an example, the chemical substances in the Zhi-Ke-Yang-Yin extract were analyzed using this strategy, and as a result, 431 ingredients were tentatively characterized, including both known and unknown or new compounds.
1. Introduction
The traditional Chinese medicine (TCM) formula (TCMF), which is typically composed of several herbal medicines, contains hundreds or even thousands of chemical substances. Studying these chemical substances plays an extremely important role in clarifying the therapeutic basis of TCMF. Many researchers have attempted to clarify the chemical substances in TCMF using LC-MS, and a series of results have been reported;1–7 however, no new analytical approaches have been proposed in these reports, and only a small part of the constituents has been identified. To clarify the holistic chemical substances in TCMF, some approaches, such as diagnostic ion-guided network bridging,8 diagnostic fragment-ion-based extension strategy,9 mass defect filtering,10 characteristic components dataset (CCDS),11 and utilizing the UNIFI informatics platform for computer-assisted UPLC/QTOF MS data analyses12 have been developed. Using these strategies, the number of compounds identified from TCMF has increased, and up to 190 ingredients were identified from the Niuhuang Shangqing pill.11 However, this is not sufficient because hundreds of compounds are usually present in TCMF. The successful identification of the constituents mentioned above critically relied on high-quality MS/MS spectra, and some compounds were not characterized mainly because of the lack of their MS/MS spectra. However, relatively few studies have specifically addressed the issues of improving the acquisition and characterization of MS/MS spectra. The current auto-MS/MS mode is a type of data-dependent acquisition, where precursor ions are usually selected according to signal intensity, which implies that the MS/MS spectra of ingredients with lower or much lower abundance will not be obtained when samples contain many overlapping signals. Therefore, this study aimed to improve the acquisition of MS/MS spectra for many more compounds and characterize them during TCMF UPLC-MS analysis.Each compound has the features of mass to charge ratio (m/z), retention time, and intensity in a full scan. The m/z value, which is the most valuable information in a full scan, namely, the first molecular feature, was used to determine the molecular weight and deduce the molecular formula of a compound when detected by high-resolution mass spectrometry. Usually, the first molecular features of compounds in the same chemical cluster have a general range, in which those of known and unknown compounds are included. Except for the first molecular feature, retention time, namely the second molecular feature, is another important piece of information in a full scan, which is used to determine when to perform MS/MS analysis. Intensity, namely the third molecular feature, which is above a set threshold, cannot be considered sampling noise, but related to a compound. Compared to the third molecular feature, the first and second molecular features are much more important and are crucial for constructing the precursor ion list. Once they are obtained, targeted MS/MS can be performed for structure elucidation.
Therefore, in our study, a strategy involving molecular feature-oriented precursor ion selection and targeted MS/MS analysis for structure elucidation was proposed. For example, the ingredients of the Zhi-Ke-Yang-Yin (ZKYY) capsule, which is composed of 7 TCMs: Renshen, Huangqi, Shengdihuang, Shanzhuyu, Shanyao, Tianhuafen, and Zhuyizang, were analyzed using the proposed method, and 431 compounds were successfully identified.
2. Methodology
2.1 Reagents, reference standards, and materials
LC-MS-grade formic acid was purchased from Fisher Scientific (Fair Lawn, USA), and LC-MS-grade acetonitrile and methanol were obtained from Merck (Germany). Distilled water was obtained from Watson.A total of 49 reference standards (see Fig. S1†) including ginsenoside Re3 (R2), ginsenoside Re4 (R3), 20-gluco-ginsenoside Rf (R5), ginsenoside Re1 (R7), notoginsenoside R1 (R9), ginsenoside Re2 (R10), ginsenoside Rg1 (R16), ginsenoside Re (R17), ginsenoside Rf (R42), notoginsenoside R2 (R47), ginsenoside Ra2 (R55), ginsenoside Ra3 (R58), ginsenoside Rb1 (R59), 20(S)-ginsenoside Rg2 (R60), 20(S)-ginsenoside Rh1 (R61), 20(R)-ginsenoside Rg2 (R68), ginsenoside Rc (R70), 20(R)-ginsenoside Rh1 (R71), ginsenoside Ra1 (R72), ginsenoside Ro (R74), ginsenoside Rb2 (R81), ginsenoside Rb3 (R82), quinquenoside R1 (R86), ginsenoside Rs2 (R91), ginsenoside Rd (R92), ginsenoside Ro methyl ester (R113), ginsenoside F4 (R129), ginsenoside Rg6 (R133), 20(S)-ginsenoside Rg3 (R139), 20(R)-ginsenoside Rg3 (R141), 20(S)-ginsenoside Rh2 (R147), 20(R)-ginsenoside Rh2 (R148), astragaloside IV (H13), astragaloside II (H18), loganic acid (S8), morroniside (S16), cornine (S24), sweroside (S27), cornuside I (S42), naringenin (S87), catalpol (D1), geniposidic acid (D11), 8-epiloganic acid (D16), genipin 1-gentiobioside (D18), geniposide (D20), rhamnocitrin (H62), quercetin (H63), oleanolic acid (H93), and ursolic acid (H94) were either purchased from Shanghai Yuanye Bio-Technology Co., Ltd. (Shanghai, China), as well as the National Institute for the Control of Pharmaceutical and Biological Products (Beijing, China), or gifts from the State Key Laboratory of Natural and Biomimetic Drugs, Department of Natural Medicines, School of Pharmaceutical Sciences, Peking University. The purity of all the reference standards was >98%. ZKYY capsule powder was supplied by the Scientific Research Institute of Beijing Tongrentang Co., Ltd.
2.2 Standard solution and sample preparation
The 49 reference standards were used only to confirm the accuracy of characterization, rather than quantification. Each reference standard (1.0 mg) was separately dissolved in 1 mL of 70% methanol to obtain its stock solution (1.0 mg mL−1). Ten to twenty microliters of each stock solution were mixed to obtain a mixture stock solution. The samples were then stored at 4 °C until analysis. ZKYY capsule powder (1.0 g) was ultrasonically extracted for 30 min with 20 mL of 70% methanol at 25 °C. The extracted solution was then filtered through a filter paper. This extraction was repeated twice. The filtrate was combined and evaporated to dryness using a rotary evaporator at 40 °C. The residue (0.3 g) was then dissolved in 5 mL of 70% methanol and filtered through a 0.22 μm nylon filter membrane before analysis.2.3 Chromatographic and mass spectrometric conditions
A Vanquish™ Flex UHPLC system (Thermo Scientific, USA) equipped with a binary pump and a thermostated column compartment was used to separate the multiple components. The optimized chromatographic conditions were detailed as follows: A Waters ACQUITY UPLC® BEH C18 column (2.1 × 100 mm, 1.7 μm) coupled with a ACQUITY UPLC® BEH C18 VanGuard™ Pre-Column (2.1 × 5 mm, 1.7 μm) was employed to perform the chromatographic separation of ZKYY extract using mobile phase A (0.1% formic acid/water, v/v) and mobile phase B (acetonitrile) by the following gradient elution program: 0–7 min, 2–20% B; 7–10 min, 20–25% B; 10–20 min, 25–40% B; 20–25 min, 40–65% B; 25–30 min, 65–95% B; 30–31 min, 95–95% B. The flow rate was 0.3 mL min−1, and the temperature was set at 35 °C. The injection volume was 2 μL.High-accuracy mass spectrometry data were recorded on an Orbitrap Exploris 240 mass spectrometer (Thermo Scientific, USA) equipped with a Heated ESI source. The instrument was operated in the negative-ion mode. The optimized MS parameters were as follows: ion spray voltage: 2500 V, sheath gas: 5.08 L min−1, auxiliary gas: 9.37 L min−1, ion transfer tube temperature: 320 °C, vaporizer temperature: 350 °C, scan range (m/z):150–2000, and collision-energy voltage: 35 V. The full scan was operated at a mass resolution of 60![[thin space (1/6-em)]](https://www.rsc.org/images/entities/char_2009.gif) 000 whereas the MS2 scan was operated at a mass resolution of 15
000 whereas the MS2 scan was operated at a mass resolution of 15![[thin space (1/6-em)]](https://www.rsc.org/images/entities/char_2009.gif) 000. An internal calibration source, Thermo Scientific EASY-ICTM, was adopted to calibrate the entire mass range.
000. An internal calibration source, Thermo Scientific EASY-ICTM, was adopted to calibrate the entire mass range.
2.4 Data acquisition and data mining
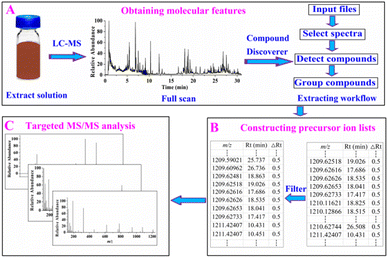
Thermo Xcalibur software (version 4.5) was used for data acquisition, whereas Free Style™ 1.8 SP1 and Compound Discoverer™ softwares (Thermo Scientific™, version 3.2.0.421) were used for data processing and mining. The negative-ion mode was adopted for data acquisition because the compounds in the ZKYY extract exhibited high ion responses in this mode. The ZKYY extract was first analyzed in full scan mode to minimize signal loss, then targeted MS/MS analysis was performed after constructing the precursor ion lists. The proposed data mining strategy for molecular feature-oriented precursor ion selection and targeted MS/MS analysis for structure elucidation mainly involved three steps (as shown in Fig. 1):![[thin space (1/6-em)]](https://www.rsc.org/images/entities/char_2009.gif) 000, extracted ions: [M − H]−, [M − H + HAc]−, [2M − H]−, [2M − H + HAc]−, minimum element composition: CHO, and maximum element composition: C90H190O90. The same substances detected in different addition methods were grouped by molecular weight (mass tolerance: 5 ppm) as well as retention time (RT tolerance: 0.1 min) across all files in the “group compounds” step. By running this workflow, all compounds with intensities above the set threshold were extracted and presented as m/z (the first molecular feature), retention time (the second molecular feature), and peak area. The first and second molecular features are essential for constructing a precursor ion list.
000, extracted ions: [M − H]−, [M − H + HAc]−, [2M − H]−, [2M − H + HAc]−, minimum element composition: CHO, and maximum element composition: C90H190O90. The same substances detected in different addition methods were grouped by molecular weight (mass tolerance: 5 ppm) as well as retention time (RT tolerance: 0.1 min) across all files in the “group compounds” step. By running this workflow, all compounds with intensities above the set threshold were extracted and presented as m/z (the first molecular feature), retention time (the second molecular feature), and peak area. The first and second molecular features are essential for constructing a precursor ion list.3. Results and discussion
3.1 Obtaining molecular features
In our experiment, the full scan data of the ZKYY extract were selected for processing, and the entire run time of the spectra as well as the negative-ion mode were selected for further processing. When detecting compounds, [M − H]−, [M − H + Hac]−, [2M − H]−, and [2M − H + HAc]− ions were selected as extracted ions and detected by a mass tolerance of 5 ppm as well as a threshold intensity of 100![[thin space (1/6-em)]](https://www.rsc.org/images/entities/char_2009.gif) 000. Compounds with different addition methods were consolidated by a mass tolerance of 5 ppm and retention time tolerance of 0.1 min. Running the extracted workflow produced 35
000. Compounds with different addition methods were consolidated by a mass tolerance of 5 ppm and retention time tolerance of 0.1 min. Running the extracted workflow produced 35![[thin space (1/6-em)]](https://www.rsc.org/images/entities/char_2009.gif) 131 ingredients presented by m/z, retention time, and peak area.
131 ingredients presented by m/z, retention time, and peak area.
3.2 Constructing precursor ion lists for compounds of interest
The constituents of TCMF mainly originate from a single herb. Theoretically, the components of ZKYY mainly include ginsenosides from Renshen,13 astragalus saponins from Huangqi,14 iridoids, ionones, phenylethanoid glycosides, phenylpropanoids, organic acids from Shengdihuang and Shanzhuyu,15,16 polyphenols from Shanyao,17 and triterpenoids from Tianhuafen.18 Flavonoids, which are widely present in nature, are also found in most of the herbal medicines mentioned above.14,16–18 The above chemical clusters have been reported to have some biological activities; therefore, we were more interested in them during the clarification of the chemical substances in ZKYY.Ideally, we can construct different precursor ion lists of different chemical clusters for convenient characterization. However, by searching the PubChem database and literature, we found that some different chemical clusters shared some common molecular features, not only in m/z ranges, but also in retention time ranges. We found that the molecular weights of ginsenosides, astragalus saponins, and triterpene glycosides were all greater than 600, whereas those of iridoids, ionones, flavonoids, phenylpropanoids, organic acids, polyphenols, and triterpenoids were all lower than 600. However, for phenylethanoid glycosides, the molecular weights were greater than 600 or lower than 600. Therefore, two types of precursor ion lists were constructed: compounds with molecular weights lower than 600 were selected in the first type of the precursor ion list to characterize iridoids, ionones, flavonoids, phenylpropanoids, organic acids, polyphenols, triterpenoids, and phenylethanoid glycosides, whereas the constituents with molecular weights greater than 600 were assigned to the second type of precursor ion list to include ginsenosides, astragalus saponins, triterpene glycosides, and phenylethanoid glycosides.
It was worth mentioning that the precursor ions of known and unknown compounds belonging to the same chemical cluster were all included in the constructed lists. If an individual compound belongs to the first list according to its chemical cluster but is assigned to the second list on the basis of its molecular weight, it will be characterized and vice versa.
In addition, from reported literature,13–18 we found the molecular formulas of our concerned compounds are composed of only three elements, namely C, H, and O. In theory, because no nitrogen atom was involved in the molecular formulas, the precursor ions of our compounds had odd nominal masses in the negative-ion mode. Therefore, ions with even normal masses were regarded as redundant data and eliminated to obtain a high-quality dataset.
3.3 Performing targeted MS/MS acquisition
After constructing the precursor ion lists, we performed targeted MS/MS analysis. The first and second types of precursor ion lists were separately subjected to MS/MS acquisition. Auto-MS/MS acquisition was performed under the same chromatographic and mass spectrometric conditions, except for the precursor selection. Note that the auto-MS/MS mode always selects the three most intensity m/z of a full scan, whereas our targeted mode was precursor ion-directed analysis.3.4 Evaluation of the efficacy of the proposed strategy
To evaluate the efficacy of the proposed strategy, the number of compounds characterized using this method and the auto-MS/MS mode were compared. We found that, in any chemical cluster, many more compounds were identified by the molecular features-oriented precursor ion selection mode (shown in Fig. 2), and auto-MS/MS-derived ingredients were only part of them. Furthermore, we believe that the inclusion of low-intensity precursor ions resulted in the difference in the number of identified compounds, which was further confirmed by Fig. 5C and D, as well as Fig. 6C and D.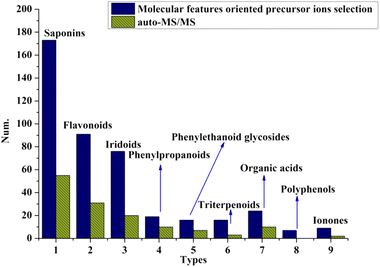 | ||
| Fig. 2 Numbers of compounds identified based on molecular features oriented precursor ions selection and auto-MS/MS mode. | ||
3.5 Identification of the components in ZKYY
After obtaining the MS/MS spectra, we identified the chemical substances in crude ZKYY extract. The constituents belonging to different chemical clusters could be easily differentiated because of their different fragmentation pathways as well as their different diagnostic ions, whereas the components belonging to the same chemical clusters usually have similar fragmentation patterns and the same diagnostic ions, and they could be successfully characterized either by comparison with the reference standards or the elution order information in the reversed-phase column described in literature and the polar size of the compounds. In addition, it is generally believed that a compound with high abundance in a full scan stands for a relatively high amount in herbal medicine, which is relatively easier to isolate than the compound with much lower abundance or amount, according to which the isolated known compounds and their isomers were tentatively identified. The total ion chromatograms of the reference standards and the ZKYY extract are shown in Fig. 3A and B, respectively. Based on the proposed strategy, a total of 431 compounds, including 173 saponins, 91 flavonoids, 76 iridoids, 19 phenylpropanoids, 16 phenylethanoid glycosides, 16 triterpenes and glycosides, 9 ionones, 24 organic acids, and 7 polyphenols, were characterized, and 49 of these compounds were confirmed by comparison with reference standards.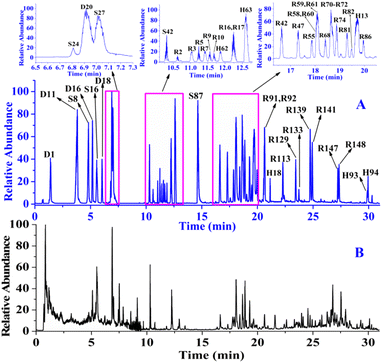 | ||
| Fig. 3 Total ion chromatograms of the 49 reference standards (A) and ZKYY extract (B) in negative-ion mode. | ||
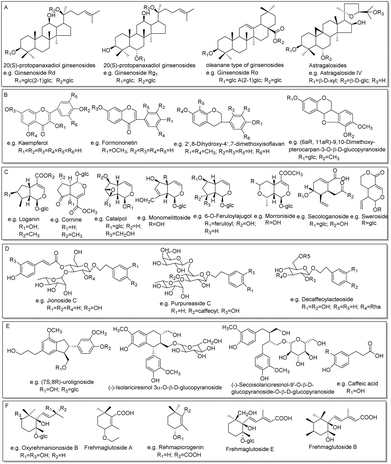 | ||
| Fig. 4 The main structure types of compounds identified in this work: sapoinins (A), flavonoids (B), iridoids (C), phenylethanoid glycosides (D), phenylpropanoids (E), and ionones (F). | ||
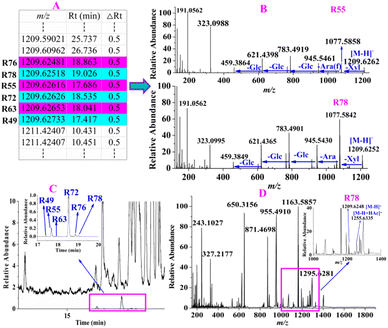
For instance, 6 constituents (R49, R55, R63, R72, R76 and R78) constructed in the list showed their precursor ions at m/z 1209.6248–1209.6273 (shown in Fig. 5A) with mass deviations of −1.65–0.41 ppm indicating that their molecular formula was C58H98O26. Targeted MS/MS analysis showed the same fragmentation ions at m/z 1077.5858, 945.5461, 783.4919, 621.4398, and 459.3864, yielded by successive losses of Xyl, Ara, Glc, Glc, and Glc from the [M − H]− ion (shown in Fig. 5B). R55 and R72 were unambiguously identified as ginsenosides Ra2 and Ra1, respectively, by comparison with the reference standards, and the remaining four compounds R49, R63, R76 and R78 were identified as their isomers. As shown in Fig. 5C, we found that the relative abundances of the extracted ion chromatograms were no more than 1.0% in the full scan, and the signals were covered by other relatively high-intensity components. In this case, we deduced that the intensities of these 6 components were lower or much lower than those of the others in the MS spectrum, as shown in Fig. 5D, using R78 as an example. As shown in Fig. 5D, the relative abundance of the precursor ion of R78 was approximately 10%, whereas those of many compounds were greater than 10%, leading to the precursor ion of R78 not being selected in the auto-MS/MS mode because of the much lower intensity, but it was selected in our experiment. R78 was determined based on its MS/MS spectrum. Five compounds (R6, R12, R14, R37, and R131), which were regarded as potential new compounds, were characterized. R6, R12 and R14, which were eluted at 11.31, 11.89, and 12.08 min, respectively, showed not only the same fragmentation pathway but also the same fragmentation ions at m/z 945.5485, 783.4889, 637.4330, and 475.3810, respectively, by successively losses of Glc, Glc, Glc and Rha from [M − H]− ion. The diagnostic ion at m/z 475.3810 indicated that the compound was a protopanaxatriol-type ginsenoside. However, no known compounds matched them well; thus, R6, R12, and R14 were tentatively identified as potential new compounds, protopanaxatriol + 3Glc + Rha. Similarly, R37 was identified as protopanaxadiol + 5Glc, whereas R131 was characterized as protopanaxadiol + Rha + 2Glc. In addition to the ginsenosides mentioned above, other known compounds and their isomerized, acetylated, and malonylated compounds were tentatively identified.
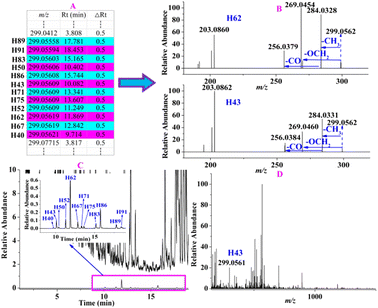
For instance, the precursor ions of 12 constituents (H40, H43, H50, H52, H62, H67, H71, H75, H83, H86, H89, and H91) were extracted at m/z 299.0556–99.0562 (shown in Fig. 6A) with a mass deviation of no more than 2.01 ppm, indicating that their molecular formula was C16H12O4. By performing target MS/MS analysis, they shared the same fragmentation ions at m/z 284.0328 and 269.0454, which were yielded by the loss of CH3 and OCH2 from the [M − H]− ion, respectively. In addition, m/z 256.0379 was produced by the elimination of CO from m/z 284.0328 (Fig. 6B). H62 was unambiguously identified as rhamnocitrin when compared with the reference standard. Therefore, the remaining 11 compounds were tentatively characterized as isomers. When extracting their ion chromatography in the full scan of ZKYY extract, we found that the 12 compounds were of much lower abundance and were overlapped by other high-intensity compounds (shown in Fig. 6C), leading to a much lower relative abundance than others in the MS spectra, taking H43 as an example (shown in Fig. 6D). Their precursor ions were not selected in the auto-MS/MS mode but were selected in our experiment. The precursor ions of H44, H54, H56, and H74 were extracted at m/z 461.1086–461.1090 with a mass deviation of 1.30 ppm, indicating that their molecular formula was C22H22O11. In their MS/MS spectrum, the ion observed at m/z 299.0558 indicates that the Glc unit was lost from the [M − H]− ion. In addition, the remaining fragmentation ions, produced from m/z 299.0558 and observed at m/z 284.0324, 269.0450, and 256.0392, were the same as those of rhamnocitrin. When extracting their ion chromatograms, the relative abundance of H74 was much higher than those of H44, H54, and H56. Therefore, H74 was tentatively identified as rhamnocitin-3-O-β-D-glucopyranoside, a known compound isolated from Huangqi,14 whereas H44, H54, and H56 were identified as its isomers. Similarly, other known compounds and their isomers were tentatively assigned.
For instance, the precursor ions of D1 and D3 were extracted at m/z 361.1136 and 361.1137, respectively, and their mass deviations were no more than 0.55 ppm, suggesting that their molecular formula was C15H22O10. The ions observed at m/z 199.0604 and 169.0508 indicate that Glc and CH2O were successively eliminated from the [M − H]− ion. D1 was deduced and confirmed to be catalpol, whereas D3 was characterized as monomelittoside. The precursor ions of D7 and D11 were extracted at m/z 373.1140 and 373.1138, respectively, within a mass deviation of 1.34 ppm indicating that their molecular formula was C16H22O10. The fragmentation ions at m/z 329.0871 and 167.0349 indicate that CO2 and Glc were successively eliminated from the [M − H]− ion. D11 was deduced and confirmed as geniposidic acid, whereas D7 was tentatively assigned as a known compound, gardoside.15 D14 and D16 shared not only the same precursor ions at m/z 375.1291, but also the same fragmentation ions at m/z 213.0776 and 169.0872, which were attributed to successive losses of Glc and CO2 from the [M − H]− ion. D16 was eluted and confirmed as 8-epiloganic acid, whereas D14 was deduced to be mussaenosidic acid, a known compound isolated from Shengdihuang.15 The extracted precursor ions of S1, S9, S27, and S37 were at m/z 357.1188–357.1189 within a mass deviation of 0.84 ppm, indicating that their molecular formula was C16H22O9. Targeted MS/MS analysis revealed fragmentation ions at m/z 195.0663 and 177.0559, suggesting that Glc and H2O were successively lost from their [M − H]− ions. S27 was characterized and confirmed as sweroside, and the remaining compounds, S1, S9, and S37 were tentatively assigned as isomers. Similarly, other known compounds and their isomers were tentatively characterized.
The fragmentation pathways of phenylpropanoids and ionones are mainly losses of a series of small molecules, such as CH3, CO, CO2, H2O, OCH2, OCH3, and Glc,23 which were used to deduce the phenylpropanoids and ionones in the ZKYY extract. For example, the precursor ions of S55, S59, and S60 were extracted at m/z 523.2184–523.2187, with mass deviations of no more than 1.53 ppm, indicating that their molecular formula was C26H36O11. In the MS/MS spectrum, they all produced the same fragmentation ions at m/z 361.1659, 346.1414, and 315.1249 by successive loss of Glc, CH3 and OCH3, respectively. Thus, S60 was tentatively assigned as (−)-secoisolariciresinol-9′-O-β-D-glucopyranoside, a known compound isolated from Shanzhuyu,16 whereas the other two compounds, S55 and S59, were characterized as isomers with much lower abundances than that of S60. Similarly, other 17 known phenylpropanoids and ionones, as well as 8 of their isomers, were tentatively characterized (shown in ESI Tables S5 and S6†). The main structural types of phenylpropanoids and ionones are shown in Fig. 4E and F, respectively.
In addition to the compounds mentioned above, 16 triterpenes and glycosides (shown in ESI Table S7†), 24 organic acids, and 7 polyphenols (shown in ESI Table S8†) were tentatively characterized. The LC-MS traces are shown in Fig. S7.†
4. Conclusions
To improve structure elucidation, a strategy in which molecular features-oriented precursor ion selection and targeted MS/MS analysis was proposed in our study. Using this strategy, a total of 431 ingredients, including known and unknown compounds, irrespective of their intensities were tentatively characterized. Our results showed that more compounds were identified by our strategy than those elucidated by the auto-MS/MS mode. The auto-MS/MS mode, where the precursor ions are selected depending on their signal intensity, plays a substantial role in the chemical characterization of TCM or TCMF. However, it encounters a drawback when many signals overlap and the intense signals do not represent the ingredients of interest. In contrast, our strategy overcomes this drawback and has two advantages relative to the auto-MS/MS mode. First, the precursor ions of the constituents were selected irrespective of their intensity so that the concerned compounds with not only high but also low abundance could be identified. However, in the auto-MS/MS mode, compounds of interest with lower or much lower abundance were not identified because they were covered or overlapped by some compounds with high abundance. The second advantage was to avoid interference from unwanted compounds. In auto-MS/MS mode, the three most intense ions are usually selected; however, when the ion intensities of unconcerned compounds meet the requirements (among the three most intense), unconcerned compounds will be selected for MS/MS analysis. To some extent, this leads to missing compounds being selected and unidentified. Nevertheless, in our strategy, the constructed precursor ion lists were composed of the ions of the concerned compounds, and when performing targeted MS/MS analysis, no interference was encountered from the unconcerned compounds, and we could obtain the fragmentation ions of more concerned compounds. Therefore, more compounds were identified through our strategy, and even more potential new compounds, such as isomers, acetylations, and malonylations of known compounds were characterized.Conflicts of interest
The authors have declared no conflict of interest.Acknowledgements
This research was supported by the Scientific Research Institute of Beijing Tongrentang Co. Ltd. We thank Professor Xiuwei Yang, State Key Laboratory of Natural and Biomimetic Drugs, Department of Natural Medicines, School of Pharmaceutical Sciences, Peking University, for supplying ginsenoside reference standards.References
- L. L. Chen, J. Qi, Y. X. Chang, D. N. Zhu and B. Y. Yu, J. Pharm. Biomed. Anal., 2009, 50, 127 CrossRef CAS.
- Y. Y. Wang, S. He, X. C. Cheng, Y. X. Lu, Y. P. Zou and Q. L. Zhang, J. Pharm. Biomed. Anal., 2013, 80, 24 CrossRef CAS PubMed.
- Z. H. Su, G. A. Zou, A. Preiss, H. W. Zhang and Z. M. Zou, J. Pharm. Biomed. Anal., 2010, 53, 454 CrossRef CAS PubMed.
- Y. Qi, S. Z. Li, Z. F. Pi, F. R. Song, N. Lin, S. Liu and Z. Q. Liu, Talanta, 2014, 118, 21 CrossRef CAS PubMed.
- M. H. Liu, X. Tong, J. X. Wang, W. Zou, H. Cao and W. W. Su, J. Pharm. Biomed. Anal., 2013, 74, 141 CrossRef CAS PubMed.
- Y. H. Wang, C. Qiu, D. W. Wang, Z. F. Hu, B. Y. Yu and D. N. Zhu, J. Pharm. Biomed. Anal., 2011, 54, 1110 CrossRef CAS.
- W. J. Miao, Q. Wang, T. Bo, M. Ye, X. Qiao, W. Z. Yang, C. Xiang, X. Y. Guan and D. A. Guo, J. Pharm. Biomed. Anal., 2013, 72, 99 CrossRef CAS.
- H. Hao, N. Cui, G. Wang, B. Xiang, Y. Liang, X. Xu, H. Zhang, J. Yang, C. Zheng, L. Wu, P. Gong and W. Wang, Anal. Chem., 2008, 80, 8187 CrossRef CAS.
- C. Zheng, H. Hao, X. Wang, X. Wu, G. Wang, G. Sang, Y. Liang, L. Xie, C. Xia and X. Yao, J. Mass Spectrom., 2009, 44, 230 CrossRef CAS.
- T. Xie, Y. Liang, H. Hao, A. Jiye, L. Xie, P. Gong, C. Dai, L. Liu, A. Kang, X. Zheng and G. Wang, J. Chromatogr. A, 2012, 1227, 234 CrossRef CAS.
- D. D. Wang, J. Liang, W. Z. Yang, J. J. Hou, M. Yang, J. Da, Y. Wang, B. H. Jiang, X. Liu, W. Y. Wu and D. A. Guo, J. Pharm. Biomed. Anal., 2014, 89, 130 CrossRef CAS.
- F. X. Zhang, M. Li, L. R. Qiao, Z. H. Yao, C. Li, X. Y. Shen, Y. Wang, K. Yu, X. S. Yao and Y. Dai, J. Pharm. Biomed. Anal., 2016, 122, 59 CrossRef CAS.
- X. B. Yang, X. W. Yang and J. X. Liu, Mod. Chin. Med., 2013, 15, 349 CAS.
- N. N. Hu and X. J. Zhang, Inf. Tradit. Chin. Med., 2021, 38, 76 Search PubMed.
- J. P. Chen, K. X. Zhang, Y. Liu, X. H. Gai, T. Ren, S. X. Liu and C. W. Tian, Chin. Tradit. Herb. Drugs, 2021, 52, 1772 Search PubMed.
- Q. Fan, X. B. Chen, L. Rong and C. X. Zhang, Nat. Pro. Res. Dev., 2020, 32, 1244 Search PubMed.
- J. J. Bi, Q. Zhou and P. Zhang, Jiangsu Agr. Sci., 2018, 46, 1 Search PubMed.
- H. L. Xu, Y. C. Li, Y. Q. Zhang, H. Feng, X. F. Li and L. L. Zhang, Asia-Pacific Tradi. Med., 2018, 14, 120 Search PubMed.
- W. Li, Y. L. Feng, T. E. Li, H. Wu, Y. Li, G. Y. Zhong, B. Wu and M. Z. He, J. Chin. Mass Spectr. Soc., 2016, 37, 504 CAS.
- C. M. Li, Y. W. Luo and B. Y. Tian, J. Heibi Norm. Univ., 2015, 39, 522 CAS.
- L. Li, C. M. Liu, Z. Q. Liu, L. Lv and S. Y. Liu, J. Chin. Mass Spectr. Soc., 2006, 27, 504 Search PubMed.
- B. B. Xu, B. T. Huang, J. X. Zeng, M. Li, J. Wang, Y. Y. Zhu, G. Ren, J. X. Zhu, G. M. Luo and X. Y. Wang, J. Exper. Tradit. Med. Formu., 2016, 22, 64 Search PubMed.
- J. Huang, Q. Shao, Y. H. Xiang, Z. W. Ge and X. H. Fan, Chin. J. of Chin. Mater. Med., 2014, 39, 2513 CAS.
Footnote |
| † Electronic supplementary information (ESI) available. See DOI: https://doi.org/10.1039/d2ra06063a |
| This journal is © The Royal Society of Chemistry 2022 |

