DOI:
10.1039/D2RA06725K
(Paper)
RSC Adv., 2022,
12, 33329-33339
Grafting macromolecular chains on the surface of graphene oxide through crosslinker for antistatic and thermally stable polyethylene terephthalate nanocomposites
Received
24th October 2022
, Accepted 16th November 2022
First published on 22nd November 2022
Abstract
The graphene oxide (GO) and polyethylene terephthalate (PET) molecular chains are connected together by the two amino groups of the crosslinking agent p-phenylenediamine (PPD). The presence of macromolecular chains could make GO uniformly dispersed in the polymer matrix, improving the antistatic performance and thermal stability of the nanocomposite. In this paper, GO was prepared by the improved Hummers, method. In the first step, an amine group of PPD undergoes a nucleophilic ring-opening reaction with an epoxy group on GO. Multiple characterization methods indicate that PPD is successfully grafted to the surface of GO sheets and GO is partially reduced simultaneously. The graphene layer spacing increased from 0.81 nm for GO to 1.49 nm for grafted graphene oxide (g-GO). The number of oxygen-containing functional groups in GO is also reduced. The conductivity of g-GO at room temperature is 1.8 S cm−1, which is much higher than that of GO. In addition, the thermal stability of g-GO has also been improved. In the second step, the other unreacted terminal amino group of PPD is grafted to PET molecular chains through hydrogen bonding or amidation reactions. Antistatic and thermally stable nanocomposites were then obtained by hot pressing. Different ratios of graphene/polyester nanocomposites were obtained. At the same time, the g-GO is further thermally reduced. The thermal stability of PET/g-GO nanocomposite has been greatly improved, while the thermal stability of PET/GO nanocomposite is basically the same as that of pure PET. For the PET/g-GO nanocomposite, the residue rate has increased by nearly 10%, and the maximum thermal decomposition temperature has also increased by 11 °C. When the content of g-GO is 1.0 vol%, the bulk conductivity of PET/g-GO nanocomposite is increased by 8 orders of magnitude. However, when the content of GO is 1.0 vol%, the bulk conductivity of the PET/GO nanocomposite is only improved by 3 orders of magnitude. PET/g-GO nanocomposites exhibit good antistatic properties. The PET/g-GO nanocomposite's conductive percolation threshold is 0.61 vol%, while that of the PET/GO nanocomposite is 1.64 vol%. The electrical conductivity of the nanocomposite increases with the increase of graphene content. And the well-dispersed modified graphene can improve the electrical conductivity of the nanocomposite.
1. Introduction
Since its discovery in 2004,1,2 a lot of research has been done on the properties of graphene. Graphene has been found to have exceptionally excellent properties in mechanical,3,4 optical,5–7 electrical8–13 and thermal14–17 aspects. Graphene/polymer composites could be used in some applications such as energy storage, conductive polymers, electrostatic shielding coatings, and electromagnetic shielding.18,19 There are still some polar groups on the surface of graphene sheet obtained by redox method,20 such as carboxyl (–COOH), hydroxyl (–OH) and other functional groups, which provide good bonding sites for polymer modification.21–23
As a result of strong interlayer hydrogen bonding and large specific surface area, graphene is very easy to agglomerate and difficult to disperse uniformly when it is compounded with polymer.24–26 Therefore, the dispersion of graphene in polymers has become a key point in the preparation of graphene/polymer nanocomposites.27,28
In order to make graphene disperse uniformly in the polymer matrix, functional modification of graphene surface has become an effective way. Liu et al.29 prepared a conductive PET/graphene oxide composite material by an in situ melt polycondensation, which organically combined the two methods of melt blending and in situ polymerization. They mixed graphene oxide with raw materials, catalysts, stabilizers, etc., and then added them into the reactor. Through esterification and polycondensation, PET/graphene oxide composites with improved properties were prepared. It was found that graphene oxide was reduced under the action of high temperature, losing most of the oxygen-containing groups and was dispersed uniformly in the PET matrix. Feng et al.30 successfully prepared PET/graphene composites with good electrical conductivity by in situ polymerization, which successfully supported silica and titania on the surface of graphene oxide sheets as catalysts. It was found that the prepared composite had a low percolation threshold. Aoyama et al.31 prepared composites of carbon nanotubes, graphene and PET by melt blending, and compared the two composites. Zhao et al.32 modified graphene with different silane coupling agents, and then graphene polyester nanocomposites were obtained by direct esterification and in situ polymerization. The prepared nanocomposites, thermodynamic stability and mechanical properties were studied. Wang et al.33 firstly modified polyester (PET) fabric with poly(diallyl dimethyl ammonium chloride) (PDDA), and then coated them silver/reduced graphene oxide (Ag/RGO) through chemical reduction method. Multi-functional textile was obtained.
It is an effective method to connect graphene oxide and polymer molecular chains by specific compounds through chemical reaction or hydrogen bonding for nanocomposite with improved properties. In this paper, graphene polyester nanocomposites were prepared in two steps. The first step was to graft PPD on the surface of GO, which could simultaneously modify and partially reduce GO. An amine group of PPD underwent a nucleophilic ring-opening reaction with epoxy group on GO. Then g-GO with good electrical conductivity was obtained. The second step was to use PPD to link g-GO and PET molecules together. Another terminal amino group that did not participate in the reaction of grafting PPD on the surface of GO formed a hydrogen bond with the carboxyl group at the end of the PET molecular chain or underwent an amidation reaction. The graphene-polyester nanocomposite in which g-GO was uniformly dispersed in the polyester matrix was obtained.
2. Experimental
2.1. Materials
Natural graphite flakes were obtained from Huadong Graphite Factory (China) with an average diameter of 13 μm. Potassium permanganate (KMnO4, 99%), concentrated sulfuric acid (H2SO4, 96%), hydrochloric acid (HCl, 36%), sodium nitrate (NaNO3, 98%), ammonia (25% to 38%), ethanol (99.7%) were all obtained from Beijing Chemical Factory (China) and used as received. PPD was obtained from Tianjin Guangfu Fine Chemical Research Institute Research Institute (China).
2.2. Preparation
2.2.1. Step 1: grafting PPD on the surface of GO. GO was prepared by the modified Hummers, method,34 through low-temperature oxidation, medium-temperature oxidation, and high-temperature oxidation in three stages.35 In a typical experiment, 10 mg of the prepared graphite oxide powder was dissolved in 100 mL deionized water by ultrasonic dispersion to obtain a completely exfoliated GO suspension. Then, the pH value of the reaction system was adjusted to 9 to 12 by adding diluted ammonia water drop by drop. After mechanical stirring for 0.5 h at room temperature, the temperature was rapidly raised to 90 °C to 100 °C. 0.1 g PPD was added to the reaction system, which was kept at this temperature for 3 h. Then, the reaction system was vacuum filtered and rinsed with a large amount of deionized water and ethanol to remove unreacted PPD. Finally, the obtained product was dried in a blast oven at 80 °C for 24 h, and set aside.
2.2.2. Step 2: using PPD to link GO and PET molecules together. The polyester molecular chain was grafted on the surface of GO by melt blending. 10 g of dried PET and g-GO or GO in different proportions were mixed uniformly to obtain a mixture. The mixture obtained in the above steps was extruded and pelletized by a twin-screw blending extruder. The temperature of the upper cavity plate of the extruder was 265 °C and the temperature of the lower cavity plate was 275 °C. The screw speed was maintained at 40 rpm during feeding, and the rotational speed was maintained at 150 rpm during cyclic banburying. Then the screw speed was maintained at 50 rpm when discharging. The obtained composite material was broken with a universal pulverizer and pressed into a test sample on a flat vulcanizer. The pressing conditions were as follows: the obtained composite material powder was first preheated at 275 °C for 15 minutes, then molded for 15 minutes at a pressure of 10 MPa, and exhausted three times during this stage, finally a 1 mm thick composite material sample was made.
2.3. Characterization
The XRD spectrum was tested by Bruker's D8-ADVANCE X-ray diffractometer (scanning range 5° to 80°, scanning speed 5° min−1). The potassium bromide powder and the dried sample powder were tableted and tested on a Spectrum One FT-IR spectrometer with a scanning range from 4000 cm−1 to 400 cm−1. The size distribution of the samples was obtained by a laser particle size analyzer (HPPS5001, Malvern, UK). The TGA curve was tested by METTLERTOLEDO TGA/DSC 1 thermal analyzer under N2 atmosphere with a heating rate of 20°C min−1, and the test range was from 25 °C to 600 °C. The DSC curve was tested by Netzsch DSC 2004 Phoenix thermal analyzer. The sample was heated from 25 °C to 300 °C at the rate of 10 °C min−1 under argon atmosphere, kept at 300 °C for 5 min to eliminate the thermal history, and then cooled to 50 °C at the rate of 10 °C min−1. The Raman spectrum of the sample was measured by a Renishaw inVia plus Raman analyzer (λ = 514.5 nm). The SZ-82 digital four-probe tester from Guilin Electrical Apparatus Research Institute and PC-68 digital high resistance meter from Suzhou Telecommunications Instrument Factory were used to test the conductivity of the samples. The samples with the conductivity lower than 10−6 S cm−1 were measured by the PC-68 digital high resistance meter while the samples with the conductivity higher than 10−6 S cm−1 were measured by SZ-82 digital four-probe tester. The conductivity of each sample needs to be measured five times to get the average value. XPS was tested by ESCALAB250Xi X-ray photoelectron spectrometer. The dried sample was pasted on the sample stage with conductive adhesive, and the surface of the sample was sprayed with gold sputter at a thickness of 10 nm to 20 nm, then the sample was observed by FEI Quanta200F scanning electron microscope at an accelerating voltage of 5 kV. The SEM working distance was 10 mm. Secondary Electrons detector were employed. In addition, energy dispersive spectroscopy (EDS) was used to determine the element composition of the nanocomposite. The samples were ultrasonically dispersed in ethanol, dropped on an ultra-thin carbon film, and observed with a JEM-2100 transmission electron microscope (TEM) at an accelerating voltage of 300 kV. The thickness of the GO sheet was observed by a Bruker multimode 8 atomic force microscopy (AFM) in the tapping mode. And the samples were deposited on freshly cleaved mica surfaces after ultrasonication.
3. Results and discussion
3.1. Grafting PPD on the surface of GO
3.1.1. Structural analysis of GO and g-GO. GO could be well dispersed in deionized water after a simple ultrasound, as a result of a large number of active groups on the surface of GO. Under some certain conditions, the amine group of PPD reacted with the epoxy group of GO, as a nucleophilic substitution reaction.36 As shown in Fig. 1, the colour of the GO suspension before the reaction was brown and yellow, and the colour of the reaction system changed to black when the reaction was completed. This shows that GO was successfully restored, and we could also use other characterization methods to prove this judgment.
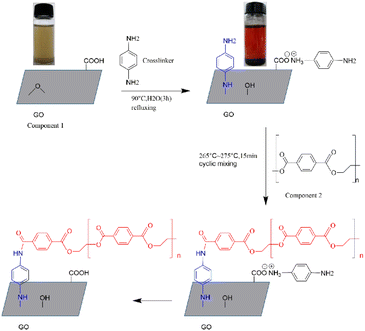 |
| | Fig. 1 Process of grafting PET chains on the surface of GO through PPD. | |
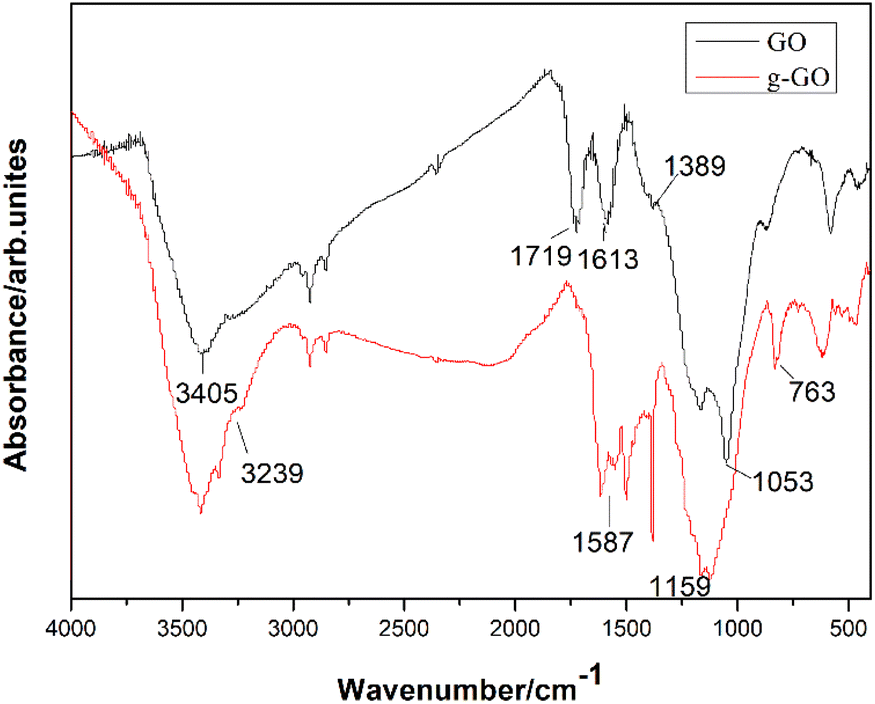
PPD successfully reduced and modified GO simultaneously. As is shown in the infrared spectra of GO and g-GO Fig. 2, we can see that GO has a characteristic peak at 3405 cm−1, which corresponds to the characteristic peak of hydrogen bonds. Three characteristic peaks appearing at 1053 cm−1, 1613 cm−1 and 1719 cm−1 in the infrared spectrum correspond to the C–O–C of the epoxy group on the surface of GO, the characteristic peak of C![[double bond, length as m-dash]](https://www.rsc.org/images/entities/char_e001.gif) C in the GO skeleton and CO in the carboxyl group. The characteristic peak at 1389 cm−1 corresponds to the characteristic peak of hydroxyl (–OH) on the surface of the GO sheet. After the reaction is complete, the intensity of the characteristic peaks of oxygen-containing groups in g-GO has been significantly reduced compared with GO, which proves that GO has been reduced to a certain extent. Moreover, a new characteristic peak appears at 3239 cm−1, which represents the newly formed hydrogen bond. We found that the characteristic peak at 1159 cm−1 represents the stretching vibration of C–N in the C–NH–C group. This indicated that the amine group of PPD and the epoxy group of GO had undergone a nucleophilic ring opening reaction. The two characteristic peaks at 1587 cm−1 and at 763 cm−1 also proved that the amino group was grafted onto the surface of GO.
C in the GO skeleton and CO in the carboxyl group. The characteristic peak at 1389 cm−1 corresponds to the characteristic peak of hydroxyl (–OH) on the surface of the GO sheet. After the reaction is complete, the intensity of the characteristic peaks of oxygen-containing groups in g-GO has been significantly reduced compared with GO, which proves that GO has been reduced to a certain extent. Moreover, a new characteristic peak appears at 3239 cm−1, which represents the newly formed hydrogen bond. We found that the characteristic peak at 1159 cm−1 represents the stretching vibration of C–N in the C–NH–C group. This indicated that the amine group of PPD and the epoxy group of GO had undergone a nucleophilic ring opening reaction. The two characteristic peaks at 1587 cm−1 and at 763 cm−1 also proved that the amino group was grafted onto the surface of GO.
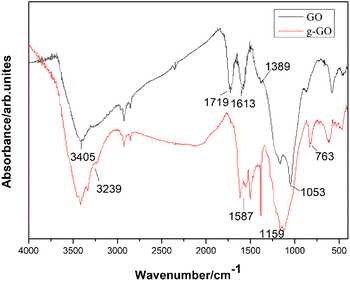 |
| | Fig. 2 FTIR spectra of GO and g-GO. | |
In addition, we can also use XRD spectrum to prove that PPD was grafted on the surface of GO. The interlayer spacing of graphene derivatives can be known through XRD. Then the change of graphene structure can be known. The interlayer spacing of the sample is calculated according to Bragg's law (1):
| |
2d![[thin space (1/6-em)]](https://www.rsc.org/images/entities/char_2009.gif) sinθ = nλ sinθ = nλ
| (1) |
Among them, λ is the wavelength of the X-ray, θ is the incident angle of the X-ray, n is a positive integer, and d is the graphene interlayer spacing.
As shown in Fig. 3, the GO we prepared has a sharp characteristic peak at 11.2°, from which, the interlayer spacing of GO can be calculated to be 0.81 nm. Some oxygen-containing functional groups were grafted to the natural flake graphite during the oxidation process. As a result the interlayer spacing was enlarged from 0.34 nm to 0.81 nm. The g-GO has a characteristic peak at about 5.8°, and the interlayer spacing changes to 1.49 nm. It shows that during the modification process, PPD was grafted onto the surface of GO. After the reaction, the characteristic peak of GO at 11.2° disappears. This proves that g-GO has lost part of the oxygen-containing functional groups. At the same time, PPD is grafted to GO and the layer spacing is further increased. The g-GO has a new bulging peak around 24.5°, which corresponds to the irregular crystal structure of graphene. This also shows that GO has been successfully reduced to a certain extent.
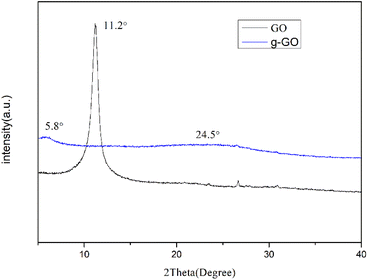 |
| | Fig. 3 XRD pattern of g-GO and GO. | |
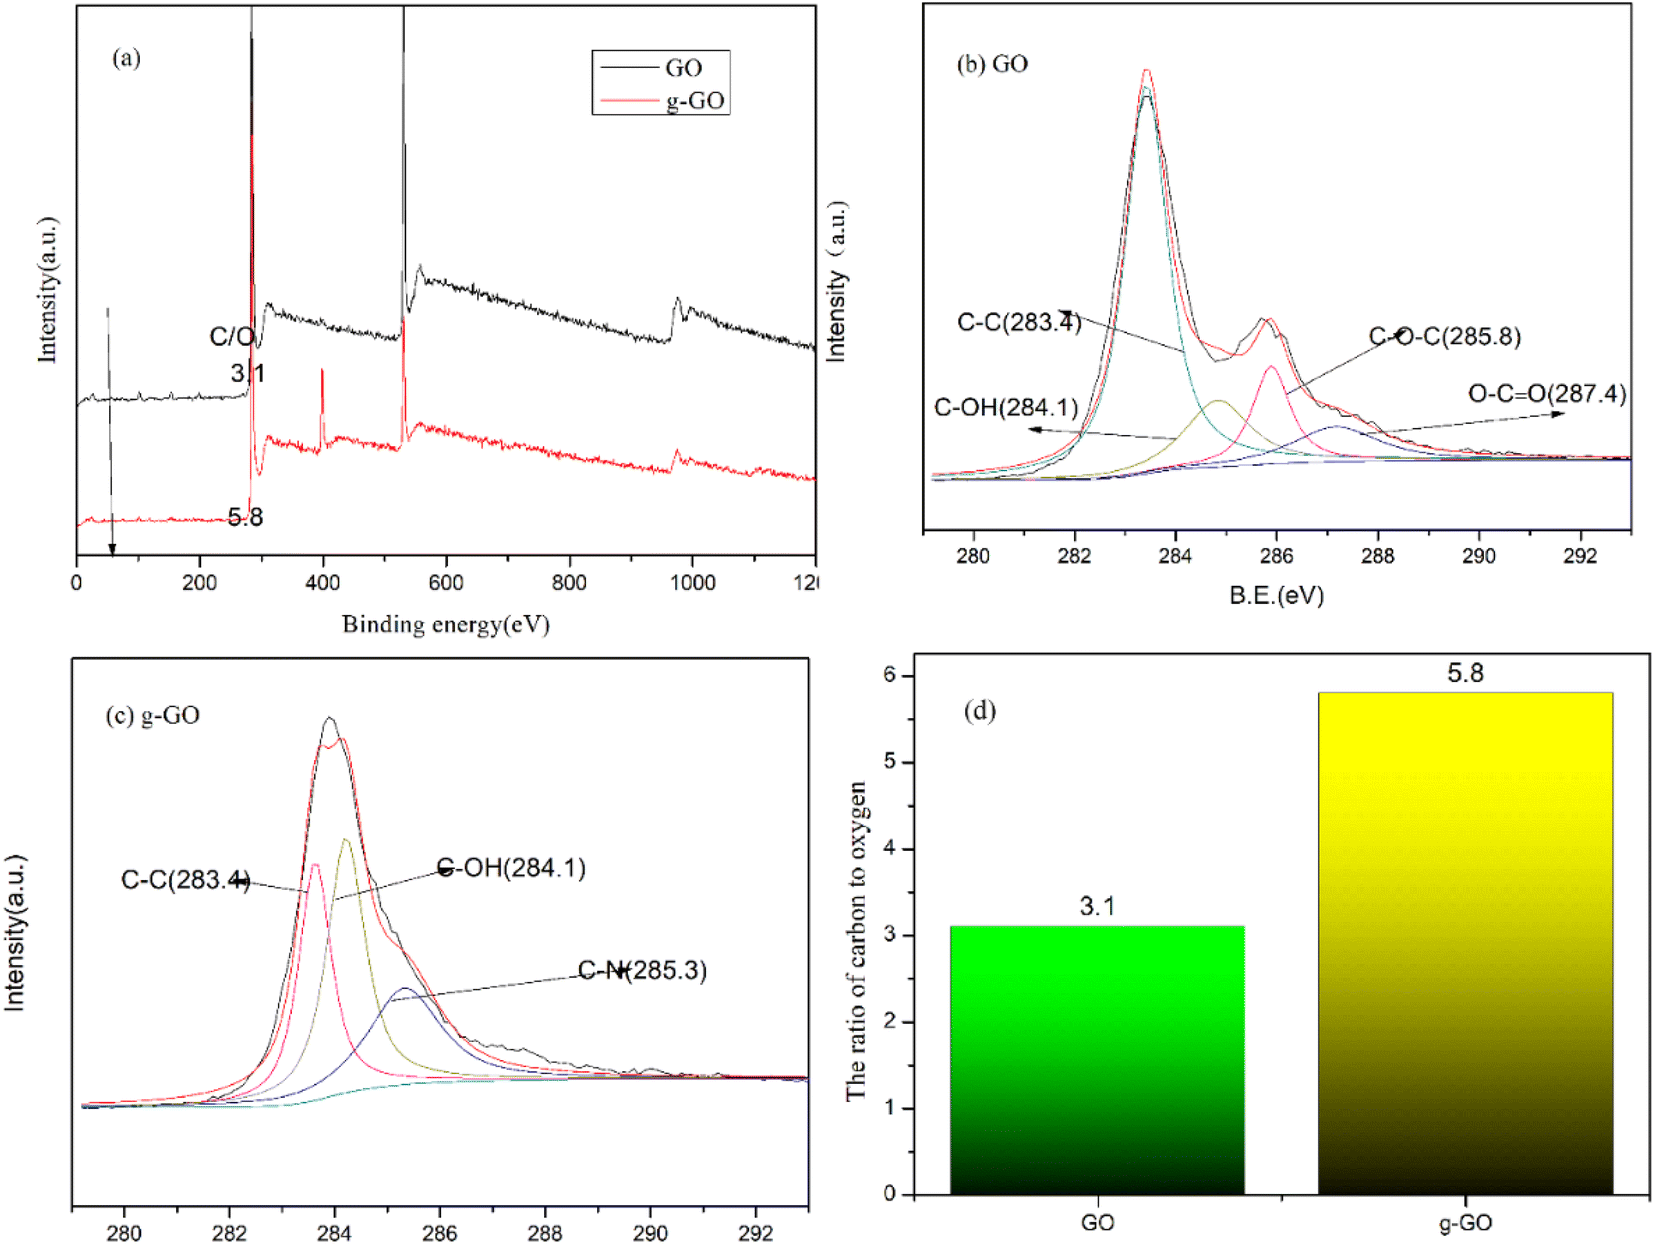
We can know the removal of oxygen-containing groups in GO and the formation of new chemical bonds in g-GO during the reaction through the XPS spectra. Fig. 4 shows the XPS spectra of GO and g-GO. It can be seen from the figure that GO can fit 4 characteristic peaks: the C–C group of the six-membered ring carbon skeleton on the GO layer at 283.4 eV, the hydroxyl group C–OH at 284.1 eV, the epoxy group C–O–C at 285.8 eV, and the carboxyl group O–CO at 287.4 eV. We found that the ratio of carbon to oxygen (C/O) in the sample increased from 3.1 for GO to 5.8 for g-GO. This proves that most of the oxygen-containing groups have been removed. With the reaction, the characteristic peak intensity of the oxygen-containing groups of g-GO is significantly lower than that of GO. In addition, for the XPS spectrum of g-GO, the characteristic peak of the epoxy group disappeared, and a new characteristic peak of C–N (285.3 eV) appeared. PPD grafted onto the GO surface through a nucleophilic substitution reaction. The principle is that the amine group of PPD and the epoxy group of GO undergo a nucleophilic ring-opening reaction, causing part of the PPD to be grafted to the surface of the GO sheet.
 |
| | Fig. 4 (a) General XPS spectra of GO and f-RGO; (b) C 1s XPS spectra of GO; (c) C 1s XPS spectra of g-GO; (d) the ratio of carbon to oxygen (C/O). | |
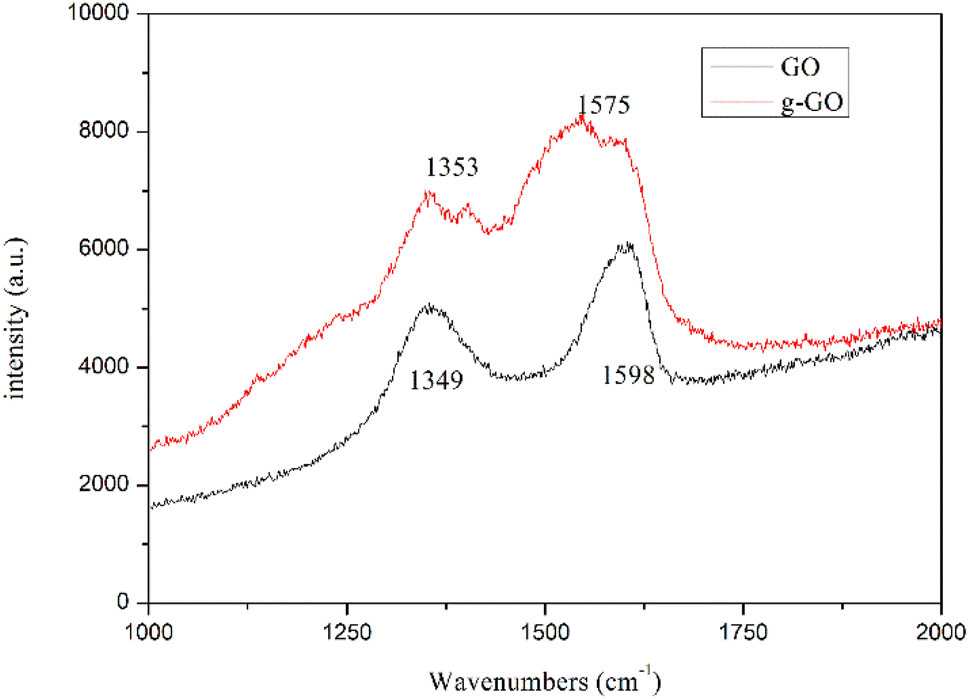
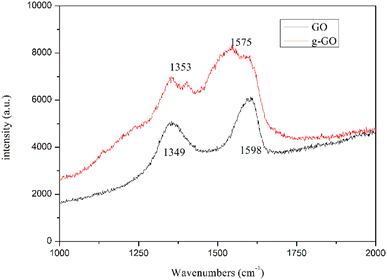
Fig. 5 shows the Raman spectra of g-GO and GO. From the figure, we can see that compared with GO, g-GO also only has D peak and G peak, but there is a significant difference in the intensity ratio of the peaks. After grafting PPD on the surface of GO, the G peak has a red shift from 1598 cm−1 to 1575 cm−1, which is closer to the G peak (1581 cm−1) of pure natural graphite. It proves that g-GO is more similar to natural graphite, and part of the sp2 network of GO has been repaired. We can also see from Table 1 that the ratio of D band to G band in Raman spectra for g-GO is larger than that for GO. This is because after PPD is grafted on the surface of GO, a large number of carbon atoms in the GO sheet are mixed. The transition state changes from sp3 hybridization to sp2 hybridization. As a result, the average area of sp2 hybridized carbon atoms becomes smaller. This explains the increase in the ratio of D peak to G peak.
 |
| | Fig. 5 Raman spectra of natural GO and g-GO. | |
Table 1 The ratio of D and G band in Raman spectra
| Sample |
GO |
g-GO |
| ID/G |
0.77 |
0.89 |
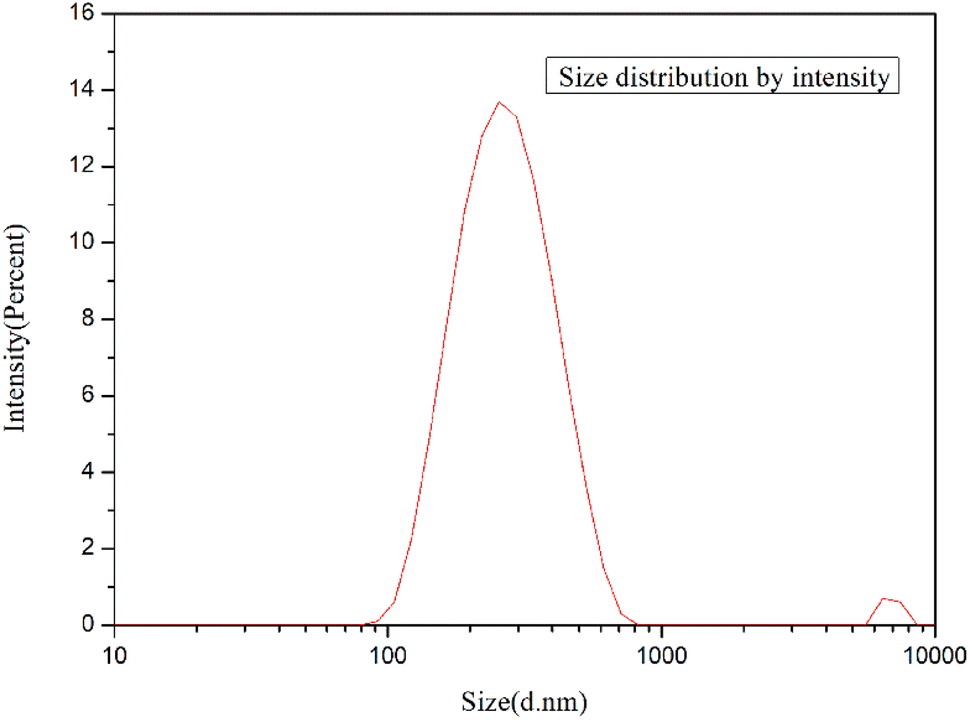
3.1.2. Micro structure of GO and g-GO. As we know, the particle size of graphene has a great influence on the properties of modified polymers.Fig. 6 shows the particle size analysis of GO. The particle size of GO was measured by laser particle size analyzer. The prepared GO can be sufficiently exfoliated and pulverized to be miniaturized by ultrasonic treatment. As shown in the figure, the size of GO sheets is mainly distributed between 90 nm and 600 nm, with an average size of 224.5 nm.
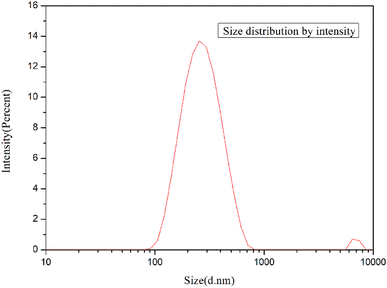 |
| | Fig. 6 Size distribution of GO. | |
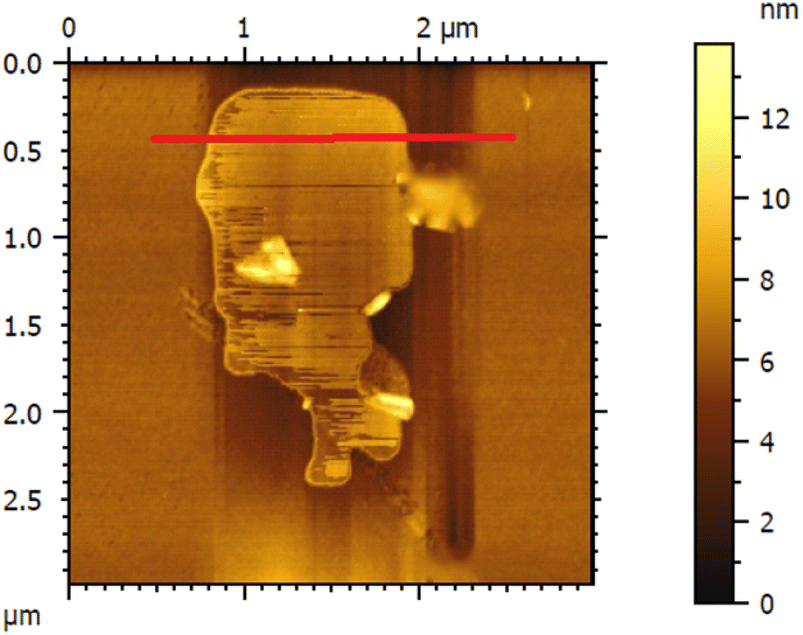
The thickness of the ultrasonically exfoliated GO sheet was about 0.89 nm by atomic force microscopy (AFM) test (Fig. 7 and 8). Nano-sized graphene oxide sheet was successfully obtained.
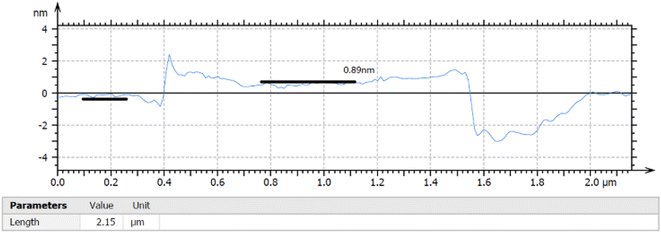 |
| | Fig. 7 Section analysis of as-exfoliated GO suspension. | |
 |
| | Fig. 8 AFM image of as-exfoliated GO suspension. | |
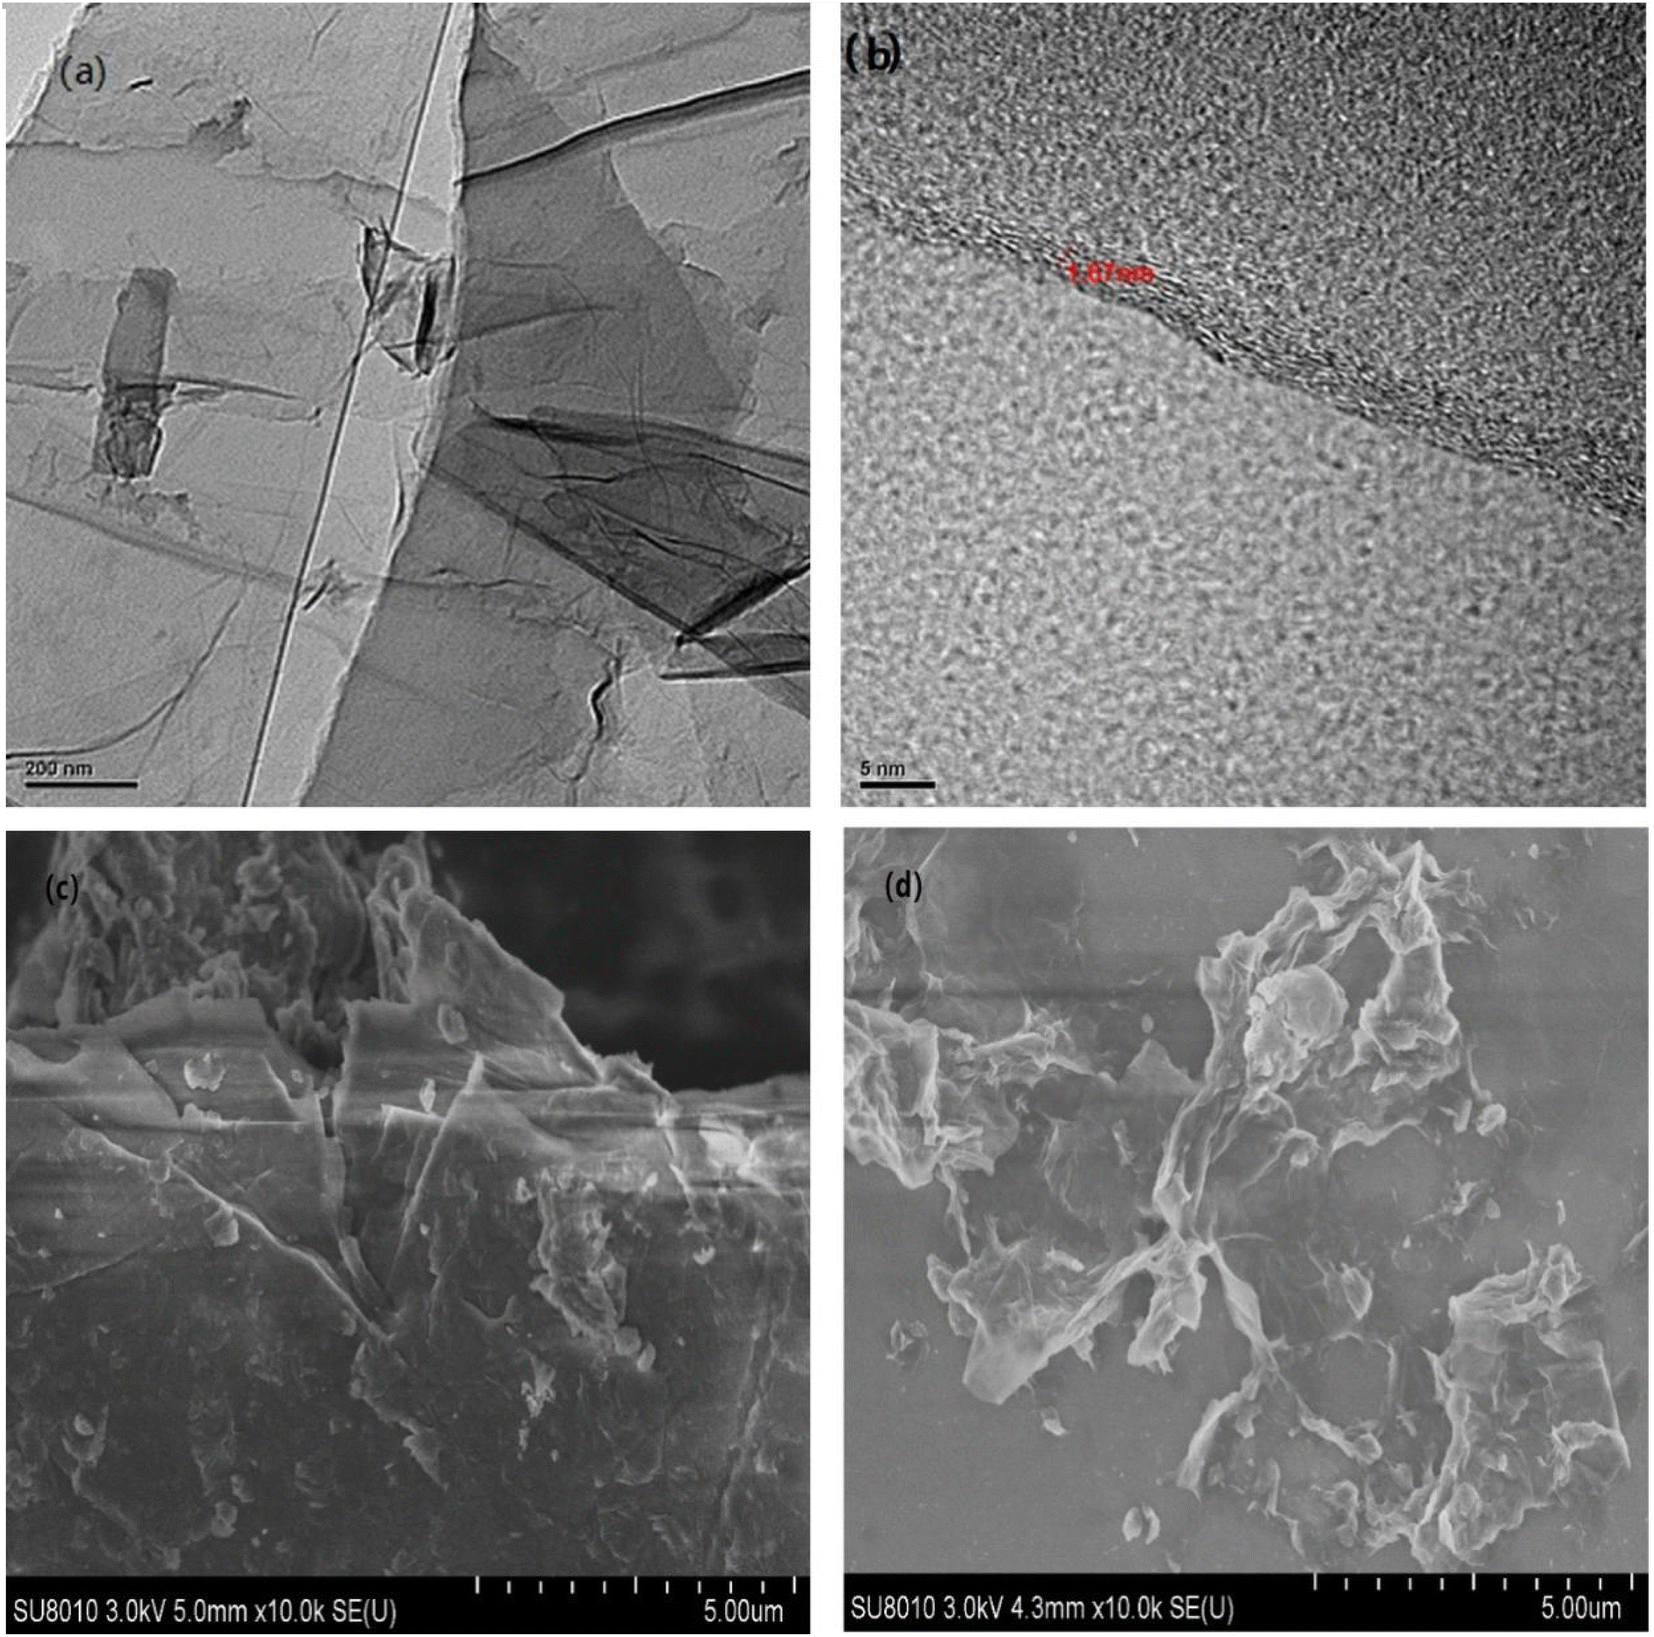
As is shown in Fig. 9(a) and (c), GO after ultrasonication could be well dispersed and exfoliated. The GO sheet is in a curled state. There are many wrinkles on the surface. The layer size of the GO sheet is about a few microns. The prepared GO has a high degree of exfoliation and a relatively thin sheet. Fig. 9(b) shows a cross-sectional photo of GO. As shown in the figure, the GO after ultrasonic peeling has about 3 to 5 layers. After measurement, the thickness of two layers of GO can be obtained to be 1.67 nm. This further shows that the GO prepared by us is well exfoliated and dispersed. Fig. 9(d) shows the SEM images of the surface morphologies of g-GO. It can be seen from the figure that the surface of g-GO is more wrinkled. For GO, the interaction between GO sheets is large. For g-GO, PPD was grafted between the GO sheets, and the introduction of PPD not only weakened the interaction between GO but also increased the interlayer spacing. This also explains the reasons for the flattened GO surface and the obvious wrinkles on g-GO surface.
 |
| | Fig. 9 (a) TEM images of GO; (b) cross-section of GO sheets; (c) SEM images of GO; (d) SEM images of g-GO. | |
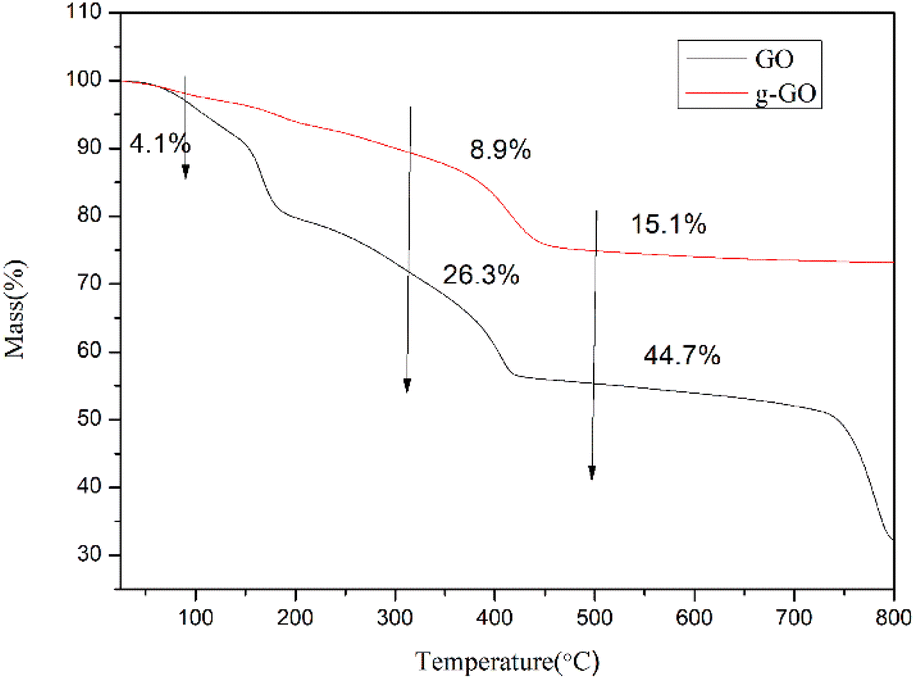
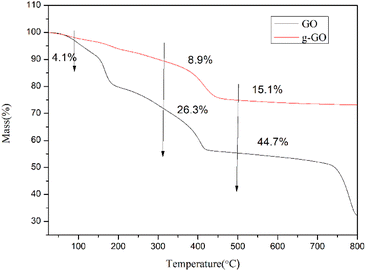
3.1.3. Thermodynamic and electrical properties of GO and g-GO. Fig. 10 shows the thermogravimetric curves (TGA) of GO and g-GO under nitrogen atmosphere. As can be seen from the figure, GO has a weight loss of about 4.1 wt% at 100 °C, as a result of a certain amount of water molecules absorbed by oxygen-containing groups on the surface of graphite oxide. GO loses about 26.3 wt% weight at 300 °C, which is because the unstable groups on the surface of GO decompose at high temperature. GO loses about 44.7 wt% weight at 500 °C, and the stabilizing groups on the GO surface are decomposed at this temperature. However, for g-GO, it loses about 8.9 wt% weight at 300 °C, and the unstable groups on the surface of g-GO decompose at this temperature. The g-GO loses about 15.1 wt% weight at 500 °C, and the unstable groups on the g-GO surface are decomposed at ultra-high temperatures. This also proves that PPD was grafted on the surface of GO, and PPD can reduce and modify GO at the same time, turning it into g-GO with better thermal stability from another aspect.
 |
| | Fig. 10 Normalized TGA curves of GO and f-RGO. | |
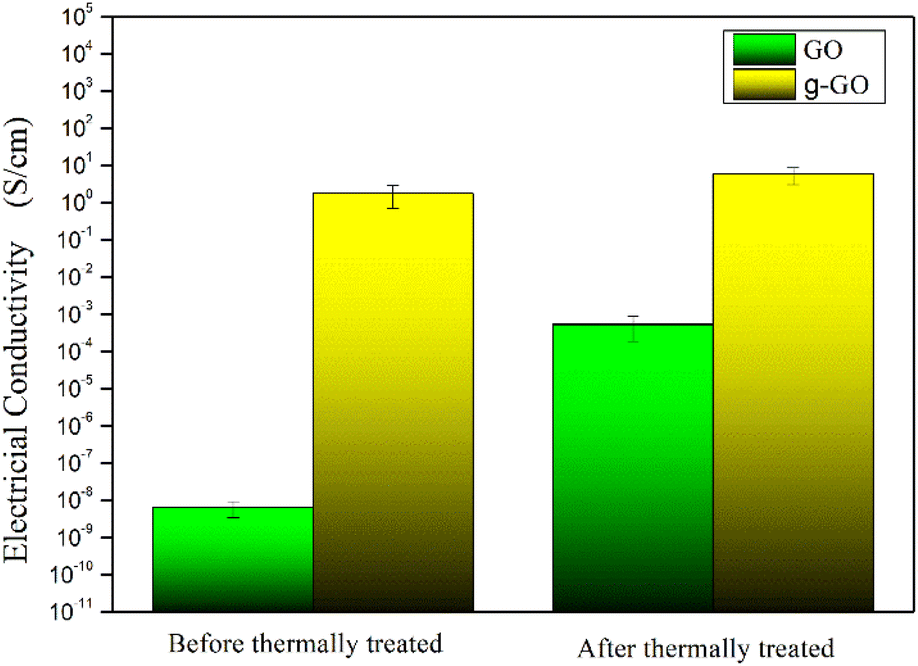
GO and g-GO were pressed into 1 mm thick flakes using an infrared tablet press. Then, the electrical conductivity of GO and g-GO was tested using a four-probe conductivity tester or a digital high resistance meter. As shown in Fig. 11, the conductivity of GO is 6.3 × 10⁻⁹ S cm−1, while the conductivity of g-GO after the reaction is as high as 1.8 S cm−1. This also shows that PPD was grafted on the surface of GO from another aspect.
 |
| | Fig. 11 The electrical conductivities of GO and g-GO before and after thermal treatment at 275 °C for 30 min. | |
3.2. Using p-phenylenediamine to link graphene oxide and polyester molecules together
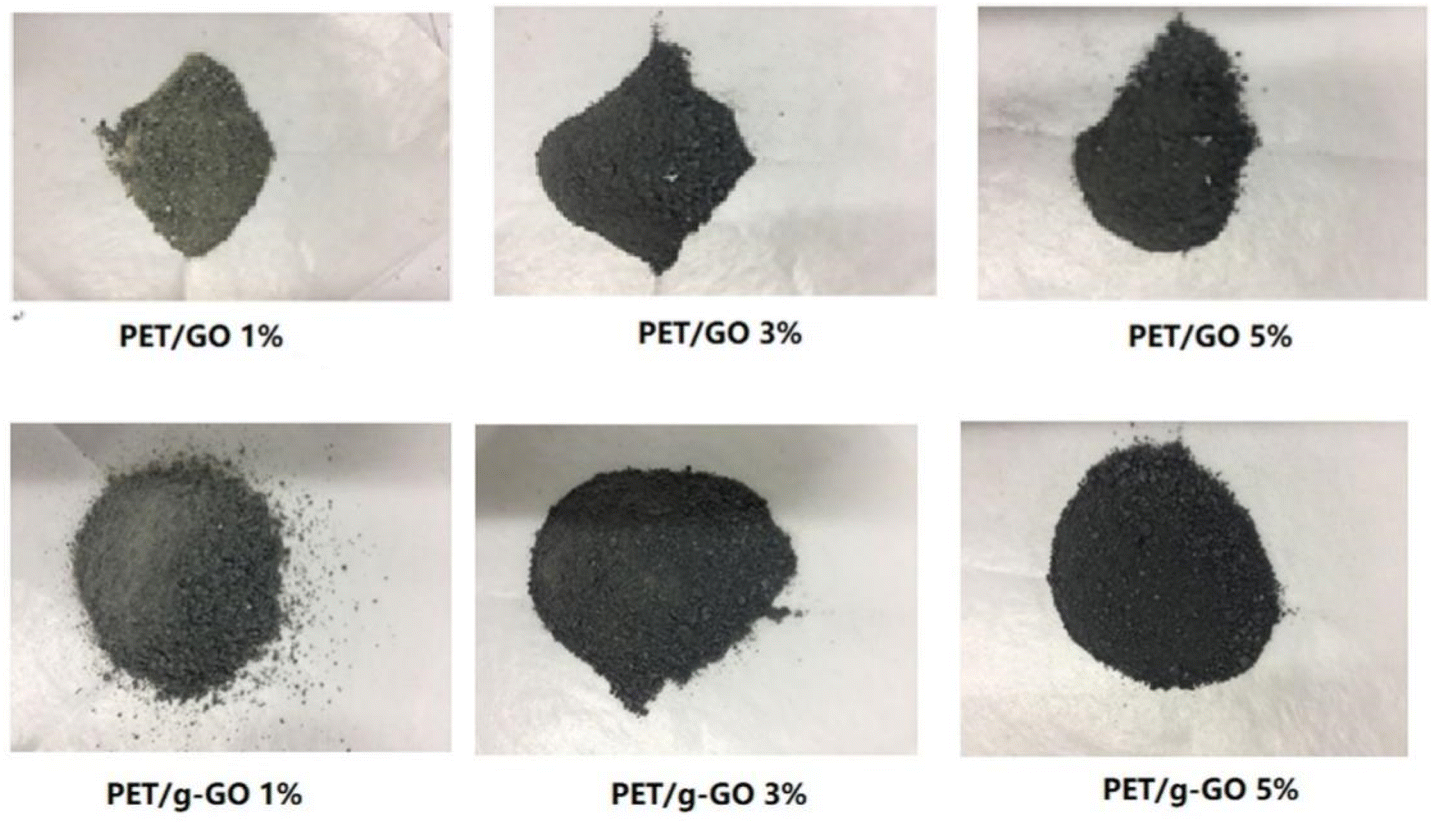
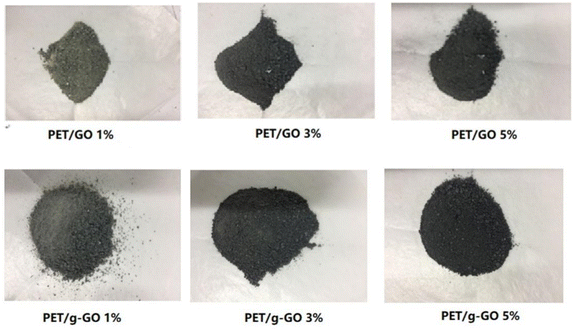
3.2.1. Graphene/PET composite slices. Fig. 12 shows the slice photos of PET/g-GO and PET/GO nanocomposites with different contents. It can be clearly seen from the photos that all samples are in a dark colour. With the increase of filler content, the color of both PET/g-GO and PET/GO composites gradually changes from gray to black, and the surface of the sample has good gloss.
 |
| | Fig. 12 Digital photographs of PET/GO and PET/g-GO composites with different graphene contents. | |
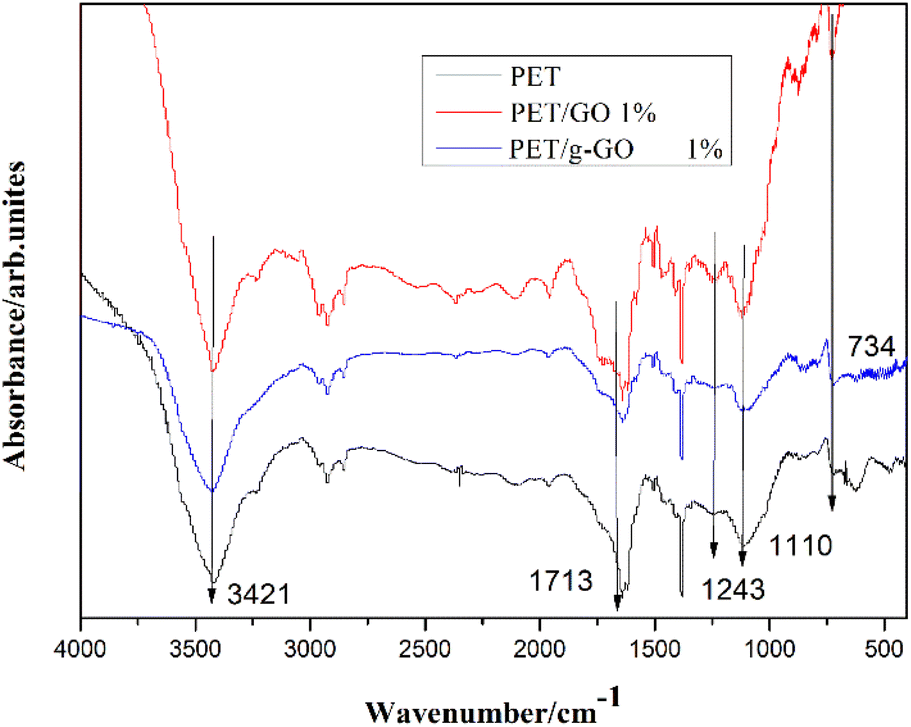
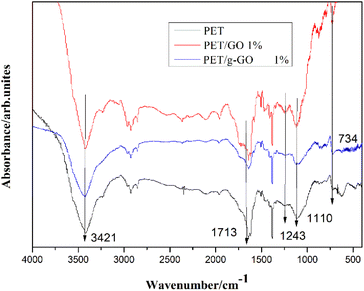
3.2.2. Structural analysis of PET/GO and PET/g-GO nanocomposites. Fig. 13 shows the infrared spectra of pure PET, PET/GO and PET/g-GO nanocomposites. The characteristic peak at 3421 cm−1 represents the stretching vibration of hydroxyl group (–OH), and the characteristic peak at 1713 cm−1 represents the CO stretching vibration on the aryl group. The characteristic peaks at 1243 cm−1 and 1110 cm−1 represent the stretching vibration of C–O on the carboxyl group. The characteristic peak at 726 cm−1 represents the out-of-plane bending vibration of aromatic ring C–H. Several weaker but sharper peaks appearing between 1700 cm−1 and 1400 cm−1 represent benzene ring skeleton vibrations. Compared with pure PET, the infrared spectra of PET/g-GO nanocomposite showed that the positions of characteristic peaks did not change significantly. This indicated that the new chemical bond between the PET macromolecular chain and GO or g-GO were not detected during the experiment in this chapter. This also proved that the addition of graphene did not change the chemical structure of PET.
 |
| | Fig. 13 FTIR spectra of the composites (1 wt%) and pure PET. | |
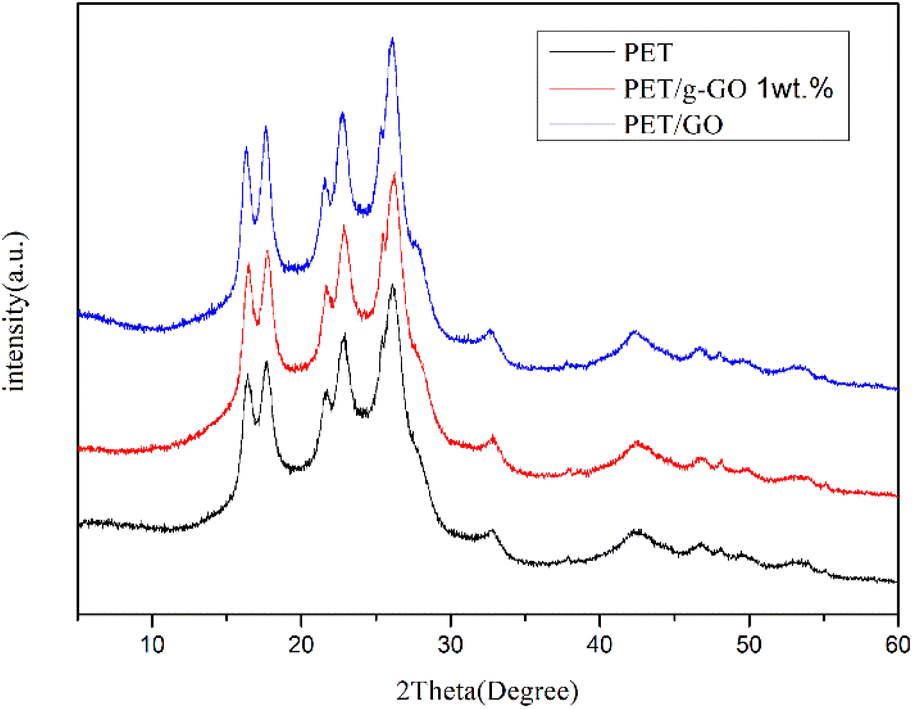
We can further study the dispersion of GO and g-GO in PET by XRD. Fig. 14 shows the XRD patterns of pure PET and PET/g-GO nanocomposites with filler content of 1 wt% and 3 wt%. From the figure, we can see that the characteristic peaks of pure PET are at 17.60°, 22.54°, and 25.80°. The XRD patterns of PET/GO and PET/g-GO are basically similar to the peak shapes of pure PET. And in the 1 wt% PET/g-GO nanocomposite, the peak of its filler g-GO does not appear. This fully shows that g-GO is exfoliated in the polymer matrix and has good dispersibility. However, in the PET/GO nanocomposite, the peak on the left side of the pattern is shifted to the left, which is closer to the peak of GO at 11.2°. The dispersion in the polymer matrix is not uniform, so the peak on the left side of the obtained PET/GO nanocomposite is shifted to a place closer to the peak of GO.
 |
| | Fig. 14 XRD of the composites (1 wt%) and pure PET. | |
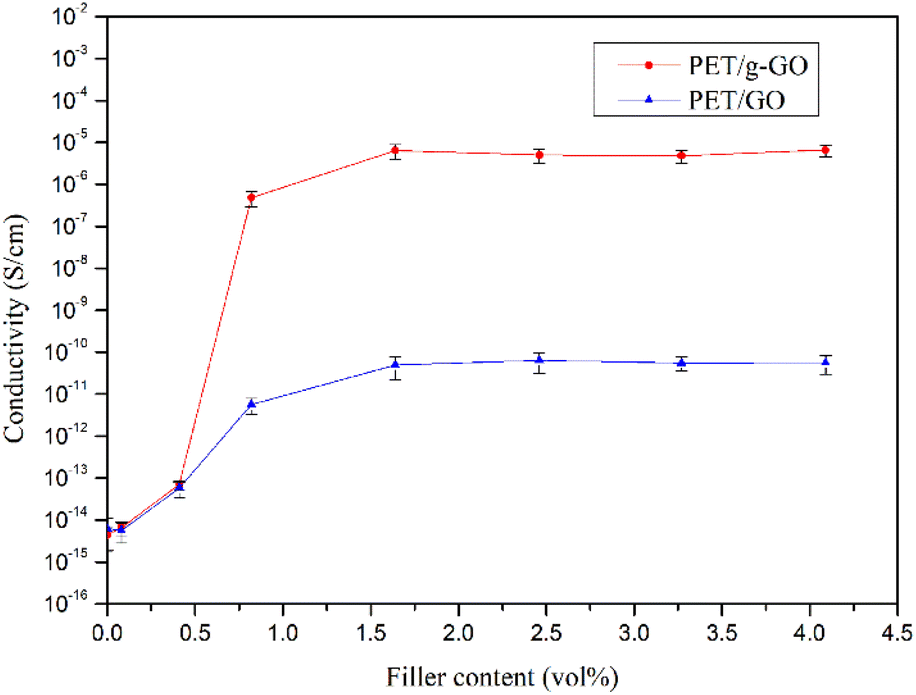
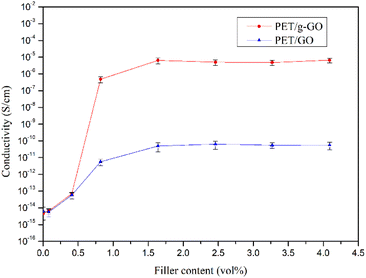
3.2.3. Study on conductive properties of PET/GO and PET/g-GO nanocomposites. The electrical conductivity of the PET/GO and PET/g-GO nanocomposites with different contents was tested by a digital high resistance meter and a four-probe tester. As shown in Fig. 15, the electrical conductivity of PET/g-GO series nanocomposites is much higher than that of PET/GO series nanocomposites. The conductive percolation threshold of PET/GO series nanocomposites is as high as 1.64 vol%, while the conductive percolation threshold of PET/g-GO series nanocomposites is as low as 0.61 vol%. This is not only because the electrical conductivity of g-GO itself is higher than that of GO, but also because g-GO has better dispersion properties than GO in the PET matrix. When the content of g-GO is 3.07vol%, the electrical conductivity of the PET/g-GO nanocomposite is 6.34 × 10⁻⁶ S cm−1.
 |
| | Fig. 15 The conductivity curves of PET/GOand PET/g-GO nanocomposites with different filler contents. | |
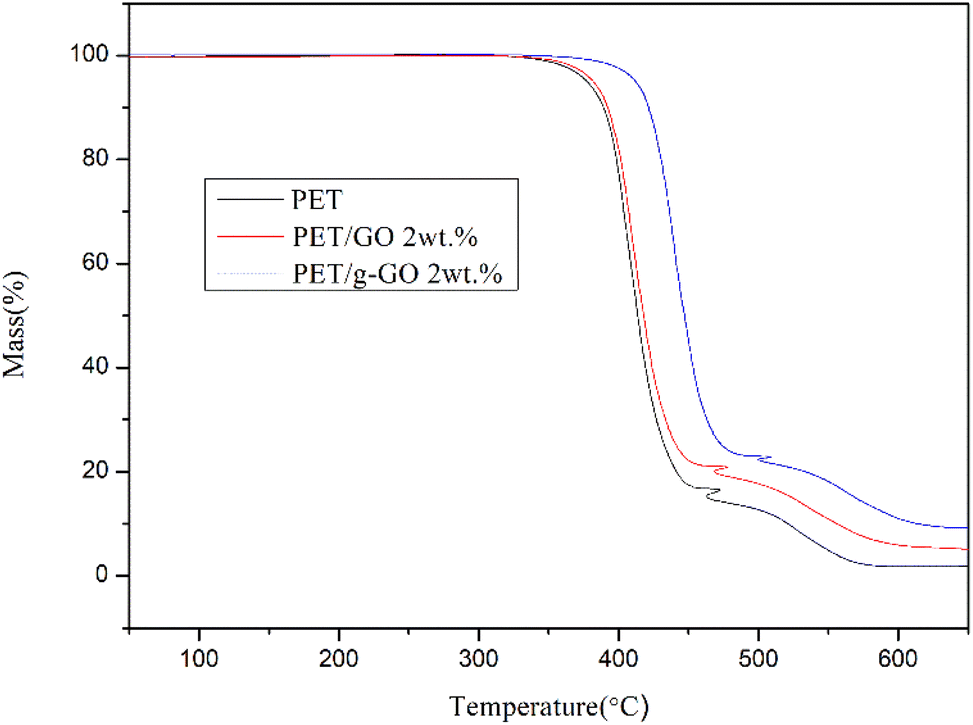
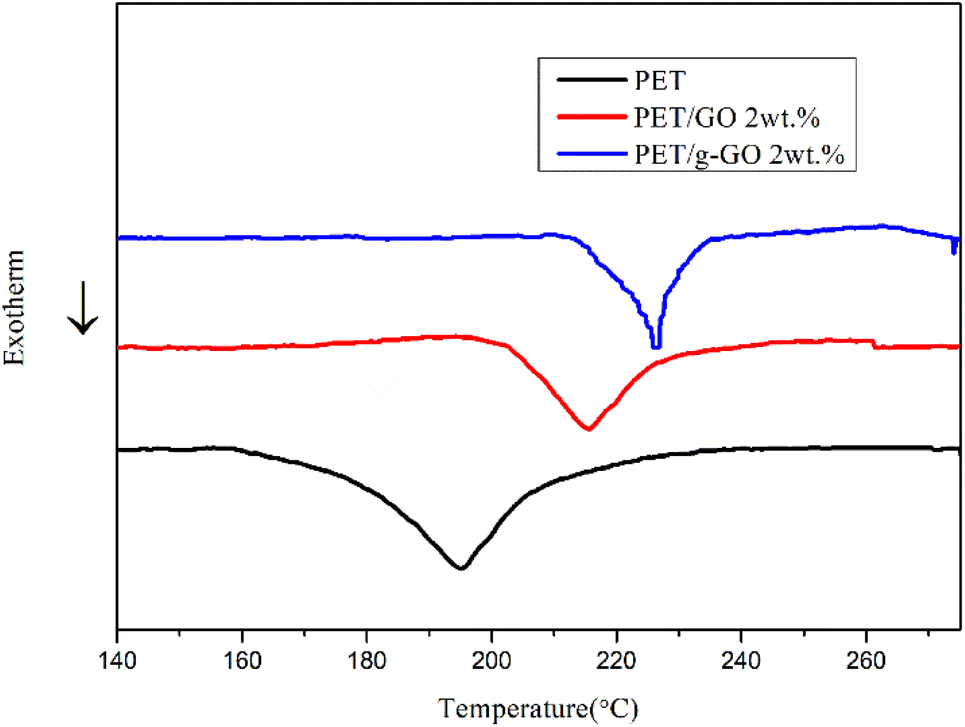
3.2.4. Study on thermal stability of PET/GO and PET/g-GO nanocomposites. The thermal stability of graphene is very good.37–39 The thermal weight loss and crystallization of PET/GO and PET/g-GO nanocomposite samples were analyzed. The effects of GO and g-GO loading on the thermal stability and crystallization of PET nanocomposites could be explored. As can be seen from Fig. 16, the thermal stability of PET/GO nanocomposite is basically the same as that of pure PET. The thermal stability of PET/g-GO nanocomposite is greatly improved, not only the residual rate is increased by nearly 10%, but also the maximum thermal decomposition temperature is increased by 11 °C. This is because g-GO is well dispersed in the PET polymer matrix, which in turn endows the nanocomposite with good thermal stability. As shown in Fig. 17, both two nanocomposites show higher crystallization temperature than pure PET. The crystallization temperature of PET/g-GO nanocomposite increases by about 33.8 °C, which is much higher than that of PET/GO nanocomposite. And g-G0 sheets with better dispersion play a role in heterogeneous nucleation, which could promote PET crystallization.
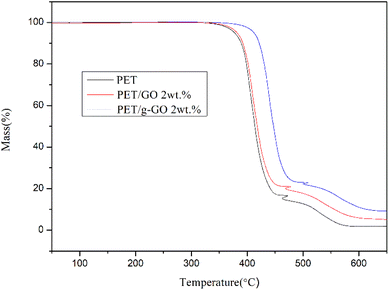 |
| | Fig. 16 TGA curves of PET, 2wt% PET/GO and 2wt% PET/g-GO nanocomposites. | |
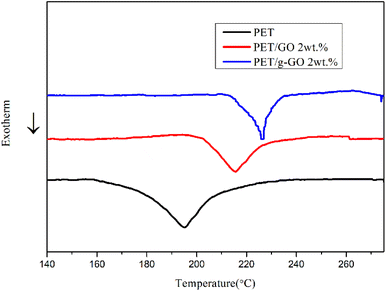 |
| | Fig. 17 DSC curves of PET, 2wt% PET/GO and 2wt% PET/g-GO nanocomposites. | |
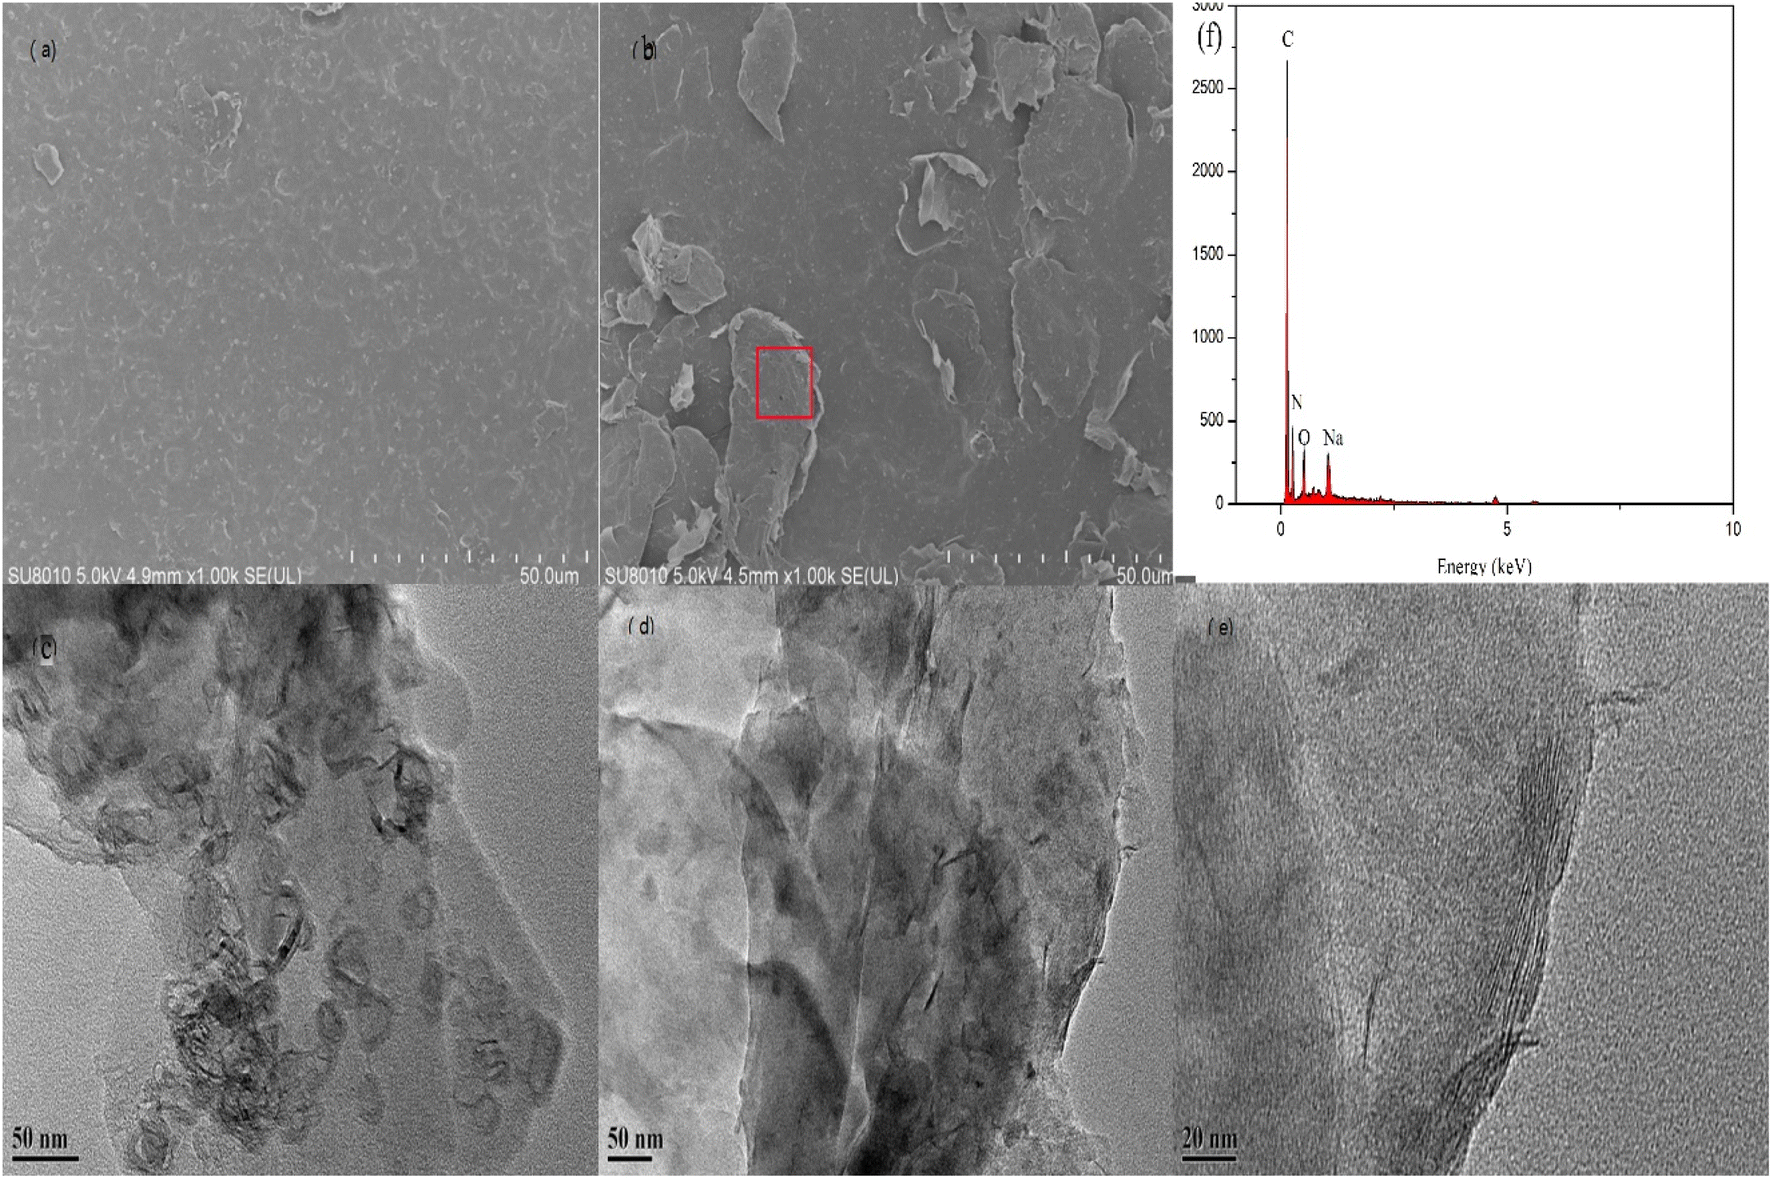
3.2.5. Study on dispersibility of PET/GO and PET/g-GO nanocomposites. As shown in Fig. 18, g-GO was uniformly dispersed in the PET matrix, while GO was agglomerated in the PET matrix. This is because compared with GO, g-GO has fewer oxygen-containing groups on the surface, and its polarity is not as strong as that of GO, making it easier to disperse in the PET matrix. The N element was found in the EDS spectra, and the C/O atomic ratio reached 4.9, which showed that PPD was successfully grafted on the surface of GO sheets, and GO was reduced to a certain extent simultaneously.
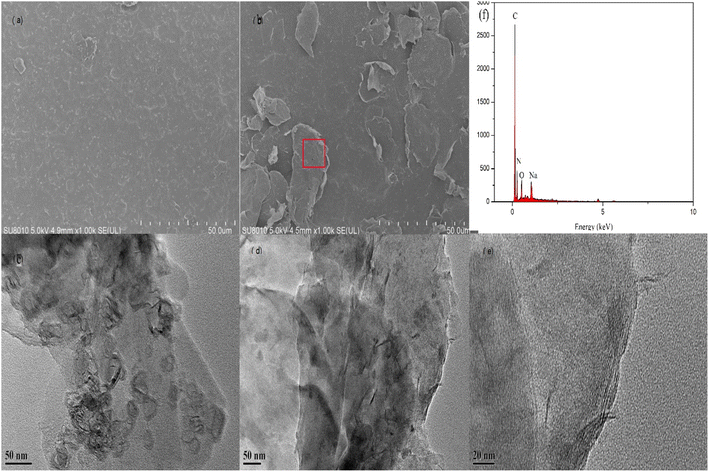 |
| | Fig. 18 SEM images of (a) 1 wt% PET/GO and (b) 1 wt% PET/g-GO nanocomposites; TEM images of (c) 1 wt% PET/GO and (d) 1 wt% PET/g-GO nanocomposites; (e) is a partial enlargement of (d) and (f) is the EDS spectrum of the area marked with red line in (b). | |
In addition, g-GO was prepared by the nucleophilic substitution reaction between the epoxy groups on the surface of GO and the amine groups of PPD. And the PPD was successfully grafted to the surface of GO, thereby making the g-GO sheets are difficult to stack, promoting their dispersion in the PET matrix.
As shown in Fig. 19, the completely exfoliated g-GO sheets are more evenly dispersed in the PET matrix, and different orientation of g-GO sheets are connected to each other, which form electrical conductive pathways. Eventually, conductive highways appear in insulated PET matrix.
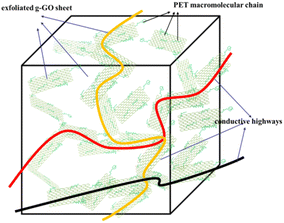 |
| | Fig. 19 The electrical conductive highways in insulated PET matrix. | |
The good dispersion of g-GO in the PET matrix promotes the formation of the conductive network, which explains the good electrical conductivity of the PET/g-GO nanocomposite.
4. Conclusions
In the present study, the GO and PET molecular chains are connected together by the two amino groups of the crosslinking agent PPD in two steps for improved antistatic and thermally stable PET/g-GO nanocomposites. The thermal stability of PET/GO is basically the same as that of pure PET. Compared with the PET/GO nanocomposite without crosslinking agent PPD, the thermal stability of PET/g-GO nanocomposite has been greatly improved. The residue rate has increased by nearly 10%, and the maximum thermal decomposition temperature has also increased by 11 °C. And g-G0 sheets with better dispersion play a role in heterogeneous nucleation, which could promote PET crystallization. When the content of g-GO is 1.0 vol%, the conductivity of the PET/g-GO nanocomposite is increased by 8 orders of magnitude, and it has good antistatic performance. However the conductivity of the PET/GO nanocomposite only improves three orders of magnitude at this content.
Conflicts of interest
There are no conflicts to declare.
Acknowledgements
The research described in this paper was financially supported by the National Natural Science Foundation of China (Grant No. 51674270), Major Science and Technology Innovation Project of Shandong Province (2019JZZY020201), Norinco Group Civilian Product Science and Technology Development Expenses Project (JM2020016), Project under 20 Policies on Promoting Collaborative Innovation and Industrialization of Achievements in Universities and Research Institutes in Jinan (2019GXRC023).
References
- Y. Zhang, Y. W. Tan, H. L. Stormer and P. Kim, Nature, 2005, 438, 201–204 CrossRef CAS.
- K. S. Novoselov, Z. Jiang, Y. Zhang, S. V. Morozov, H. L. Stormer, U. Zeitler, J. C. Maan, G. S. Boebinger, P. Kim and A. K. Geim, Science, 2007, 315, 1379 CrossRef CAS PubMed.
- C. Lee, X. Wei, J. W. Kysar and J. Hone, Science, 2008, 321, 385–388 CrossRef CAS PubMed.
- F. Liu, P. Ming and J. Li, Phys. Rev. B: Condens. Matter Mater. Phys., 2007, 76, 064120 CrossRef.
- V. Singh, D. Joung, L. Zhai, S. Das, S. I. Khondaker and S. Seal, Prog. Mater. Sci., 2011, 56, 1178–1271 CrossRef CAS.
- R. R. Nair, P. Blake, A. N. Grigorenko, K. S. Novoselov, T. J. Booth, T. Stauber, N. M. R. Peres and A. K. Geim, Science, 2008, 320, 1308 CrossRef CAS.
- V. G. Kravets, A. N. Grigorenko, R. R. Nair, P. Blake, S. Anissimova, K. S. Novoselov and A. K. Geim, Phys. Rev. B: Condens. Matter Mater. Phys., 2010, 81, 155413 CrossRef.
- K. S. Novoselov, A. K. Geim, S. V. Morozov, D. Jiang, Y. Zhang, S. V. Dubonos, I. V. Grigorieva and A. A. Firsov, Science, 2004, 306, 666–669 CrossRef CAS.
- X. Du, I. Skachko, A. Barker and E. Y. Andrei, Nat. Nanotechnol., 2008, 3, 491–495 CrossRef CAS PubMed.
- Z. Jiang, Y. Zhang, Y.-W. Tan, H. L. Stormer and P. Kim, Solid State Commun., 2007, 143, 14–19 CrossRef CAS.
- K. S. Novoselov, A. K. Geim, S. V. Morozov, D. Jiang, M. I. Katsnelson, I. V. Grigorieva, S. V. Dubonos and A. A. Firsov, Nature, 2005, 438, 197–200 CrossRef CAS PubMed.
- K. S. Novoselov, D. Jiang, F. Schedin, T. J. Booth, V. V. Khotkevich, S. V. Morozov and A. K. Geim, Proc. Natl. Acad. Sci. U. S. A., 2005, 102, 10451–10453 CrossRef CAS.
- X. Du, I. Skachko, F. Duerr, A. Luican and E. Y. Andrei, Nature, 2009, 462, 192–195 CrossRef CAS PubMed.
- P. Kim, L. Shi, A. Majumdar and P. L. McEuen, Phys. Rev. Lett., 2001, 87, 215502 CrossRef CAS PubMed.
- E. Pop, D. Mann, Q. Wang, K. Goodson and H. Dai, Nano Lett., 2005, 6, 96–100 CrossRef PubMed.
- A. A. Balandin, S. Ghosh, W. Bao, I. Calizo, D. Teweldebrhan, F. Miao and C. N. Lau, Nano Lett., 2008, 8, 902–907 CrossRef CAS PubMed.
- J. H. Seol, I. Jo, A. L. Moore, L. Lindsay, Z. H. Aitken, M. T. Pettes, X. Li, Z. Yao, R. Huang, D. Broido, N. Mingo, R. S. Ruoff and L. Shi, Science, 2010, 328, 213–216 CrossRef CAS.
- H. Wang, Q. Hao, X. Yang, L. Lu and X. Wang, Nanoscale, 2010, 2, 2164–2170 RSC.
- J. Liang, Y. Wang, Y. Huang, Y. Ma, Z. Liu, J. Cai, C. Zhang, H. Gao and Y. Chen, Carbon, 2009, 47, 922–925 CrossRef CAS.
- S. Park and R. S. Ruoff, Nat. Nanotechnol., 2009, 4, 217–224 CrossRef CAS.
- D. Cai and M. Song, J. Mater. Chem., 2010, 20, 7906–7915 RSC.
- T. Kuilla, S. Bhadra, D. Yao, N. H. Kim, S. Bose and J. H. Lee, Prog. Polym. Sci., 2010, 35, 1350–1375 CrossRef CAS.
- J. R. Potts, D. R. Dreyer, C. W. Bielawski and R. S. Ruoff, Polymer, 2011, 52, 5–25 CrossRef CAS.
- Y. Zhu and J. M. Tour, Nano Lett., 2010, 10, 4356 CrossRef CAS PubMed.
- J. S. Kim, S. Hong, D. W. Park and S. E. Shim, Macromol. Res., 2010, 18, 558–565 CrossRef CAS.
- C. Chen, W. Zhai, D. Lu, H. Zhang and W. Zheng, Mater. Res. Bull., 2011, 46, 583–587 CrossRef CAS.
- H. Bao, Y. Pan, Y. Ping, N. G. Sahoo, T. Wu, L. Li, J. Li and L. H. Gan, Small, 2011, 7, 1569–1578 CrossRef CAS.
- J. Shen, M. Shi, H. Ma, B. Yan, N. Li, Y. Hu and M. Ye, J. Colloid Interface Sci., 2010, 352, 366–370 CrossRef CAS PubMed.
- K. Liu, L. Chen, Y. Chen, J. Wu, W. Zhang, F. Chen and Q. Fu, J. Mater. Chem., 2011, 21, 8612–8617 RSC.
- R. Feng, G. Guan, W. Zhou, C. Li, D. Zhang and Y. Xiao, J. Mater. Chem., 2011, 21, 3931–3939 RSC.
- S. Aoyama, Y. T. Park, T. Ougizawa and C. W. Macosko, Polymer, 2014, 55, 2077–2085 CrossRef CAS.
- X. Zhao, B. Zheng and F. Yang, J. Zhejiang Univ., Sci., 2017, 37, 497–501 Search PubMed.
- C. Wang, R. Guo, J. Lan, L. Tan, S. Jiang and X. Cheng, J. Mater. Sci.: Mater. Electron., 2018, 29, 1–10 CrossRef CAS.
- W. S. Hummers Jr and R. E. Offeman, J. Am. Chem. Soc., 1958, 80, 1339 CrossRef.
- H. W. Kroto, J. R. Heath, S. C. O'Brien, R. F. Curl and R. E. Smalley, Nature, 1985, 318, 162–163 CrossRef CAS.
- C. Wu, X. Huang, X. Wu, R. Qian and P. Jiang, Adv. Mater., 2013, 25, 5658–5662 CrossRef CAS PubMed.
- E. R. Margine, M. L. Bocquet and X. Blase, Nano Lett., 2008, 8, 3315–3319 CrossRef CAS PubMed.
- P. Goli, H. Ning, X. Li, C. Y. Lu and A. A. Balandin, Nano Lett., 2014, 14, 1497–1503 CrossRef CAS.
- B. Liu, Y. Liu and S. Shen, Phys. Rev. B: Condens. Matter Mater. Phys., 2014, 90, 195411 CrossRef.
|
| This journal is © The Royal Society of Chemistry 2022 |
Click here to see how this site uses Cookies. View our privacy policy here. 
 Open Access Article
 This Open Access Article is licensed under a Creative Commons Attribution-Non Commercial 3.0 Unported Licence
 b,
Dianbo Zhanga,
Qun Liua,
Xiangdong Chena,
Wei Liua,
Cheng Guoa,
Zongfa Liua,
Weihua Zhong*a and
Yangchuan Ke
b,
Dianbo Zhanga,
Qun Liua,
Xiangdong Chena,
Wei Liua,
Cheng Guoa,
Zongfa Liua,
Weihua Zhong*a and
Yangchuan Ke