 Open Access Article
Mo(VI) complexes of amide–imine conjugates for tuning the selectivity of fluorescence recognition of Y(III) vs. Pb(II)†
Sudeshna Chatterjee,
Sabyasachi Ta ,
Somnath Khanra and
Debasis Das
 *
*
Department of Chemistry, The University of Burdwan, Burdwan, 713104, W.B., India. E-mail: ddas100in@yahoo.com; Fax: +91-342-2530452; Tel: +91-342-2533913, ext. 424
First published on 21st November 2022
Abstract
Two amide–imine conjugates, viz. 3-methyl-benzoic acid (4-diethylamino-2-hydroxy-benzylidene)-hydrazide (L1) and 3-methyl-benzoic acid (2-hydroxy-naphthalen-1-ylmethylene)-hydrazide (L2), have been prepared and used for a further synthesis of Mo(VI) complexes (M1 and M2, respectively). Single crystal X-ray diffraction analysis confirmed their structures. Interestingly, M1 selectively recognizes Y3+ and Pb2+ at two different wavelengths, whereas M2 selectively interacts with Y3+ with a significantly high binding constant, 1.3 × 10⁵ M−1. The proposed sensing mechanism involves the displacement of Mo(VI) by Y3+/Pb2+ from respective Mo(VI) complexes. The TCSPC experiment also substantiates the “turn-on” fluorescence process. A logic gate has been constructed utilizing the fluorescence recognition of cations by M1. DFT studies corroborated the cation–probe interactions and allowed exploring the orbital energy parameters.
Introduction
Yttrium, a mushy, luminous, and crystalline group III transition metal having similarities with lanthanides, has historically been grouped as a rare-earth metal1 and has always been found in nature along with rare-earth minerals.2 Chemically, yttrium favours lanthanides more intimately than neighbouring scandium.3,4 Yttrium isotopes are the most common products in nuclear fission. Though yttrium is found in several uranium ores, it is rarely found in a free state.5 Yttrium plays an important role in the replacement of thorium and as a catalyst for ethylene polymerization.6,7 Water-soluble yttrium compounds are toxic that affect the lungs, kidney, spleen, and liver.8 Radio-yttrium (yttrium-90, β-emitter) is used for the treatment of various cancers.9 Thus, trace-level detection and determination of yttrium are highly demanding.On the other hand, lead, the most noxious among heavy metals,10–14 causes serious health issues through contaminated food, water, and air.15,16 It affects the mucous tissues, intestines, bones, central nervous system, liver, kidney, and reproductive system. Even at very low concentrations, it disrupts the biosynthesis of haemoglobin to cause anemia.17–19 World Health Organization (WHO) has listed Pb(II) among ten elements as crucial to public health anxiety.20 Thus, precise quantification of trace level Pb(II) is also a priority. Hence, we have explored a facile, rapid, inexpensive, non-invasive method such as fluorescence for the selective detection and quantification of Y(III) and Pb(II).
Metal displacement reactions are primarily employed in organometallic synthesis and catalytic cross-coupling reactions such as Suzuki, Stille, Negishi, and Sonogashira reactions.21–35 Recently, we have employed the “metal displacement approach”36–39 for easy optical recognition of cations.
For this purpose, the design of the probe is very crucial. Recently, we have focussed on the development of Mo(VI) complexes of amide–imine conjugates. The amide functionality has received notable attention in pharmaceutical formulations for its stability, conformational diversity, and high polarity.40,41 Almost one-fourth of drug molecules and proteins contain amide as an active functional group.42
On the other hand, molybdenum is a cofactor of several enzymes, viz. nitrogenase, aldehyde oxidase, xanthine oxidase, sulphite oxidase, nitrate reductase, and xanthine dehydrogenase.43 Oxo-molybdenum(VI) complexes have interesting stereo-chemical and microelectronic properties44 having therapeutic and catalytic applications, possibly due to their switching ability amongst various oxidation states.45
As far as the literature is concerned, reports on simultaneous, selective optical recognition of Y3+ and Pb2+ are unavailable. Only a very few reports on Y3+ coordination chemistry/extraction are available.46–50 A zinc porphyrin–CONH–quinone dyad (ZnP–CONH–Q) has been reported by Fukuzumi et al. for the detection of Y3+ in toxic benzonitrile medium, having a very low association constant.51 On the other hand, optical probes for selective detection of Pb2+ are few and involve either metal–organic frameworks/rhodamine derivatives.52–55
From a practical point of view, a single sensor that shows differential response towards multiple ions is more desirable over one-to-one sensors. These facts stimulated us to search for a single probe that can selectively detect both Y3+ and Pb2+.
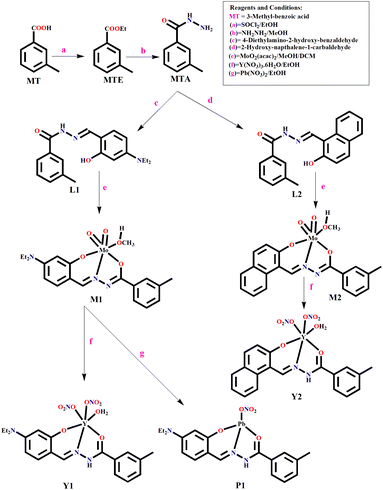
To address the lacunas and overcome the limitations, herein, we present two molecular probes, M1, capable of dual sensing Y3+ and Pb2+, whereas M2 recognizes only Y3+ in aqueous ethanol medium with improved binding constant and detection limit. Selectivity is achieved by tuning the probe backbone from substituted aniline to naphthalene (electronic control). M1 and M2 are two different molybdenum(VI) complexes of two amide–imine conjugates (L1 and L2) synthesized by condensing meta-toluic acid hydrazide (MTA) with 4-(N,N′-diethylamino)salicylaldehyde and 2-hydroxy-1-naphthaldehyde, respectively. MTA is prepared from m-toluic acid via acid chloride and subsequently reacting with hydrazine.
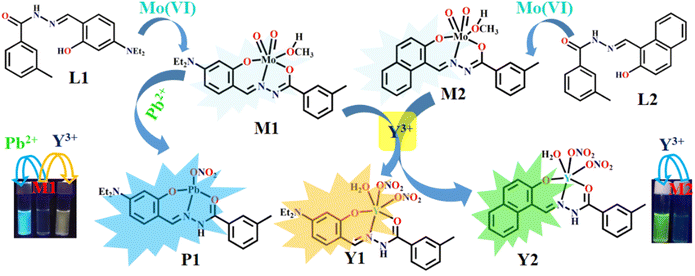
The turn on fluorescence has been achieved via the trans-metalation/metal displacement approach, leading to P1 and Y2, respectively. Kinetic studies unfold the molecular-level interaction and associated spectroscopic properties. The density functional theoretical (DFT) studies have substantiated the displacement mechanism. Emission wavelength based discrimination of Y3+ and Pb2+ using M1 allowed the development of a binary logic gate that functions as a molecular switch.
Experimental
Methods and materials
Commercial reagents like HEPES buffer, 4-N,N′-diethylamino-salicylaldehyde, 2-hydroxy-naphthaldehyde, hydrazine hydrate, and metal salts have been purchased from Sigma-Aldrich and Merck. Spectroscopic grade solvents have been used. Shimadzu FTIR (model IR Prestige 21 CE) spectrometer is used to record FTIR spectra. PerkinElmer 2400 series II CHN analyzer was used for elemental analysis. Shimadzu UV-2450 spectrophotometer with a 1 cm path length quartz cell is used to record absorption spectra. A QTOF 60 Micro YA 263 mass spectrometer is employed to measure the mass spectra in the ES positive mode. Fluorescence spectra are recorded on a Hitachi F-7000 spectrofluorimeter. A systronics digital pH meter (model 335) is used to measure the pH of the solution. A Bruker ADVANCE III HD (400 MHz) spectrometer is employed to record 1H NMR spectra in DMSO-d6 solvent. The chemical shift value (ppm) with residual solvent peak is used as an internal reference. Multiplicity is indicated as follows: s (singlet), d (doublet), t (triplet), q (quartet), and m (multiplet). Coupling constants (J, s) have been reported in Hertz (Hz). Fluorescence lifetime data have been collected by time correlated single photon counting (TCSPC) technique using FluoroCube-01-NL spectrometer using a Laser-diode (model: DD-450L-8666, typical FWHM ∼170 ps). Kinetic measurements have been carried out with an Applied Photo physics SX 17MV stopped-flow spectrophotometer (model OPT-622) in the symmetric mixing mode at 25 °C and ambient pressure.X-ray data are collected on a Bruker X8 APEX-II CCD diffractometer at 100(2) K using graphite-monochromated Mo Kα radiation (0.71073 Å) at 150 K. Data are processed and corrected for Lorentz and polarization absorption effects. Crystal structures were solved by standard direct methods using the SHELXS56 and refined by full-matrix least-squares with SHELXL57 and OLEX2,58 software. Significant crystal parameters and refinement data are presented in Table S1 (ESI).† All non-hydrogen atoms are refined with anisotropic thermal displacements. Hydrogen atoms are not included in the structure factor calculation in geometrically idealized positions, with thermal parameters depending on the parent atom, using a riding model. Images are generated by Mercury software.59
Synthesis
![[double bond, length as m-dash]](https://www.rsc.org/images/entities/char_e001.gif) O); 1585, ν(C–H, aliphatic); 1189, ν(N–N) (Fig. S1d, ESI).†
O); 1585, ν(C–H, aliphatic); 1189, ν(N–N) (Fig. S1d, ESI).†
![[double bond, length as m-dash]](https://www.rsc.org/images/entities/char_e001.gif) O); 1526, ν(C
O); 1526, ν(C![[double bond, length as m-dash]](https://www.rsc.org/images/entities/char_e001.gif) N); 1130, ν(N–N) (Fig. S2c, ESI†).
N); 1130, ν(N–N) (Fig. S2c, ESI†).![[double bond, length as m-dash]](https://www.rsc.org/images/entities/char_e001.gif) O); 1570, ν(C
O); 1570, ν(C![[double bond, length as m-dash]](https://www.rsc.org/images/entities/char_e001.gif) N); 1182, ν(N–N) (Fig. S3c, ESI†).
N); 1182, ν(N–N) (Fig. S3c, ESI†).M1: (yield, 68%), molecular formula is C20H25MoN3O5 (MW = 483.38). Anal. found, C, 49.21; H, 4.95 and N, 8.76; calcd, C, 49.70; H, 5.21 and N, 8.69. ESI-MS (m/z): [M + H]+, 486.64 (Fig. S4a, ESI†). FTIR (KBr, cm−1): 2923, ν(C–H, aromatic); 1646, ν(C![[double bond, length as m-dash]](https://www.rsc.org/images/entities/char_e001.gif) O); 1481, ν(C
O); 1481, ν(C![[double bond, length as m-dash]](https://www.rsc.org/images/entities/char_e001.gif) N); 1078, ν(N–N) (Fig. S4b, ESI†). The structure of M1 was confirmed by SC-XRD analysis.
N); 1078, ν(N–N) (Fig. S4b, ESI†). The structure of M1 was confirmed by SC-XRD analysis.
M2: (yield, 62%), molecular formula is C20H18MoN2O5 (MW = 462.31). Anal. found, C, 51.11; H, 3.25 and N, 6.39; calcd, C, 51.96; H, 3.92 and N, 6.06. ESI-MS (m/z): [M + 2H2O + H]+, 500.96 (Fig. S5a, ESI†). FTIR (KBr, cm−1): 3005, ν(C–H, aromatic); 1660, ν(C![[double bond, length as m-dash]](https://www.rsc.org/images/entities/char_e001.gif) O); 1563, ν(C
O); 1563, ν(C![[double bond, length as m-dash]](https://www.rsc.org/images/entities/char_e001.gif) N); 1175, ν(N–N) (Fig. S5b, ESI†). The structure of M2 was confirmed by SC-XRD analysis.
N); 1175, ν(N–N) (Fig. S5b, ESI†). The structure of M2 was confirmed by SC-XRD analysis.
Y1: the yield was 52%, molecular formula is C19H24N5O9Y (MW = 555.33). Anal. found, C, 42.09; H, 4.32 and N, 12.04; calcd, C, 41.09; H, 4.36 and N, 12.61. ESI-MS (m/z): [M + H2O]+, 573.0059 (Fig. S6a, ESI†) FTIR (KBr, cm−1): 3349, ν(N–H); 3154, ν(C–H, aromatic); 1646, ν(C![[double bond, length as m-dash]](https://www.rsc.org/images/entities/char_e001.gif) O); 1476, ν(C
O); 1476, ν(C![[double bond, length as m-dash]](https://www.rsc.org/images/entities/char_e001.gif) N) (Fig. S6b, ESI†).
N) (Fig. S6b, ESI†).
Y2: the yield was 64%, molecular formula is C19H17N4O9Y (MW = 534.27). Anal. found, C, 42.88; H, 3.41 and N, 10.94; calcd, C, 42.71; H, 3.21 and N, 10.49. ESI-MS (m/z): [M + 2H2O]+, 569.3079 (Fig. S7a, ESI†). FTIR (KBr, cm−1): 3491, ν(N–H); 3162, ν(C–H, aromatic); 1623, ν(C![[double bond, length as m-dash]](https://www.rsc.org/images/entities/char_e001.gif) O); 1407, ν(C
O); 1407, ν(C![[double bond, length as m-dash]](https://www.rsc.org/images/entities/char_e001.gif) N) (Fig. S7b, ESI†).
N) (Fig. S7b, ESI†).
P1: the yield was 70%, molecular formula is C19H22N4O5Pb (MW = 593.60). Anal. found, C, 38.46; H, 3.60 and N, 9.56; calcd, C, 38.44; H, 3.74 and N, 9.44. ESI-MS (m/z): [M + H]+, 595.1094 (Fig. S8a, ESI†). FTIR (KBr, cm−1): 3573, ν(N–H); 2766, ν(C–H, aromatic); 1630, ν(C![[double bond, length as m-dash]](https://www.rsc.org/images/entities/char_e001.gif) O); 1384, ν(C
O); 1384, ν(C![[double bond, length as m-dash]](https://www.rsc.org/images/entities/char_e001.gif) N). (Fig. S8b, ESI†).
N). (Fig. S8b, ESI†).
Results and discussion
X-ray diffraction analysis
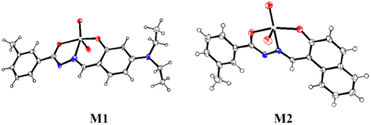
The molecular structures of M1 and M2 were confirmed by single crystal X-ray diffraction analysis. Details of crystallographic refinement parameters are provided in Table S1 (ESI).† Selected bond lengths and angles are presented in Tables S2a and b (ESI),† respectively. Both the complexes, M1 (CCDC 1941205) and M2 (CCDC 1919499), show distorted octahedral geometry having identical molecular structures (Fig. 1).In M1, bond lengths, O1–C1 (1.29(3) Å) and O2–C11 (1.34(3) Å) for phenol C–O bond and amide C–O bond are close, indicating the C–O single bond character. Thus, the C![[double bond, length as m-dash]](https://www.rsc.org/images/entities/char_e001.gif) O bond of amide in amide–imine conjugate has a single bond character after complexation with Mo(VI). A similar observation was made for the complex M2 where O2–C11 (1.342(2) Å) for phenol C–O bond and O1–C1 (1.310(2) Å) for amide C–O bond were close enough. The C
O bond of amide in amide–imine conjugate has a single bond character after complexation with Mo(VI). A similar observation was made for the complex M2 where O2–C11 (1.342(2) Å) for phenol C–O bond and O1–C1 (1.310(2) Å) for amide C–O bond were close enough. The C![[double bond, length as m-dash]](https://www.rsc.org/images/entities/char_e001.gif) N bond character is reflected from the bond length N1–C1 (1.28(3) Å) and N2–C9 (1.34(3) Å) in M1 whereas bond lengths N1–C1 (1.311(2) Å) and N2–C9 (1.294(2) Å) indicate the double bond character of CH
N bond character is reflected from the bond length N1–C1 (1.28(3) Å) and N2–C9 (1.34(3) Å) in M1 whereas bond lengths N1–C1 (1.311(2) Å) and N2–C9 (1.294(2) Å) indicate the double bond character of CH![[double bond, length as m-dash]](https://www.rsc.org/images/entities/char_e001.gif) N in M2.
N in M2.
Two oxo groups maintained a cis-geometry, with Mo![[double bond, length as m-dash]](https://www.rsc.org/images/entities/char_e001.gif) O double character in M1, Mo–O4 (1.69(2) Å) and Mo–O5 (1.727(16) Å) and M2, Mo–O3 (1.7046(15) Å) and Mo–O4 (1.6945(15) Å). Bond lengths Mo–O1 (2.012(13) Å) and Mo–O2 (1.925(15) Å) in M1 and Mo–O1 (2.0093(14) Å) and Mo–O2 (1.9286(14) Å) in M2 indicated Mo–O single bond character.
O double character in M1, Mo–O4 (1.69(2) Å) and Mo–O5 (1.727(16) Å) and M2, Mo–O3 (1.7046(15) Å) and Mo–O4 (1.6945(15) Å). Bond lengths Mo–O1 (2.012(13) Å) and Mo–O2 (1.925(15) Å) in M1 and Mo–O1 (2.0093(14) Å) and Mo–O2 (1.9286(14) Å) in M2 indicated Mo–O single bond character.
Both the complexes adopted six co-ordination including methanol as coordinating solvent. Bond angles, O2–Mo–O1 (149.8(6)°), O4–Mo–O3 (170.3(8)°) and O5–Mo–N2 (158.2(9)°) in M1 and O2–Mo–O1 (149.77(6)°), O5–Mo–O4 (171.28(6)°) and N2–Mo–O3 (155.41(7)°) in M2 reveal distorted octahedral geometries.
Spectroscopic studies
Spectroscopic recognition of Y3+ and Pb2+ along with spectroscopic properties of M1 and M2 have been thoroughly investigated.The ethanol solution of L1 absorbs at 372 nm, assigned as n–π* electronic transition. Upon addition of Mo(VI) to L1, the absorbance increases significantly with a minor blue shift to 363 nm. This intensified optical density (OD) value is due to metal bound intra-ligand charge transfer (CT) process.
Upon the addition of Y3+, the absorbance of M1 at 363 nm in EtOH/H2O (4/1, v/v) decreases significantly with the appearance of a new peak at 413 nm through an isosbestic point at 374 nm (Fig. 2a). This is due to the formation of the [L1-Y3+] adduct via the metal displacement process that consequently affects the intra-ligand charge transfer process.
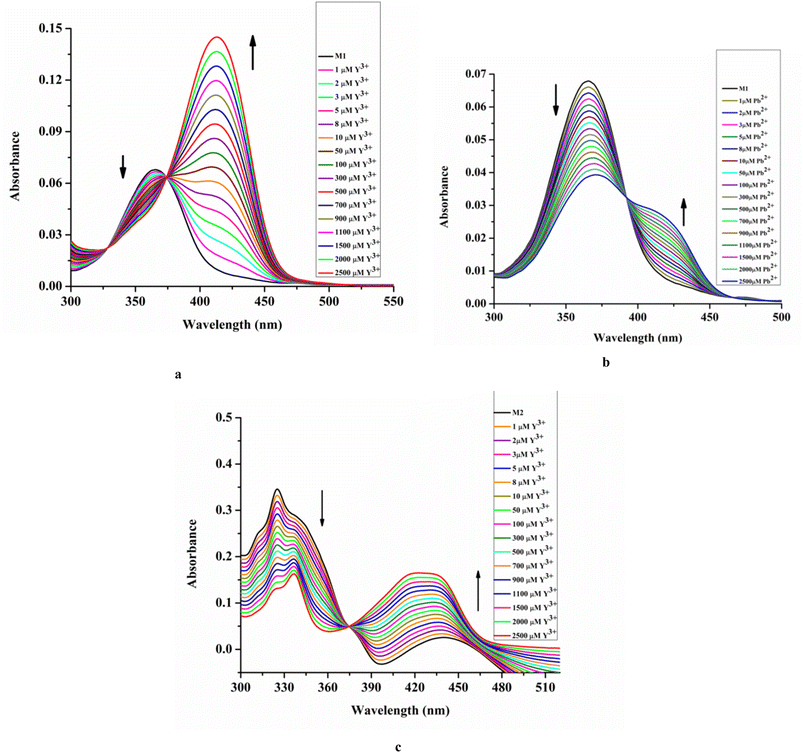 | ||
| Fig. 2 UV-vis titration: M1 (20 μM) vs. [Mn+] where Mn = Y3+ [0–2500 μM] (a) and Pb2+ [0–2500 μM] (b); M2 (20 μM) vs. [Y3+] [0–2500 μM] (c) HEPES buffered EtOH/H2O (4/1, v/v, pH 7.4). | ||
Similarly, upon the addition of Pb2+ to M1, the absorbance at 363 nm decreases with the appearance of a new peak at 426 nm with an isosbestic point at 396 nm (Fig. 2b).
On the other hand, the ethanol solution of L2 absorbs at 320 nm and 360 nm, assigned to π–π* and n–π* transitions, respectively, which are intensified and shifted to 311 nm and 440 nm, respectively, upon the addition of Mo(VI), attributed to metal bound intra-ligand charge transfer (ILCT) process, resulting in enhancement of OD value of lower wavelength peak and LMCT process for the intensified OD of higher wavelength peak.
Upon the addition of Y3+ to M2, the absorbance at a lower wavelength is reduced and shifted to 336 nm due to the change in environment. The presence of the electron rich –ONO2 group might lower the intra-ligand charge transfer process. While the absorbance at a higher wavelength increases with a blue shift to 419 nm via an isosbestic point at 375 nm due to the LMCT process (Fig. 2c).
The structural beauty of L1 having two types of functionalities, viz. imine moiety (with –NEt2 and act as donor) and amide moiety (acts as acceptor) allow intra-ligand charge transfer (ILCT) process.61 Such ILCT becomes more favourable at a particular geometry. Probably, upon complexation with metal ions, the L1 gains rigidity and appropriate geometry for the ILCT process, resulting in a change in OD values. On the other hand, for L2 devoid of donor groups like –NEt2, the ILCT is poor. Upon complexation with a suitable metal ion, the LMCT process operates, leading to a change in OD values. The absence or weak LMCT process in the case of M1 might be due to the existence of a very strong ILCT process.
It has been observed that Y3+ and Pb2+ assisted “turn on fluorescence” of M1 and Y3+ triggered fluorescence enhancement of M2 is pH sensitive and demand monitoring at different pH (pH 2.0–12.0) [Fig. S9a–c, ESI].† The optimum performance has been observed near physiological pH, 7.4, which directed us to investigate the entire spectroscopic studies at pH 7.4 (EtOH/H2O, 4/1, v/v, 10 mM HEPES buffer). It is noteworthy to mention that increasing the water percentage of aqueous ethanol reduces emission intensity.
Moreover, it has been observed that except Pb2+ and Y3+ other relevant common cations viz. Cu2+, Cr3+, Mn2+, Fe2+, Fe3+, Co2+, Ni2+, Al3, Zn2+, Ag+, Cd2+, Hg2+, La3+, Ce4+, Gd3+, Tb3+, and Dy3+ do not affect the emission intensity of M1 (λex = 410 nm) (Fig. 3a).
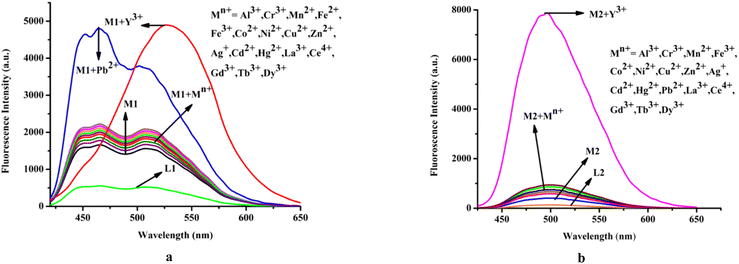 | ||
| Fig. 3 Effect of common cations on emission spectra of (a) M1 (20 μM) and (b) M2; media and pH mentioned earlier. | ||
On the other hand, steady-state emission spectra of M2 (λex = 342 nm) are affected by Y3+ while other mentioned cations remain silent (Fig. 3b).
The corresponding absorption spectroscopic studies are demonstrated in Fig. 4a and b.
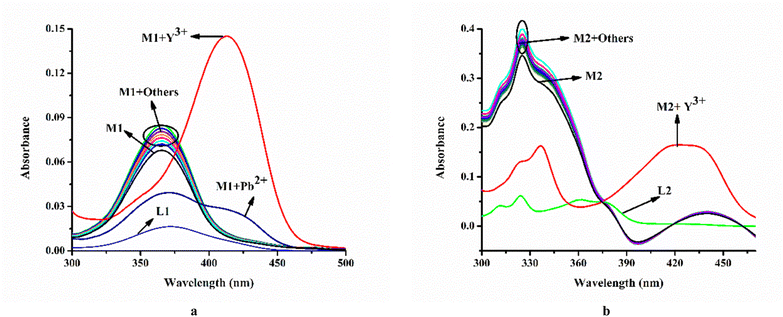 | ||
| Fig. 4 Effect of common cations on absorption spectra of (a) M1 (20 μM) and (b) M2 (20 μM); media and pH mentioned supra. | ||
In the presence of Y3+, the emission intensity of M1 changes in a ratiometric manner. Upon gradual increase of Y3+ concentration, emission intensity at 449 nm decreases while it increases significantly at 527 nm with an iso-emissive point at 468 nm (Fig. 5a). Fluorescence titration of M1 with Pb2+ results in the enhancement of emission intensity at all wavelengths viz. at 449 nm, 463 nm, and 503 nm with increasing Pb2+ concentration (Fig. 5b). Similarly, the emission intensity of M2 at 497 nm gradually enhances with increasing Y3+ concentration (Fig. 5c).
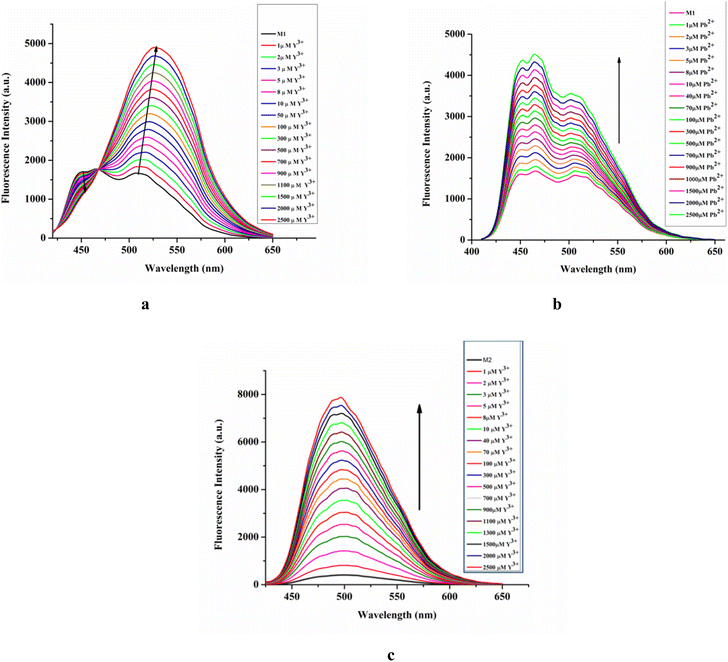 | ||
| Fig. 5 Fluorescence titration of M1 (20 μM) vs. [Y3+] (a), [Pb2+] (b), λex = 410 nm; and M2 (20 μM) vs. [Y3+], λex = 342 nm (c) media and pH mentioned supra. | ||
The selectivity of M1 towards Y3+ and Pb2+ has been tested by measuring the emission intensities of M1 in two separate mixtures containing Y3+ and Pb2+, respectively, along with various other metal ions (Fig. S10a and b, ESI).† Likewise, the selectivity of M2 for Y3+ has been verified by monitoring the emission intensity of M2 in a mixture of Y3+ and various other common metal ions (Fig. S10c, ESI†). The presence of the mentioned common cations does not interfere with the emission intensities of M1-Y3+, M1-Pb2+, and M2-Y3+ systems, pointing out the selectivity of the recognition processes. The emission intensity vs. analyte concentration plot is sigmoidal (Fig. S11a–c, ESI†), the linear regions of which allow determining the limit of detection (LOD), the values of which for M1 towards Y3+ and Pb2+ are 5.5 × 10⁻⁷ M and 26 × 10−9 M, respectively (Fig. S12a and b, ESI),† while for M2 towards Y3+ is 8.0 × 10⁻⁷ M (Fig. S12c, ESI†). The corresponding association constants for M1-Y3+, M1-Pb2+, and M2-Y3+ systems are 3.9 × 10⁴ M−1, 2.9 × 10⁴ M−1, and 1.3 × 10⁵ M−1, respectively (Fig. S13a–c, ESI).† Job's plots indicate 1![[thin space (1/6-em)]](https://www.rsc.org/images/entities/char_2009.gif) :
:![[thin space (1/6-em)]](https://www.rsc.org/images/entities/char_2009.gif) 1 stoichiometry for all the adducts viz. Y1, Y2, and P1, respectively (Fig. S14a–c, ESI).†
1 stoichiometry for all the adducts viz. Y1, Y2, and P1, respectively (Fig. S14a–c, ESI).†
Interestingly, excitation spectroscopic studies (Fig. S17a–c†) provided an understanding of the molecular level interaction between the probes and sensed cations. In the case of M1, and in the presence of Y3+ (assigned as Y1), the excitation at the emission wavelength (527 nm) results in an excitation spectrum, which is split and the complex pattern does not allow us to conclude about its aggregation. However, the excitation spectrum corresponding to the emission spectrum for the interaction of M1 with Pb2+ (assigned as P1) undergoes a red-shift by 40 nm compared to its absorption spectrum, indicating J aggregation. In the case of M2, and in the presence of Y3+ (assigned as Y2), the excitation at the emission wavelength (497 nm) results in an excitation spectrum almost identical to its absorption spectrum, indicating no aggregation.
Sensing mechanism
The weak emissions of L1 and L2 is attributed to the photo-induced electron transfer (PET) process that arises from amide–N to –CH![[double bond, length as m-dash]](https://www.rsc.org/images/entities/char_e001.gif) N– moiety. Mo(VI) triggered inhibition of both PET and –CH
N– moiety. Mo(VI) triggered inhibition of both PET and –CH![[double bond, length as m-dash]](https://www.rsc.org/images/entities/char_e001.gif) N– isomerization enhanced the rigidity leading to chelation enhanced fluorescence process (CHEF). The addition of Y3+ and/Pb2+ displaced Mo(VI) from corresponding Mo(VI) complexes leading to strong fluorescence. The fact is supported by the ESI-MS (m/z) spectra and single crystal X-ray structures of M1 and M2. Further, Y3+ and Pb2+ triggered fluorescence enhancement of M1 and M2 have been rationalized by the metal displacement process where Mo(VI) is being replaced by Y3+ and Pb2+ ions60 from their respective complexes, viz. M1 and M2 with the formation of M1-Y3+ (Y1), M1-Pb2+ (P1), and M2-Y3+ (Y2) adducts (Scheme 2). Replacement of Mo(VI) by Pb2+ from M1 leads to P1, and supported by the corresponding ESI-MS spectrum, having (m/z), [M + H]+, 595.1094. Job's plot in all three cases also corroborates these facts of 1
N– isomerization enhanced the rigidity leading to chelation enhanced fluorescence process (CHEF). The addition of Y3+ and/Pb2+ displaced Mo(VI) from corresponding Mo(VI) complexes leading to strong fluorescence. The fact is supported by the ESI-MS (m/z) spectra and single crystal X-ray structures of M1 and M2. Further, Y3+ and Pb2+ triggered fluorescence enhancement of M1 and M2 have been rationalized by the metal displacement process where Mo(VI) is being replaced by Y3+ and Pb2+ ions60 from their respective complexes, viz. M1 and M2 with the formation of M1-Y3+ (Y1), M1-Pb2+ (P1), and M2-Y3+ (Y2) adducts (Scheme 2). Replacement of Mo(VI) by Pb2+ from M1 leads to P1, and supported by the corresponding ESI-MS spectrum, having (m/z), [M + H]+, 595.1094. Job's plot in all three cases also corroborates these facts of 1![[thin space (1/6-em)]](https://www.rsc.org/images/entities/char_2009.gif) :
:![[thin space (1/6-em)]](https://www.rsc.org/images/entities/char_2009.gif) 1 product formation (Fig. S14a–c, ESI).†
1 product formation (Fig. S14a–c, ESI).†
In spite of the similar orientation and geometry of the ligand prior and post-displacement of Mo(VI), the emission profile of all the systems are different. The explanation lies in the structure of L1, where ILCT is inherent. In the emission profile of M1, among two peaks, one is associated with the CT (at a lower wavelength) and the other is for the CHEF process. The process of charge transfer is favoured by the tetrahedral geometry of P1 as compared to octahedral M1, and therefore, with the changeover of P1 from M1, both the peaks associated with CT and CHEF are enhanced. Coming to Y1, the charge transfer is disfavoured and suppressed as compared to the process of CHEF, and hence a ratiometric behaviour is observed. The lowering of the extent of charge transfer from donor to acceptor might be due to the presence of the electron rich –ONO2 group in the complex Y1, and therefore the real donor becomes a pseudo donor. Hence the mutuality between the fluorophore donor and acceptor is no longer predominant here. This is the proposed explanation of experimental observation in the context of metal displacement in M1 by Y3+ and Pb2+. For L2, there is no ILCT as described supra; intensified emission is due to the CHEF process only that operates in a more active way than compared to its parent complex, M2.
Interestingly, probe M1 is capable of dual sensing Y3+ and Pb2+, while probe M2 recognizes only Y3+.
Upon moving from phenyl to naphthalene moiety (from M1 to M2), the probe shows selectivity for Y3+ only. This fact may be rationalized in terms of the higher PET efficiency of naphthalene over the phenyl ring. This is also reflected in replacement kinetics, where we observed rapid replacement (almost instantaneous) of Mo(VI) by Pb2+ and Y3+ from M1, whereas it takes almost sixteen (16) s in the case of M2 by Y3+. The corresponding rate constants of the displacement reactions are 1.2 × 10⁸ M−1 s−1, 4.3 × 10⁸ M−1 s−1, and 6.3 × 10⁵ M−1 s−1, respectively. The slow displacement kinetics for the M2-Y3+ system probably indirectly implies higher selectivity of M2 for Y3+. In other words, the slow reactivity of M2 over M1 made it more inert than M1 and hence allowed only Y3+, but not Pb2+, to interact. The metal displacement kinetics was monitored by the stopped-flow spectrophotometric method. Changes in absorbance at 426 nm for the M1-Pb2+ system, at 413 nm for the M1-Y3+ system and at 440 nm for the M2-Y3+ system are measured as a function of time. A pseudo first order kinetic behaviour is observed in all cases (Fig. S15a–c†). The sensing interaction is further rationalized by 1HNMR titration, TCSPC, and DFT studies.
Comparison with other pioneering Y3+ and Pb2+ probes62–71
Trace level determination of Y3+ and Pb2+ using Mo(VI) complexes (M1 and M2) by fluorescence method is compared with available pioneering probes and presented in Tables S1 and S2,62–71 (ESI).† A closer look reveals that some probes may have better LOD but the method either involves fluorescence quenching, which is not at all desirable in sensing studies or toxic solvents like THF and CH3CN. The present work has used a comparatively green solvent, EtOH.1HNMR titration
The interaction of metal ions with the organic probe and resulting metal complexes have been followed through 1HNMR titration. Highly de-shielded amide proton (a) at 11.697 ppm and phenol –OH proton (b) at 11.405 ppm of L1 fully disappeared upon complexation with Mo(VI), leading to the formation of M1 (also established by single crystal X-ray structure) (Fig. S16a, ESI†). Notably, in the presence of both Y3+ and Pb2+, the peak patterns of M1 changed abruptly. New peaks appeared at 11.804 ppm and 11.878 ppm in the case of Y1 (M1-Y3+) and P1 (M1-Pb2+), respectively, similar to amide protons of L1 (a1), supporting the proposed mechanism.A similar observation was found for M2 (Fig. S16b, ESI†) upon interaction with Y3+.
Highly de-shielded amide proton (a′) at 12.733 ppm and phenol –OH proton (b′) at 12.115 ppm of L2 disappeared upon complexation with Mo(VI), whereas the a′ proton reappeared at 12.714 ppm during trans-metallation of Mo(VI) by Y3+.
Time correlated single photon counting studies (TCSPC studies)
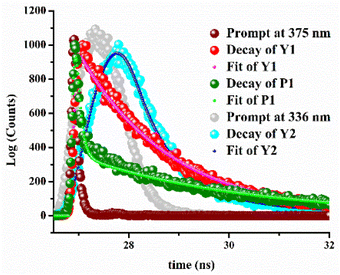
The fluorescence life time decay experiment also corroborates the cation–probe interaction. Weakly fluorescent M1 shows a characteristic decay profile in the presence of Y3+, Pb2+, while similar observation has been found for M2 upon interaction with Y3+ at their respective emission wavelengths (Fig. 6). The average life time (τ) of adduct Y1, P1, and Y2 are 1.73 ns, 3.35 ns, and 2.33 ns, respectively. The time-resolved fluorescence life time data are presented in Table 1.| Species | B1 | B2 | τ1 (ns) | τ1 (ns) |
|---|---|---|---|---|
| Y1 | 82.55 | 17.45 | 0.026 | 1.83 |
| P1 | 10.26 | 89.74 | 0.089 | 3.33 |
| Y2 | 76.27 | 23.73 | 0.756 | 3.44 |
Theoretical studies
To explore the underlying energy parameters of different frontier molecular orbitals involved in the process of probe-analyte interaction, density functional theoretical (DFT) studies have been performed with the L1, L2, M1, M2, Y1, Y2, and P1 complexes/adducts using the basis set TD-SCF/DFT/B3LYP/SDD. The energy gap between the highest occupied molecular orbital (HOMO) and lowest unoccupied molecular orbitals (LUMO) for L1, L2, and M1, M2, Y1, P1, and Y2 are shown in Fig. 7a and b, respectively. The HOMO–LUMO energy gaps in L1 and L2 are 0.04616 eV and 0.09488 eV, respectively, where the HOMO–LUMO energy gaps in M1 and M2 decrease to 0.03079 eV and 0.02278 eV. The corresponding values in M1-Y3+ and M1-Pb2+ are 0.02738 eV and 0.01783 eV, respectively, indicating the stability of Y1 and P1. The corresponding value for M2-Y3+ (Y2) adduct is 0.01944 eV. Here, a slightly decreased energy gap of M1 with respect to L1 has been shown. However, the addition of Y3+ and Pb2+ to M1 lowers the energy gap and is associated with a red shift, matching the experimental findings with theoretical values. In the case of M2, the energy gap decreased with respect to L2, which indicates the red shift of the absorption peak and clearly supports the experimental findings. The addition of Y3+ to M2 also lowers the energy gap. Here, some anomalous behaviour of the absorption peak of M1 with respect to L1 has been observed where a blue shift occurs with a decrease in the energy gap. This type of mismatch of theoretical observation does not result in a less stable complex.72–75 Fig. 7a and b also represent the electronic distribution in all the orbitals, which are in agreement with spin allowed electronic transition.In the case of HOMO of L1 and L2, the electron density is localized on benzene moiety and additionally along within the –NEt2 group in L1. M1's as well as M2's HOMO shows a distribution of electron density towards the aromatic moiety mainly, whereas their LUMO electron density is totally confined on metal bound centres. Y1 represents the transition of electron density from salicylaldehyde moiety (HOMO) to all over the complexes, especially up to the metal centre (LUMO). The HOMO of P1 restricted the electron density to the metal bound centre where the electron density was distributed to the imine centre along with meta toluic acid moiety of P1's LUMO.
Looking at the HOMO of M1, where the electron density is distributed in a dispersed way, the displacement of Mo(VI) by Pb2+ yields P1, which displays almost a homogeneous distribution of charge over the entire molecule. This outcome must be correlated with a strong operation of the CT process, as described earlier in the spectroscopic investigation. Interestingly, the ratiometric behaviour as obtained from the spectroscopy can also be interpreted with these MOs. In Y1, the distribution of charge, even in a dispersed way, no longer exists, and it might be due to the completely arrested CT process. Therefore, activation of the CHEF process along with this CT inhibition results in ratiometric behaviour.
Now Y2, where the distribution is only due to CHEF activation, shows a much greater electron density than M2. This indicates the intensified absorption/emission during the displacement of Mo(VI) by Y3+ from M2. Moreover, Y2's HOMO cramped the electron density in naphthalene moiety, which gets transferred to the metal bound co-ordination zone of Y2's LUMO. Such flow of electron density is associated with the charge transfer related electronic transition. All the above facts partially support the experimental findings.
Logic gate behaviour
The emission behaviour of M1 at 463 nm and 527 nm in the presence of Pb2+ and Y3+ may be presented through “OR” logic gates (Fig. 8). By considering Pb2+ and Y3+ as input function and assuming turn on fluorescence as output (λem = 463 nm/527 nm) we can employ M1 for the construction of a binary logic gate. In the case of input, “absence and presence” are denoted as “0” and “1”, respectively, whereas for output, the allocations are “0” and “1” for weak and strong emissions, respectively. Truth table is shown in Table 2.| Input 1 (Pb2+) | Input 2 (Y3+) | Output (λem = 463 nm/527 nm) |
|---|---|---|
| 0 | 0 | 0 |
| 0 | 1 | 1 |
| 1 | 0 | 1 |
| 1 | 1 | 1 |
Conclusion
Two Mo(VI) complexes of amide–imine conjugate have been employed for selective recognition of Y3+ and Pb2+. Y3+ and Pb2+ easily displace Mo(VI) from weakly fluorescent metal complex, M1 whereas Mo(VI) is quickly displaced by Y3+ in M2. In the presence of Y3+ and Pb2+, M1 emits yellow and blue light, respectively, while M2 selectively interacts with Y3+ to emit green fluorescence. The proposed sensing mechanism is based on the metal displacement protocol that has been substantiated by several spectroscopic and analytical techniques. Moreover, DFT studies established the stability of the resultant adducts, Y1, P1, and Y2, over respective Mo(VI) complexes.Conflicts of interest
There are no conflicts to mention.Acknowledgements
SC thanks DST-Inspire, New Delhi, for a fellowship. Financial assistance from CSIR, New Delhi, is greatly acknowledged by SK. We extend our thanks to Prof. Nikhil Guchhait, University of Calcutta, for the TCSPC experimental facility.References
- N. G. Connelly, T. Damhus, R. M. Hartshorn and A. T. Hutton, Nomenclature of Inorganic Chemistry, IUPAC Recommendations, RSC Publishing, 2005, p. 51 Search PubMed.
- J. Emsley, Nature's Building Blocks: An A–Z Guide to the Elements, Oxford University Press, 2001, pp. 495–498 Search PubMed.
- C. A. Hampel, The Encyclopaedia of the Chemical Elements, Reinhold Book Corporation, New York, 1968, pp. 810–821 Search PubMed.
- N. N. Greenwood and A. Earnshaw, Chemistry of the Elements, Butterworth-Heinemann, Oxford, 2nd edn, 1997 Search PubMed.
- C. R. Hammond, The Elements, Fermi National Accelerator Laboratory, 1985, pp. 4–33 Search PubMed.
- N. S. MacDonald, R. E. Nusbaum and G. V. Alexander, J. Biol. Chem., 1952, 195(2), 837–841 CrossRef PubMed.
- G. P. Adams, C. C. Shaller, E. Dadachova, H. H. Simmons, E. M. Horak, A. Tesfaye, A. J. P. Klein-Szanto, J. D. Marks, M. W. Brechbiel and L. M. Weiner, Cancer Res., 2004, 64(17), 6200–6206 CrossRef PubMed.
- A. Forssén, Ann. Acad. Sci. Fenn., Ser. A, 1974,(163), 1–4 Search PubMed.
- G. P. Adams, Cancer Res., 2004, 64, 6200–6206 CrossRef PubMed.
- S. Raj and D. R. Shankaran, Sens. Actuators, B, 2016, 226, 318–325 CrossRef CAS.
- Y. Shang, Y. Zhang, P. Li, J. Lai, X. Y. Kong, W. Liu, K. Xiao, G. Xie, Y. Tian and L. Wen, Chem. Commun., 2015, 51, 5979–5981 RSC.
- J. Liu and Y. Lu, J. Am. Chem. Soc., 2003, 125, 6642–6643 CrossRef CAS.
- J. Y. Kwon, Y. J. Jang, Y. J. Lee, K. M. Kim, M. S. Seo, W. Nam and J. Yoon, J. Am. Chem. Soc., 2005, 127, 10107–10111 CrossRef CAS.
- Y. Q. Wen, C. Peng, D. Li, L. Zhuo, S. He, L. Wang, Q. Huang, Q. H. Xu and C. Fan, Chem. Commun., 2011, 47, 6278–6280 RSC.
- M. Vazquezgonzalez and C. Carrillocarrion, J. Biomed. Opt., 2014, 19, 101503 CrossRef.
- B. Sharma, S. Singh and N. J. Siddiqi, BioMed Res. Int., 2014, 2014, 640754 Search PubMed.
- G. Aragay, J. Pons and A. Merkoçi, Chem. Rev., 2011, 111, 3433–3458 CrossRef CAS.
- H. Wang, Y. Kim, H. Liu, Z. Zhu, S. Bamrungsap and W. Tan, J. Am. Chem. Soc., 2009, 131, 8221–8226 CrossRef CAS PubMed.
- B. Gu, L. Huang, N. Mi, P. Yin, Y. Zhang, X. Tu, X. Luo, S. Luo and S. Yao, Analyst, 2015, 140, 2778–2784 RSC.
- J. A. Cotruvo, J.–Am. Water Works Assoc., 2017, 109, 44–51 CrossRef.
- G. A. Molander and F. Dehmel, J. Am. Chem. Soc., 2004, 126, 10313–10318 CrossRef.
- J. W. B. Cooke, R. Bright, M. J. Coleman and K. P. Jenkins, Org. Process Res. Dev., 2001, 5, 383–386 CrossRef.
- M. M. Gillett-Kunnath, J. G. MacLellan, C. M. Forsyth, P. C. Andrews, G. B. Deacon and K. Ruhlandt-Senge, Chem. Commun., 2008, 37, 4490–4492 RSC.
- M. Lalonde, W. Bury, O. Karagiaridi, Z. Brown, J. T. Hupp and O. K. Farha, J. Mater. Chem. A, 2013, 1, 5453–5468 RSC.
- Y. A. Wanniarachchi, M. A. Khan and L. G. M. Slaughter, Organometallics, 2004, 23, 5881–5884 CrossRef CAS.
- L. S. Felices, E. C. Escudero-Adán, J. Benet-Buchholz and A. W. Kleij, Inorg. Chem., 2009, 48, 846–853 CrossRef PubMed.
- S. Akine, S. Sairenji, T. Taniguchi and T. Nabeshima, J. Am. Chem. Soc., 2013, 135, 12948–12951 CrossRef CAS.
- Y. Lou, Y. Zhao, J. Chen and J. J. Zhu, J. Mater. Chem. C, 2014, 2, 595–613 RSC.
- P. Wu, T. Zhao, S. Wang and X. Hou, Nanoscale, 2014, 6, 43–64 RSC.
- J. Rocha, L. D. Carlos, F. A. A. Paz and D. Ananias, Chem. Soc. Rev., 2011, 40, 926–940 RSC.
- R. Xing, X. Wang, C. Zhang, J. Wang, Y. Zhang, Y. Song and Z. Guo, J. Mater. Chem., 2011, 21, 11142–11149 RSC.
- A. C. Gyorkos, J. K. Stilleand and L. S. Hegedus, J. Am. Chem. Soc., 1990, 112, 8465–8472 CrossRef.
- R. Cini, S. Defazio, G. Tamasi, M. Casolaro, L. Messori, A. Casini, M. Morpurgo and M. Hursthouse, Inorg. Chem., 2007, 46, 79–92 CrossRef.
- Y. Zhu, E. Kockrick, T. Ikoma, N. Hanagata and S. Kaskel, Chem. Mater., 2009, 21, 2547–2553 CrossRef.
- P. Horcajada, C. Serre, G. Maurin, N. A. Ramsahye, F. Balas, M. Vallet-Regí, M. Sebban, F. Taulelle and G. Férey, J. Am. Chem. Soc., 2008, 130, 6774–6780 CrossRef CAS PubMed.
- W. Plass and J. G. Verkade, J. Am. Chem. Soc., 1992, 114, 2275–2276 CrossRef CAS.
- E. C. Escudero-Adán, J. Benet-Buchholz and A. W. Kleij, Inorg. Chem., 2007, 46, 7265–7267 CrossRef.
- I. Majumder, P. Chakraborty, S. Dasgupta, C. Massera, D. Escudero and D. Das, Inorg. Chem., 2017, 56, 12893–12901 CrossRef CAS.
- M. R. Maurya, S. Dhaka and F. Avecilla, Polyhedron, 2014, 67, 145–159 CrossRef CAS.
- G. Arthur, Biochemistry and Materials Science, Wiley-Inter Science, 2000 Search PubMed.
- J. M. Humphrey and A. R. Chamberlin, Chem. Rev., 1997, 97, 2243–2266 CrossRef PubMed.
- X. Liu, L. Lin and X. Feng, Chem. Commun., 2009, 6145–6158 RSC.
- S. Ta, M. Ghosh, N. Salam, S. Ghosh, P. Brandão, V. Félix, S. K. Hira, P. P. Manna and D. Das, ACS Appl. Bio Mater., 2019, 2, 3964–3973 CrossRef PubMed.
- S. Ta, M. Ghosh, K. Ghosh, P. Brandão, V. Félix, S. K. Hira, P. P. Manna and D. Das, ACS Appl. Bio Mater., 2019, 2, 2802–2811 CrossRef PubMed.
- M. Banerjee, S. Ta, M. Ghosh and A. G. D. Das, ACS Omega, 2019, 4, 10877–10890 CrossRef CAS PubMed.
- J. M. C. Pavbn, M. E. U. Pozo, A. G. de Torres and C. B. Ojeda, Analyst, 1988, 113(8), 1291–1294 RSC.
- L. Li, M. de G. J. Peláez, E. A. Sarduy, X. Wang, T. E. Barnhart, W. Cai, V. Radchenko, P. Schaffer, J. W. Engle and C. Orvig, Dalton Trans., 2020, 49, 5547–5562 RSC.
- N. Koslowski, R. C. Hoffmann, V. Trouillet, M. Bruns, S. Foro and J. J. Schneider, RSC Adv., 2019, 9, 31386–31397 RSC.
- D. F. Wood and M. R. Adams, Analyst, 1970, 95, 556–561 RSC.
- Y. Shen, W. Li, J. Wu, S. Li, H. Luo, S. Dai and W. Wu, Dalton Trans., 2014, 43(26), 10023–10032 RSC.
- K. Okamoto and S. Fukuzumi, J. Am. Chem. Soc., 2004, 126(43), 13922–13923 CrossRef CAS.
- R. Zhou, B. Li, N. Wu, G. Gao, J. You and J. Lan, Chem. Commun., 2011, 47, 6668–6670 RSC.
- J. Yang, C. Zhou, C. Liu, Y. Li, H. Liu, Y. Li and D. Zhu, Analyst, 2012, 137, 1446–1450 RSC.
- M. Liu, X. Lou, J. Du, M. Guan, J. Wang, X. Ding and J. Zhao, Analyst, 2012, 137, 70–72 RSC.
- Z. E. Jacobi, L. Li and J. Liu, Analyst, 2012, 137, 704–709 RSC.
- M. C. Burla, R. Caliandro, M. Camalli, B. Carrozzini, G. L. Cascarano, L. De Caro, C. Giacovazzo, G. Polidori and R. Spagna, J. Appl. Crystallogr., 2005, 38, 381–388 CrossRef CAS.
- G. M. Sheldrick, Acta Crystallogr., Sect. E: Struct. Rep. Online, 2008, 64, 112–122 CAS.
- G. M. Sheldrick, Acta Crystallogr., Sect. A: Found. Crystallogr., 2015, 71, 3–8 CrossRef.
- O. V. Dolomanov, L. J. Bourhis, R. J. Gildea, J. A. K. Howard and H. Puschmann, J. Appl. Crystallogr., 2009, 42, 339–341 CrossRef CAS.
- J. Cheng, X. Zhou and H. Xiang, Analyst, 2015, 140, 7082 RSC.
- A. Vogler and H. Kunkely, Coord. Chem. Rev., 2007, 251, 577–583 CrossRef CAS.
- J. M. C. Pavón, M. E. U. Pozo, A. G. de Torres and C. B. Ojeda, Analyst, 1988, 113(8), 1291–1294 RSC.
- G. Ghodake, S. Shinde, R. G. Saratale, A. Kadam, G. D. Saratale and D. Y. Kim, Colloids Surf., B, 2019, 183, 110436 CrossRef.
- D. Zhang, Z. Zang, X. Zhou, Y. Zhou, X. Tang, R. Wei and W. Liu, Inorg. Chem. Commun., 2009, 12, 1154–1156 CrossRef.
- M. Shen, C. M. Li, D. Na, Z. Q. Hao, X. Y. Li, L. B. Guo, Y. F. Lu and X. Y. Zeng, J. Anal. At. Spectrom., 2018, 33, 658–662 RSC.
- D. F. Wood and M. R. Adams, Analyst, 1970, 95(1131), 556–561 RSC.
- X. Meng, D. Cao, Z. Hu, X. Han, Z. Li and W. Ma, RSC Adv., 2018, 8(59), 33947–33951 RSC.
- F. Zapata, A. Caballero, A. Espinosa, A. Tárraga and P. Molina, J. Org. Chem. Res., 2009, 74(13), 4787–4796 CrossRef CAS PubMed.
- A. K. Shaily, I. Parveen and N. Ahmed, Luminescence, 2018, 33, 713–721 CrossRef PubMed.
- A. Thakur, D. Mandal and S. Ghosh, Anal. Chem., 2013, 85(3), 1665–1674 CrossRef CAS.
- J. Yang, C. Zhou, C. Liu, Y. Li, H. Liu, Y. Li and D. Zhu, Analyst, 2012, 137(6), 1446–1450 RSC.
- Z. Li, W. Chen, L. Dong, Y. Song, R. Li, Q. Li, D. Qu, H. Zhang, Q. Yang and Y. Lia, New J. Chem., 2020, 44, 3261–3267 RSC.
- K. C. Song, H. Kim, K. M. Lee, Y. Sup Lee, Y. Do and M. H. Lee, Sens. Actuators, B, 2013, 176, 850–857 CrossRef CAS.
- S. Sinha, B. Chowdhury and P. Ghosh, Inorg. Chem., 2016, 55, 9212–9220 CrossRef CAS.
- J. Wu, W. Liu, J. Ge, H. Zhang and P. Wang, Chem. Soc. Rev., 2011, 40, 3483–3495 RSC.
Footnote |
| † Electronic supplementary information (ESI) available: Contains ESI-MS, NMR, FTIR, UV-vis, fluorescence spectra, and single crystal X-ray data. CCDC 1941205 and 1919499. For ESI and crystallographic data in CIF or other electronic format see DOI: https://doi.org/10.1039/d2ra06035c |
| This journal is © The Royal Society of Chemistry 2022 |

