 Open Access Article
Selective sensing of adenosine monophosphate (AMP) by a calix[6]triazolium-based colorimetric sensing ensemble†
Jihee Cho and
Sanghee Kim
 *
*
College of Pharmacy, Seoul National University, 1 Gwanak-ro, Gwanak-gu, Seoul 08826, Korea. E-mail: pennkim@snu.ac.kr
First published on 15th November 2022
Abstract
Since adenosine monophosphate (AMP) is closely related to many diseases, the measurement of AMP is important for the diagnosis and treatment of related diseases. Among the AMP sensors reported thus far, sensors that selectively recognize AMP, not ADP or ATP, are rare, and complex experimental procedures and additional instruments are required for AMP recognition. We developed a colorimetric chemosensor using calix[6]triazolium (CT6) and intended to use it for the simple and rapid detection of AMP. Colorimetric AMP detection was established through an indicator displacement assay (IDA) in which CT6 and Brooker's merocyanine (BM) were used as receptors and indicators, respectively. The change in the absorption spectrum and color of BM showed that the binding affinity of CT6 to AMP conferred high selectivity to the developed colorimetric chemosensor. The developed IDA-based chemosensor was extended to fabricate a paper-based colorimetric device for visual measurement, and the paper-based device exhibited a selective response to AMP through a definite color change from yellow to magenta. This paper-based colorimetric device shows growth potential for onsite visual measurement of AMP.
Introduction
The development of artificial receptors that can selectively recognize phosphate anions has attracted great interest in supramolecular chemistry because they play critical roles in a wide range of biological processes.1 Among various biological phosphates, adenosine mono-, di- and triphosphate (AMP, ADP and ATP) are the essential biomolecules, and each has unique functions.2 AMP, the most fundamental nucleotide, is converted to ADP and ATP by binding with inorganic phosphates during intracellular metabolism. AMP is involved in the regulation of various enzymatic reactions and is a major cellular metabolite that regulates signal transduction and energy homeostasis.3 The level of AMP in cells is closely related to various diseases. Although many chemosensors for AMP have been reported,4 chemosensors that selectively recognize AMP over ADP and ATP are rare.5 In addition, complex experimental procedures and extra equipment are required for AMP recognition.The indicator displacement assay (IDA) has been widely applied in supramolecular systems to detect various anions.6 The IDA-based colorimetric sensing system7 enables the detection of target molecules with the naked eye. Thus, it offers several advantages, such as fast response and simple operation, and does not require expensive analysis equipment. To the best of our knowledge, IDA-based colorimetric systems for the selective detection of AMP over ADP and ATP through distinct color changes have not yet been developed.
Macrocyclic host molecules (MHMs) are ideal receptors for IDA because of their ability to form inclusion complexes with guests.8 MHMs have preorganized cavities and unique geometries that enhance recognition and selectivity for guest molecules. Recently, various types of MHMs composed of repeating aromatic heterocycles such as imidazolium, pyridinium and triazolium have been reported, and they exhibit distinctive features and recognition ability.9,10a Several research groups, including our group, have developed macrocyclic receptors containing 1,2,3-triazolium for anion recognition.10 The binding properties of triazolium are somewhat different from those of the corresponding 1,2,3-triazole. The anionic binding affinity of triazolium is strongly increased compared to that of triazole because of the cationic character of the former. In addition, the possible anion–π interaction of 1,2,3-triazolium is another important force in the recognition of anionic molecules.11 Recently, our group synthesized calix[n]triazolium composed of multiple triazolium groups.10a With this macrocycle, we developed an IDA-based fluorescence-sensing system for the selective detection of AMP. Based on our previous study, we decided to develop a colorimetric chemosensor for AMP.
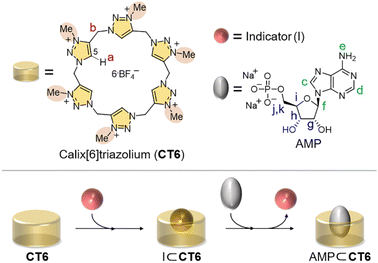
Herein, we report our new macrocyclic detection system for AMP through a color change. Among our calix[n]triazoliums (n = 4–6), we selected calix[6]triazolium (CT6, Fig. 1)10a because it displays the best sensitivity to AMP. Brooker's merocyanine (BM) was chosen as a colorimetric indicator, and it is known to form a complex with heterocalixarene.12 Our first working hypothesis is that the color of BM changes when a complex is formed with CT6. The next hypothesis is that if the interaction of AMP with CT6 is strong enough to displace BM in the CT6/BM ensemble, it will restore the color of the original BM solution.
Results and discussion
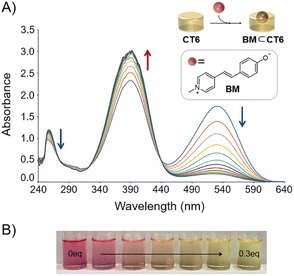
We first examined whether the formation of the CT6/BM complex resulted in a color change. The complexation studies and colorimetric properties of the CT6/BM complex were studied using UV-Vis spectroscopy. As shown in Fig. 2A, BM has absorbance peaks at 256, 392 and 530 nm in DMSO![[thin space (1/6-em)]](https://www.rsc.org/images/entities/char_2009.gif) :
:![[thin space (1/6-em)]](https://www.rsc.org/images/entities/char_2009.gif) H2O (5
H2O (5![[thin space (1/6-em)]](https://www.rsc.org/images/entities/char_2009.gif) :
:![[thin space (1/6-em)]](https://www.rsc.org/images/entities/char_2009.gif) 1) solution. As the concentration of CT6 increased, the absorbance of BM at 256 and 530 nm gradually decreased, while the absorbance at 392 nm gradually increased. The color of the solution changed from magenta to yellow (Fig. 2B). Isotropic points were observed at 322 and 438 nm, indicating that BM was complexed with CT6. When a hydrogen bond donor (HBD) solvent is added to the BM solution, the hypsochromic shift of the absorbance peak of BM appears due to the hydrogen bond interaction between the OH of the HBD solvent and the phenolate of BM.13 Therefore, the hypsochromic shift of the absorbance peak of BM by the addition of CT6 suggests that the CT6/BM complex is formed by hydrogen bonding interactions between CT6 and the phenolate donor of BM. The binding stoichiometric ratio of the CT6/BM complex was determined to be 1
1) solution. As the concentration of CT6 increased, the absorbance of BM at 256 and 530 nm gradually decreased, while the absorbance at 392 nm gradually increased. The color of the solution changed from magenta to yellow (Fig. 2B). Isotropic points were observed at 322 and 438 nm, indicating that BM was complexed with CT6. When a hydrogen bond donor (HBD) solvent is added to the BM solution, the hypsochromic shift of the absorbance peak of BM appears due to the hydrogen bond interaction between the OH of the HBD solvent and the phenolate of BM.13 Therefore, the hypsochromic shift of the absorbance peak of BM by the addition of CT6 suggests that the CT6/BM complex is formed by hydrogen bonding interactions between CT6 and the phenolate donor of BM. The binding stoichiometric ratio of the CT6/BM complex was determined to be 1![[thin space (1/6-em)]](https://www.rsc.org/images/entities/char_2009.gif) :
:![[thin space (1/6-em)]](https://www.rsc.org/images/entities/char_2009.gif) 1 by the UV-Vis Job plot method (Fig. S2†). The stoichiometry determined through BindFit calculation was also 1
1 by the UV-Vis Job plot method (Fig. S2†). The stoichiometry determined through BindFit calculation was also 1![[thin space (1/6-em)]](https://www.rsc.org/images/entities/char_2009.gif) :
:![[thin space (1/6-em)]](https://www.rsc.org/images/entities/char_2009.gif) 1, and the binding constant of the 1
1, and the binding constant of the 1![[thin space (1/6-em)]](https://www.rsc.org/images/entities/char_2009.gif) :
:![[thin space (1/6-em)]](https://www.rsc.org/images/entities/char_2009.gif) 1 binding model was calculated to be 40
1 binding model was calculated to be 40![[thin space (1/6-em)]](https://www.rsc.org/images/entities/char_2009.gif) 402.24 ± 5250 M−1 (Fig. S3–S5 and Table S1†).
402.24 ± 5250 M−1 (Fig. S3–S5 and Table S1†).
The complexation of CT6 with BM was also further evaluated by 1H NMR studies (Fig. 3 and S1†). When CT6 was gradually added to BM, all four sets of aromatic protons (Ha′, Hb′, Hd′ and He′) and two sets of alkene protons (Hc′ and Hc′′) in BM shifted downfield, indicating an intimate interaction between CT6 and BM.
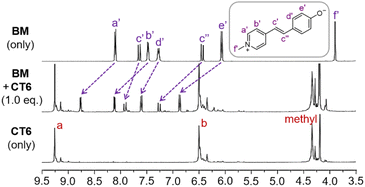 | ||
| Fig. 3 1H NMR spectra of BM (1.5 mM) in DMSO-d6 and with CT6 (1.0 equiv.). The positions of the labeled protons in CT6 are marked in Fig. 1. | ||
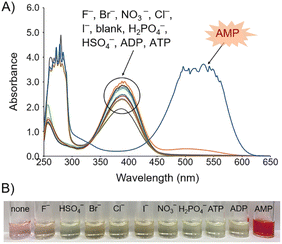
We next examined whether AMP displaces BM in the CT6/BM ensemble. When AMP was added to the CT6/BM complex, a significant change was observed in the absorption spectrum (Fig. 4A), and the color of the solution changed from yellow to magenta (Fig. 4B). In contrast, the addition of other anions of the same concentration (such as sodium salts, F−, Cl−, Br−, I−, H2PO4−, NO3−, HSO4−, ADP or ATP) did not significantly affect the absorption spectrum of the CT6/BM complex and did not induce the color change (Fig. 4A and B). In particular, other adenine nucleotides, ADP and ATP, did not cause any notable changes in the CT6/BM complex.
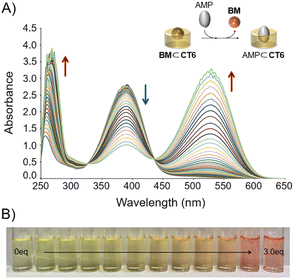
A titration experiment was performed to determine the binding properties of the CT6/BM complex to AMP. As shown in Fig. 5A, when AMP was gradually added to the CT6/BM complexes, the absorbance peak at 392 nm gradually decreased, while the absorbance peaks at 256 and 530 nm gradually increased. It also showed a gradual color change from yellow to magenta (Fig. 5B). Isotropic points were observed at 328 and 438 nm. These observations suggested that BM bound to CT6 was released in an AMP-dependent manner. As a result of the BindFit calculation performed using UV-Vis titration of the CT6/BM complex with AMP, the stoichiometry was determined to be 1![[thin space (1/6-em)]](https://www.rsc.org/images/entities/char_2009.gif) :
:![[thin space (1/6-em)]](https://www.rsc.org/images/entities/char_2009.gif) 1, and the binding constant of the 1
1, and the binding constant of the 1![[thin space (1/6-em)]](https://www.rsc.org/images/entities/char_2009.gif) :
:![[thin space (1/6-em)]](https://www.rsc.org/images/entities/char_2009.gif) 1 binding model was calculated to be 2808.94 ± 54 M−1 (Fig. S6–S8 and Table S2†). In addition, the UV-Vis limit of detection (LOD) for AMP of the CT6/BM complex was determined to be 30 nM, which is significantly lower than the values reported for other AMP sensors (Fig. S9†).5e,14,15
1 binding model was calculated to be 2808.94 ± 54 M−1 (Fig. S6–S8 and Table S2†). In addition, the UV-Vis limit of detection (LOD) for AMP of the CT6/BM complex was determined to be 30 nM, which is significantly lower than the values reported for other AMP sensors (Fig. S9†).5e,14,15
Our previous experiments of 1H NMR titration10a revealed that triazolium C5 proton (Ha) of CT6 and protons (Hg–k) adjacent to the phosphate group of AMP shifted downfield, while adenine protons (Hc–e) and proton (Hf) adjacent to adenine tended to move upfield (Fig. S10†). This result implied that the binding between CT6 and AMP occurs via hydrogen bonding of triazolium C5–H with phosphate group as well as cation–π interaction between the triazolium ring and the adenine base. In addition to this, we performed 2D NOESY analysis (Fig. S11†). NOESY spectra of AMP were recorded in the presence of CT6 (0.5 equiv.). An NOE correlation signal was observed between triazolium C5 proton (Ha) of CT6 and a proton (Hi) adjacent to the phosphate group of AMP. This result suggests a spatially close interaction between CT6 and AMP.
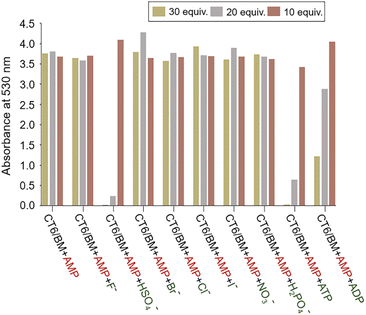
To investigate the selective recognition ability of CT6/BM complex for AMP, a competition experiment was performed in the presence of interfering anions (sodium salts, F−, Cl−, Br−, I−, H2PO4−, NO3−, HSO4−, ADP or ATP) (Fig. 6 and S12†). When 10 equiv. of anions were added to the CT6/BM complex solution containing AMP (30 equiv.), no significant effect was observed on absorbance and color. When 20 equiv. of anions were added, only HSO4− and ATP affected the absorbance. HSO4− and ATP showed 94% and 83% decrease in absorbance, respectively. When the concentration of anions was increased to 30 equiv., HSO4−, ATP and ADP caused notable changes. ADP exhibited 68% decrease in absorbance and slight color change, whereas HSO4− and ATP showed a great decrease (>95%) in absorbance and obvious color change from magenta to yellow. These results indicate that the CT6/BM complex is highly selective for AMP in the presence of most interfering anions, although the selectivity of the CT6/BM complex is affected by the concentration of a few anions.
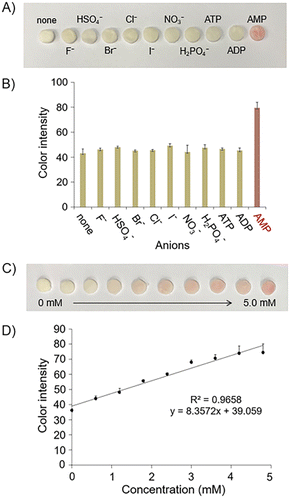
To show the practical applicability of our colorimetric IDA system, a paper-based device was fabricated. For this, the test paper disc was immersed in CT6/BM complex solution for approximately 5 minutes and then dried under vacuum. A solution containing various anions (sodium salts, F−, Cl−, Br−, I−, H2PO4−, NO3−, HSO4−, AMP, ADP or ATP) was added to a dried test paper disc to confirm its anion selectivity. As shown in Fig. 7A and B, only AMP showed a clear color change from yellow to magenta, while the other anions tested, including ATP and ADP, did not cause any color changes. To examine the correlation between the color change of the paper disc and the amount of AMP, various concentrations of AMP were added to the paper disc. Paper disc showed a magenta color with increasing color intensity as the AMP concentration increased (Fig. 7C). After images of the paper disc were acquired using a smartphone (iPhone 11), quantitative image processing was performed with ImageJ software (see Section 7 in the ESI†). The color intensity obtained from the image was plotted against the concentration of AMP. As shown in Fig. 7D, the color intensity of the paper disc increased as a function of AMP concentration. The sensitivity of the paper-based AMP sensing device was sufficiently high to allow the detection of even 1.8 mM AMP with the naked eye.
A paper disc was applied to determine the level of AMP in an artificially mixed sample composed of AMP and other anions (F−, Cl−, Br− and I−) (Table S3 and Fig. S13†). Paper discs measured in a mixed sample containing 2.7 mM AMP and other anions showed a color change from yellow to magenta. The resulting color signal was converted to color intensity by ImageJ. This color intensity was applied to the calibration curve (Fig. 7D) constructed by the pure AMP sample. The AMP concentration thus determined was 2.6 mM, which matches well with the AMP concentration used in the mixed sample. This result suggests that the coexistence of other anions did not hamper AMP detection with the paper disc. These results show the reliability of the fabricated paper disc and its applicability to real samples.
Conclusions
In summary, we developed a novel colorimetric IDA-based chemosensor using CT6 for the selective detection of AMP. CT6 was complexed with BM with 1![[thin space (1/6-em)]](https://www.rsc.org/images/entities/char_2009.gif) :
:![[thin space (1/6-em)]](https://www.rsc.org/images/entities/char_2009.gif) 1 stoichiometry, which was accompanied by a change in the UV-Vis absorption spectrum and a color change from magenta to yellow. The addition of AMP to the CT6/BM complex regenerated the original color of BM, magenta, and the original absorption spectrum, owing to the release of BM through AMP recognition of CT6. CT6 was complexed with AMP at 1
1 stoichiometry, which was accompanied by a change in the UV-Vis absorption spectrum and a color change from magenta to yellow. The addition of AMP to the CT6/BM complex regenerated the original color of BM, magenta, and the original absorption spectrum, owing to the release of BM through AMP recognition of CT6. CT6 was complexed with AMP at 1![[thin space (1/6-em)]](https://www.rsc.org/images/entities/char_2009.gif) :
:![[thin space (1/6-em)]](https://www.rsc.org/images/entities/char_2009.gif) 1 stoichiometry, which was determined by BindFit calculation. The colorimetric response provided by the IDA-based chemosensor was extended to the simple paper-based device. The fabricated paper-based device exhibited a selective color change only in the presence of AMP, providing a convenient and reliable method for AMP measurement. The developed colorimetric chemosensor has great potential as a new tool for field measurement of AMP. To extend the results of this study, our group is currently working on a paper-based sensor coupled with a smartphone for the sensitive and selective measurement of AMP in biological samples.
1 stoichiometry, which was determined by BindFit calculation. The colorimetric response provided by the IDA-based chemosensor was extended to the simple paper-based device. The fabricated paper-based device exhibited a selective color change only in the presence of AMP, providing a convenient and reliable method for AMP measurement. The developed colorimetric chemosensor has great potential as a new tool for field measurement of AMP. To extend the results of this study, our group is currently working on a paper-based sensor coupled with a smartphone for the sensitive and selective measurement of AMP in biological samples.
Author contributions
J. Cho performed all experimental work and wrote the manuscript and ESI.† S. Kim provided supervision and wrote the manuscript. All authors have read and approved the final version of the manuscript.Conflicts of interest
There are no conflicts of interest to declare.Acknowledgements
This work was supported by Grant no. 2018R1A5A2024425 (S. K.) of the National Research Foundation (NRF) funded by the Korean government (MSIT). This research was also supported by the Basic Science Research Program through the National Research Foundation of Korea (NRF) funded by the Ministry of Education (no. 2020R1I1A1A01073399, J. C.).References
- A. E. Hargrove, S. Nieto, T. Zhang, J. L. Sessler and E. V. Anslyn, Artificial receptors for the recognition of phosphorylated molecules, Chem. Rev., 2011, 111, 6603–6782 CrossRef CAS PubMed.
- (a) B. S. Khakh and G. Burnstock, The double life of ATP, Sci. Am., 2009, 301, 84–92 CrossRef; (b) C. G. Nichols, S.-L. Shyng, A. Nestorowicz, B. Glaser, J. P. Clement, G. Gonzalez, L. Aguilar-Bryan, M. A. Permutt and J. Bryan, Adenosine diphosphate as an intracellular regulator of insulin secretion, Science, 1996, 272, 1785–1787 CrossRef.
- (a) D. Carling, F. V. Mayer, M. J. Sanders and S. J. Gamblin, AMP-activated protein kinase: nature's energy sensor, Nat. Chem. Biol., 2011, 7, 512–518 CrossRef; (b) E. Helmreich and C. F. Cori, The role of adenylic acid in the activation of phosphorylase, Proc. Natl. Acad. Sci. U. S. A., 1964, 51, 131–138 CrossRef; (c) T. E. Mansour, Studies on heart phosphofructokinase: purification, inhibition and activation, J. Biol. Chem., 1963, 238, 2285–2292 CrossRef CAS.
- For recent examples, see: (a) I. Carreira-Barral, I. Fernández-Pérez, M. Mato-Iglesias, A. De Blas, C. Platas-Iglesias and D. Esteban-Gómez, Recognition of AMP, ADP and ATP through cooperative binding by Cu(II) and Zn(II) complexes containing urea and/or phenylboronic-acid moieties, Molecules, 2018, 23, 479 CrossRef PubMed; (b) J. González-García, S. Tomić, A. Lopera, L. Guijarro, I. Piantanida and E. García-España, Aryl-bis-(scorpiand)-aza receptors differentiate between nucleotide monophosphates by a combination of aromatic, hydrogen bond and electrostatic interactions, Org. Biomol. Chem., 2015, 13, 1732–1740 RSC; (c) S. Nadella, J. Sahoo, P. S. Subramanian, A. Sahu, S. Mishra and M. Albrecht, Sensing of phosphates by using luminescent EuIII and TbIII complexes: application to the microalgal cell Chlorella vulgaris, Chem.–Eur. J., 2014, 20, 6047–6053 CrossRef CAS PubMed; (d) P. Hu, S. Yang and G. Feng, Discrimination of adenine nucleotides and pyrophosphate in water by a zinc complex of an anthracene-based cyclophane, Org. Biomol. Chem., 2014, 12, 3701–3706 RSC; (e) S. Nadella, P. M. Selvakumar, E. Suresh, P. S. Subramanian, M. Albrecht, M. Giese and R. Fröhlich, Lanthanide(III) complexes of bis-semicarbazone and bis-imine-substituted phenanthroline ligands: solid-state structures, photophysical properties, and anion sensing, Chem.–Eur. J., 2012, 18, 16784–16792 CrossRef CAS.
- For selected examples, see: (a) K. Kanagaraj, C. Xiao, M. Rao, C. Fan, V. Borovkov, G. Cheng, D. Zhou, Z. Zhong, D. Su, X. Yu, J. Yao, T. Hao, W. Wu, J. J. Chruma and C. Yang, A quinoline-appended cyclodextrin derivative as a highly selective receptor and colorimetric probe for nucleotides, iScience, 2020, 23, 100927 CrossRef CAS; (b) Y. Zhao, D. Niu, J. Tan, Y. Jiang, H. Zhu, G. Ouyang and M. Liu, Alkaline-earth metal ion turn-on circularly polarized luminescence and encrypted selective recognition of AMP, Small Methods, 2020, 4, 2000493 CrossRef CAS; (c) R. L. Narendran and A. Patnaik, Synergistic effect of hydrophobic and hydrogen bonding interaction-driven viologen-pyranine charge-transfer aggregates: adenosine monophosphate recognition, Soft Matter, 2021, 17, 903–914 RSC; (d) L. Reinke, M. Koch, C. Müller-Renno and S. Kubik, Selective sensing of adenosine monophosphate (AMP) over adenosine diphosphate (ADP), adenosine triphosphate (ATP), and inorganic phosphates with zinc(II)-dipicolylamine-containing gold nanoparticles, Org. Biomol. Chem., 2021, 19, 3893–3900 RSC; (e) R. Kaur, S. Saini, N. Kaur, N. Singh and D. O. Jang, Rhodamine-based fluorescent probe for sequential detection of Al3+ ions and adenosine monophosphate in water, Spectrochim. Acta, Part A, 2020, 225, 117523–117531 CrossRef CAS.
- A. C. Sedgwick, J. T. Brewster, T. Wu, X. Feng, S. D. Bull, X. Qian, J. L. Sessler, T. D. James, E. V. Anslyn and X. Sun, Indicator displacement assays (IDAs): the past, present and future, Chem. Soc. Rev., 2021, 50, 9–38 RSC.
- B. T. Nguyen and E. V. Anslyn, Indicator-displacement assays, Coord. Chem. Rev., 2006, 250, 3118–3127 CrossRef CAS.
- (a) Z. Zheng, S. Ren, W.-C. Geng, X. Cui, B. Wu and H. Wang, Monitoring methionine decarboxylase by a supramolecular tandem assay, Chem.–Asian J., 2022, 17, e202200106 CAS; (b) W. Zhong and R. J. Hooley, Combining excellent selectivity with broad target scope: biosensing with arrayed deep cavitand hosts, Acc. Chem. Res., 2022, 55, 1035–1046 CrossRef CAS PubMed; (c) Y.-C. Pan, X.-Y. Hu and D.-S. Guo, Biomedical applications of calixarenes: state of the art and perspectives, Angew. Chem., Int. Ed., 2021, 60, 2768–2794 CrossRef CAS.
- (a) X. Chi, W. Cen, J. A. Queenan, L. Long, V. M. Lynch, N. M. Khashab and J. L. Sessler, Azobenzene-bridged expanded “texas-sized” box: a dual-responsive receptor for aryl dianion encapsulation, J. Am. Chem. Soc., 2019, 141, 6468–6472 CrossRef CAS; (b) S. Kosiorek, H. Butkiewicz, O. Danylyuk and V. Sashuk, Pillar[6]pyridinium: a hexagonally shaped molecular box that selectively recognizes multicharged anionic species, Chem. Commun., 2018, 54, 6316–6319 RSC.
- (a) J. Cho, J. Shin, M. Kang, P. Verwilst, C. Lim, H. Yoo, J. G. Kim, X. Zhang, C. S. Hong, J. S. Kim and S. Kim, Calix[n]triazolium based turn-on fluorescent sensing ensemble for selective adenosine monophosphate (AMP) detection, Chem. Commun., 2021, 57, 12139–12142 RSC; (b) J. Cho, P. Verwilst, M. Kang, J.-L. Pan, A. Sharma, C. S. Hong, J. S. Kim and S. Kim, Crown ether-appended calix[2]triazolium[2]arene as a macrocyclic receptor for the recognition of the H2PO4− anion, Chem. Commun., 2020, 56, 1038–1041 RSC; (c) M. S. Shad, P. V. Santhini and W. Dehaen, 1,2,3-Triazolium macrocycles in supramolecular chemistry, Beilstein J. Org. Chem., 2019, 15, 2142–2155 CrossRef CAS.
- F. Zapata, L. Gonzalez, A. Caballero, I. Alkorta, J. Elguero and P. Molina, Dual role of the 1,2,3-triazolium ring as a hydrogen-bond donor and anion–π receptor in anion-recognition processes, Chem.–Eur. J., 2015, 21, 9797–9808 CrossRef CAS.
- M. M. Linn, D. C. Poncio and V. G. Machado, An anionic chromogenic sensor based on the competition between the anion and a merocyanine solvatochromic dye for calix[4]pyrrole as a receptor site, Tetrahedron Lett., 2007, 48, 4547–4551 CrossRef CAS.
- T. Bevilaqua, D. C. da Silva and V. G. Machado, Preferential solvation of Brooker's merocyanine in binary solvent mixtures composed of formamides and hydroxylic solvents, Spectrochim. Acta, Part A, 2004, 60, 951–958 CrossRef.
- (a) R. Kumar, H. Jain, P. Gahlyan, A. Joshi and C. N. Ramachandran, A highly sensitive pyridine-dicarbohydrazide based chemosensor for colorimetric recognition of Cu2+, AMP2-, F− and AcO− ions, New J. Chem., 2018, 42, 8567–8576 RSC; (b) D. Datta, X. Meshik, S. Mukherjee, K. Sarkar, M. S. Choi, M. Mazouchi, S. Farid, Y. Y. Wang, P. J. Burke, M. Dutta and M. A. Stroscio, Submillimolar detection of adenosine monophosphate using graphene-based electrochemical aptasensor, IEEE Trans. Nanotechnol., 2017, 16, 196–202 CAS; (c) H. Gao, M. Xi, X. Qi, M. Lu, T. Zhan and W. Sun, Application of a hydroxyl functionalized ionic liquid modified electrode for the sensitive detection of adenosine-5′-monophosphate, J. Electroanal. Chem., 2012, 664, 88–93 CrossRef CAS; (d) Y. Song, C. Zhao, J. Ren and X. Qu, Rapid and ultra-sensitive detection of AMP using a fluorescent and magnetic nano-silica sandwich complex, Chem. Commun., 2009, 1975–1977 RSC; (e) L. Shen, Z. Chen, Y. Li, P. Jing, S. Xie, S. He, P. He and Y. Shao, A chronocoulometric aptamer sensor for adenosine monophosphate, Chem. Commun., 2007, 2169–2171 RSC; (f) S. Mondal, K. Hsiao and S. A. Goueli, Utility of adenosine monophosphate detection system for monitoring the activities of diverse enzyme reactions, Assay Drug Dev. Technol., 2017, 15, 330–341 CrossRef CAS PubMed.
- To the best of our knowledge, only two AMP sensors have lower LOD values than the CT6/BM ensemble. See: ref. 5e and 14f..
Footnote |
| † Electronic supplementary information (ESI) available: 1H NMR studies, complexation studies between CT6 and BM, indicator displacement of the CT6/BM complex with AMP, detection limit measurements, 1H NMR titration and 2D NOESY NMR studies, competition study and paper-based colorimetric assay. See DOI: https://doi.org/10.1039/d2ra05987h. |
| This journal is © The Royal Society of Chemistry 2022 |

