
 Open Access Article
 This Open Access Article is licensed under a
 Creative Commons Attribution 3.0 Unported Licence
Effect of carbon on the co-presence of metallic tungsten as a nucleation agent and Eu2+ in glass: crystallization of CaO–Al2O3–SiO2 glass probed with Eu2+ luminescence
Shingo Machida *,
Naoki Emori,
Ken-ichi Katsumata,
Kei Maeda and
Atsuo Yasumori
*,
Naoki Emori,
Ken-ichi Katsumata,
Kei Maeda and
Atsuo Yasumori
Department of Material Science and Technology, Faculty of Advanced Engineering, Tokyo University of Science, 6-3-1 Niijuku, Katsushika-ku, Tokyo 125-8585, Japan. E-mail: shingo.machida@rs.tus.ac.jp
First published on 3rd November 2022
Abstract
This study demonstrated simple redox control in glasses by improving the method used to added glass raw materials. Specifically, the effect of carbon on the co-presence of metallic tungsten (W) particles as nucleation agents and Eu2+ ions in CaO–Al2O3–SiO2 (CAS) glass was investigated via their crystallization to form CAS glass-ceramics (GCs). In this study, the glass specimens were prepared by mixing glass cullet containing metallic W particles and Eu2+ ions, respectively, with a glass batch containing carbon. Whereas the glass specimen was yellowish because of the presence of Eu2+ when carbon was not added during the remelting process, the glass specimen prepared with carbon was black because of the presence of metallic W particles. In addition, this specimen displayed the 470 nm emission band in its fluorescence spectrum recorded under 393 nm excitation, which was attributed to the presence of Eu2+. According to the fluorescence and transmission spectra, the glass specimen showed a darker coloration and more intense 470 nm emission band compared with the specimen prepared by the conventional melting method that included a remelting process. These results indicated that metallic W and Eu2+ were reduced with greater efficiency by the melting method that involved mixing the glass cullet and batch. In addition, the heat-treated glass specimen prepared by the aforementioned mixing method contained a greater amount of metastable CaAl2Si2O8 with increasing heat treatment time as revealed by X-ray diffraction analysis and scanning electron microscopy observation. The intensity of the 470 nm emission band decreased with increasing intensity of the band at 420 nm because of the incorporation of Eu2+ into the crystalline phase, and the increase in intensity of the 420 nm band was lineally proportional to the volume fraction of the crystallized glass specimens. The results therefore indicated that the co-presence of metallic W particles as nucleation agents and Eu2+ as a probe for tracking the crystallization process was achieved by the addition of carbon during the remelting process of mixed cullet containing W and Eu2+ through crystallization of the CAS glass. The results thus demonstrate the importance of improving the method used to added glass raw materials.
Introduction
Composite materials that comprise two or more components have displayed chemical and physical properties that differ from those of the individual components. In addition, composites can compensate for the shortcoming of individual components and make them functional. One example is glass-ceramics (GCs)1–9 generated by precipitating crystalline phases in glassy phases. GCs were developed because glass bulk materials are brittle materials whose mechanical properties are improved by the precipitation of crystal particles.1–5 In the case where the crystal particles exhibit luminescence, the corresponding GCs are considered to be highly promising optical materials.2–9 These GCs can be obtained by crystallization of glass doped with rare-earth ions such as Eu3+, Tb3+, and Dy3+.6–9 Some of GCs exhibit a decrease in the luminescence with increasing crystal field.9–11 In contrast to these rare-earth ions, Eu2+ can exhibit an increase in luminescence with increasing crystal fraction,12–16 which might be advantageous for using spectroscopic imaging.17,18 In addition to rare-earth ions being used as dopants in GCs as optical materials, the exhibit luminescence properties that make them useful for probing crystallization processes.10 Therefore, Eu2+ luminescence can potentially be used to assess the crystal fraction in GCs, which is advantageous because the methods used to characterize the crystallization phases of GCs are basically X-ray diffraction (XRD) and microscopy. Thus, from the viewpoint of Eu2+ luminescence versatility, the oxidation of Eu2+ during the melting stage10 and/or during heat treatment of a glass should be appropriately suppressed depending on the glass compositions.Herein, we devote special attention to simple redox control in glass by improving the addition method for glass raw materials. Specifically, this study investigates the effect of carbon on the co-presence of metallic tungsten (W) particles as nucleation agents19–21 and Eu2+ in glass. Metallic W and molybdenum (Mo) particles are critical nucleation agents for preparing CaO–Al2O3–SiO2 (CAS) GCs with precipitated metastable CaAl2Si2O8, a layered crystal with a hexagonal platy shape (CAS GC-H) forming a house-of-cards structure10,19–26 in glass similar to that of machinable mica GCs.24 In contrast to mica GCs, this CAS GC displays relatively high transparency despite the precipitation as micron-sized layered crystals;19,25 this transparency is advantageous in fundamental luminescence studies.10 Concerning the precipitation of metallic W and Mo particles in the CAS glass, tungsten oxide (WO3) and molybdenum oxide (MoO3) are reduced by carbon during glass melting.10,19–25 In our previous research, metallic Mo particles, whose oxidation free energy is similar to that for metallic W particles27 were absent in the CAS glass with a yellowish color caused by Eu2+ when the glass raw material containing MoO3, carbon, and europium oxide (Eu2O3) was melted, suggesting that metallic Mo was oxidized when Eu3+ was reduced.10 The efficient reduction of both Eu3+ and MoO3 is thus necessary. In previous related reports, meanwhile, Mo clusters in glass were reported to result in yellowish color28 that can overlap the Eu2+-induced coloration. Therefore, improving the method used to added W to glass is the best strategy in cases where Eu2+ and metallic W particles are co-present in CAS glass. Thus, in the present study, we mixed of glass cullet containing metallic W particles and Eu2+, and then the melted cullet with glass batch containing carbon, exploring the appropriate amounts of carbon through the crystallization of CAS glass. In addition, we compared the proposed method with the conventional melting method containing remelting process. Notably, in our previous studies,19–21 we found that the additives and their amount strongly affect the remelting processes.
Experimental
In the present study, 50 g of CAS glass specimens was prepared by heating the raw materials at 1550 °C for 1 h under air in an alumina crucible.10,16,19,20 All the raw materials were reagent grade and were obtained from Wako Pure Chemical. Carbon was obtained from Kojundo Chemcal Laboratory.20 The nominal composition of the glass was 25CaO–20Al2O3–55SiO2 (wt%)16 where calcium carbonate (CaCO3) was used as a CaO source. The glass batches with this composition, along with 0.80 wt% WO3 and 4.0 wt% C, or 1.6 wt% Eu2O3 and 4.0 wt% C were melted to form glass cullet containing metallic W particle (Cullet-W) or Eu2+ ions (Cullet-Eu2+), respectively. The same weight of this glass cullet and the same compositional glass batch with 4.0, 0.40, or 0 wt% C were mixed and then melted to form three glass specimens with a composition of 25CaO–20Al2O3–55SiO2 (wt%) with 0.27wt% WO3 and 0.53wt% Eu2O3 (denoted herein as W-Eu-Glass-xC where x represents the carbon content (wt%)). For comparison, the conventional melting method was also used: a glass batch with a composition of 25CaO–20Al2O3–55SiO2 (wt%) with 0.27 wt% WO3, 0.53 wt% Eu2O3, and 4.0 wt% C was melted twice, where the remelting process consisted of adding a glass batch with same composition and weight; the resultant glass specimen is designated herein as W-Eu-Glass-normal. These glass specimens were crystallized by heat treatment at 1050 °C for 0, 2, or 6 h with heating and cooling rates of 100 °C min−1 according to the previous studies,16,20 to generate the glass specimens referred to herein as W-Eu-Glass-xC-yh where y represents the heat treatment time. Notably, a 0 h heat treatment indicates that the glass was subjected to the aforementioned elevated and reduced temperatures. Each glass specimen was cut and polished to remove the surface layer and to obtain glass specimens with a consistent size for the analyses described in the following paragraph. Note that the surface layer was drastically increased when the present type of glass specimen was heat-treated at 1100 °C. The effect of chemical composition on the luminescence property was investigated by performing, the glass specimen was prepared by the melting of the glass batch with the composition of 27CaO–13Al2O3–60SiO2 (wt%) with 0.53wt% Eu2O3 and 4.0 wt% C whose major composition was assumed and roughly estimated by the 30 wt% precipitation of metastable CaAl2Si2O8 in the CAS glass as described in our previous report.10 The glass specimen was denoted herein as Eu-Al-low-Glass. For the comparison of the luminescence properties of glass specimens after heat treatment with those of the crystalline product, the solid-state sample was prepared by mechanically grinding purified and expanded kaolinite (Al2Si2O5(OH)4) and CaCO3 and heating the mixtures under a N2 atmosphere containing 3 vol% H2 (i.e., a reductive atmosphere) at 900 °C for 12 h.29,30 Notably, the solid-state reaction of kaolinite and CaCO3 forms anorthite (CaAl2Si2O8) and metastable CaAl2Si2O8 depending on the reaction temperature and atmosphere.30 The obtained product was thus denoted as Eu2+–CaAl2Si2O8 for convenience.The crystalline phases of the glass specimens and the solid-state product were characterized by XRD analysis (XRD-610, Shimadzu). The microstructures of the glass specimens after heat treatment were characterized by scanning electron microscopy (SEM:TM-3000, Hitachi). The crystal volume fractions (vol%) in the heat-treated glass specimens were approximately using binarized SEM images. Fluorescence spectra of the glass specimens before and after crystallization, as well as the spectrum of solid-state product were obtained with excitation at 393 or 463 nm (FP-6500, JASCO). The thickness of the glass specimens for fluorescence analysis was 1 mm.
Results and discussion
Notably, W cluster have previously been reported to result in bluish phosphate glass.28 However, such coloration was not observed in the colorless CAS glass prepared by the oxidative melting of glass cullet containing metallic W particles in our previous study.19,21 Therefore, the oxidation of metallic W particles in the CAS glass with the present composition likely dose not generate a glass specimen with W cluster coloration. Meanwhile, the colorless glass that never showed bulk crystallization was obtained when the raw material of CAS glass was melted without addition of carbon.16 In addition, it is revealed that metallic particles are acted as heterogeneous nucleation sites for crystallization of metastable CaAl2Si2O8 based on transmission electron microscopy.17 Furthermore, various coloration of glasses containing metallic W particles exhibited crystallization of metastable CaAl2Si2O8.19–21 Therefore, metallic W particles likely act as heterogeneous nucleation sites.Cullet-W appeared black because of the presence of metallic W particles (Fig. 1, left), in good agreement with our previous studies.19–21,24,27,31 By contrast, Cullet-Eu2+ was yellowish (Fig. 1, right), consistent with the results of the previous studies in which Eu2+-doped glass specimens were reported to be yellow.10,31 These observations suggest that WO3 and Eu3+ were reduced by carbon burning at the glass melting stage. The black color of W-Eu-Glass-4.0C was similar to that of Cullet-W, whereas the black coloration decreased in the order of W-Eu-Glass-0.40C and -0C (Fig. 2, top). The color of W-Eu-Glass-0C was similar to that of Cullet-Eu2+. In our previous study, the oxidation of metallic particle upon the reduction of Eu3+ resulted in a yellowish glass specimen containing Eu2+.10 In addition, the CAS glass with such coloration was never crystallized by heat treatment.10 In our previous study, we estimated the amount presence of metallic W particles using transmission spectra, where a decrease in transmittance for black glass specimens indicated an increase in the amount of metallic W particles.19,20 The transmission spectra of W-Eu-Glass-0C shows a decrease in transmittance at 470 nm or shorter wavelengths because of yellow color of Eu2+ (Fig. 3).11,32,33 Compared with the transmittance at 470 nm or longer wavelength in the spectrum of W-Eu-Glass-0C, that in the spectra of W-Eu-Glass-0.40C and -4.0C decreases in the order W-Eu-Glass-0.40C and -4.0C (Fig. 3). This decrease in the transmittance for W-Eu-Glass-0.40C and -4.0C was similar to that observed in the spectrum of W-Eu-Glass-0h (Fig. 3). Therefore, in the present study, the metallic W particles are likely oxidized during the melting process of W-Eu-Glass-0C. Notably, the coloration of W-Eu-Glass-4.0C was darker than that of W-Eu-Glass-normal (Fig. 2, top) and the transmittance at wavelengths longer and shorter than 440 nm for W-Eu-Glass-normal is higher and lower than those in the corresponding regions of W-EU-Glass-4.0C, respectively (Fig. 3), suggesting that both metallic W particles and Eu3+ ions in W-Eu-Glass-4.0C exhibit a greater reduction efficiency than those in W-Eu-Glass-normal. However, the blue coloration due to Eu2+ fluorescence32 under 254 nm irradiation was not visually distinguished between the glass specimens before and after crystallization (Fig. 2, middle). In addition, such blue fluorescence was clearly observed under 365 nm irradiation (Fig. 2, bottom), which is commonly used to visually check the red fluorescence of Eu3+-doped glass. Notably, the transmittance for heat-treated W-Eu-Glass-4.0C specimens decreases with increasing heat-treatment time, whereas no difference in transmittance is observed between the spectra of W-Eu-Glass-0.40C before and after heat treatment (Fig. 3). We, therefore, characterized the luminescence properties of the glass specimens.
 | ||
| Fig. 1 Photographs of Cullet-W (left) and Cullet-Eu2+ (right). | ||
 | ||
| Fig. 2 Photographs of (a) W-Eu-Glass-4.0C, (b) W-Eu-Glass-0.40C, (c) W-Eu-Glass-0C, (d) W-Eu-Glass-normal, (e) W-Eu-Glass-4.0C-2h, and (f) W-Eu-Glass-0.40C-2h under normal lighting (top), under 254 nm irradiation (middle), and under 365 nm irradiation (bottom). | ||
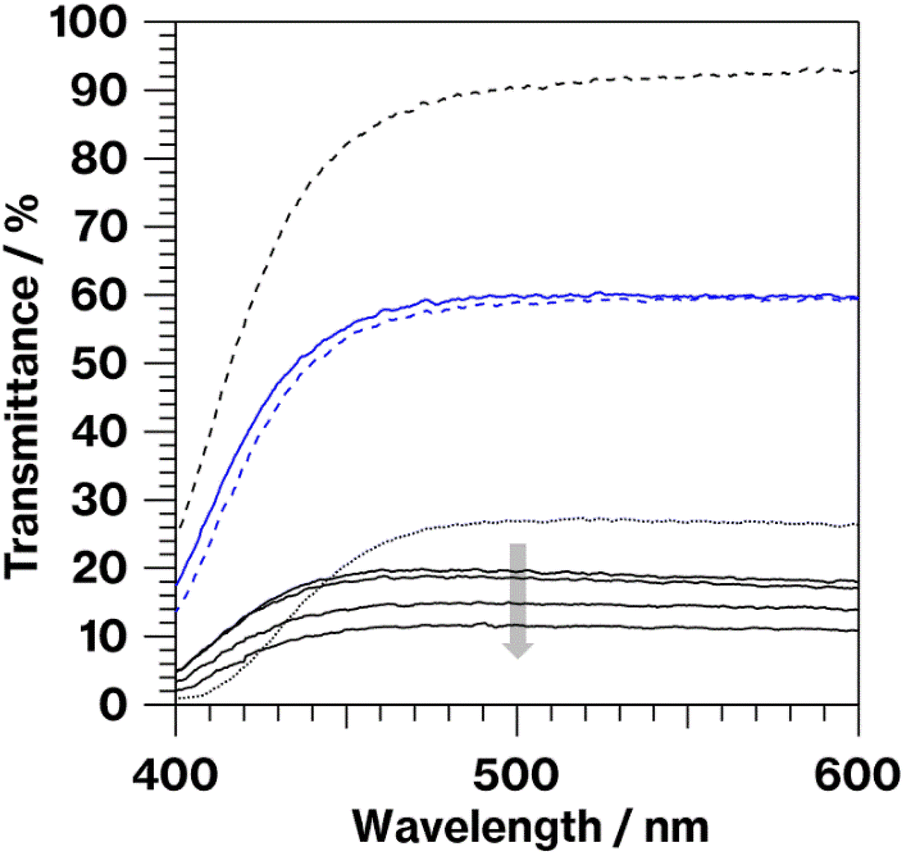 | ||
| Fig. 3 Transmission spectra of W-Eu-Glass-4.0C, W-Eu-Glass-4.0C-0h, W-Eu-Glass-4.0C-2h, W-Eu-Glass-4.0C-6 h (black solid lines in order of gray arrow), W-Eu-Glass-0.40C (blue solid line), W-Eu-Glass-0.40C-2h (blue dashed line), W-Eu-Glass-0C (black dashed line), and W-Eu-Glass-normal (black dotted line). | ||
Fig. 4 shows fluorescence spectra of the glass specimens before and after crystallization. In the spectra acquired under 393 nm excitation, all the glass specimens exhibit broad emission bands at approximately 470 nm, which is attributed to Eu2+ fluorescence.10–16,32,33 The more intense emission at 470 nm is observed for W-Eu-Glass-0C, and W-Eu-Glass-4.0C and -0.40C show the same 470 nm emission intensity, which is stronger than that for W-Eu-Glass-normal. Compared with the spectra of glass specimens before the heat treatment, the spectra of heat-treated specimens exhibit weaker emission intensity at 470 nm and an increase in intensity at 420 nm with increasing the heat treatment time. In addition, the broad emission at 470 nm without the 420 nm emission was observed in the spectrum of Eu-Al-low Glass (data not shown). For 463 nm excitation, which is often used for exciting red Eu3+ luminescence,34 all the spectra exhibit weak Eu3+ fluorescence because of a 5D0 → 7F2 transition at 610 nm.11 In addition, the intensity of this fluorescence decreases in the order W-Eu-Glass-0C, -normal, -0.40C, and 4.0C. Among the samples, W-Eu-Glass-0.40C and -4.0C exhibit small changes in emission intensity after the heat treatment. Notably, the 610 nm emission was never observed in the fluorescence spectra recorded under 393 nm excitation, whereas in our previous study, broad emissions at both 470 and 610 nm were observed in the spectrum of yellowish CAS glass containing Eu2+ but not metallic Mo.10
 | ||
| Fig. 4 Fluorescence spectra of W-Eu-Glass-4.0C, W-Eu-Glass-4.0C-0h, W-Eu-Glass-4.0C-2h, W-Eu-Glass-4.0C-6 h (black solid lines in order of gray arrow), W-Eu-Glass-0.40C (blue solid line), W-Eu-Glass-0.40C-2h (blue dashed line), W-Eu-Glass-0C (black dashed line), and W-Eu-Glass-normal (black dotted line) under 393 nm (left) and 463 nm (right) excitation. | ||
In previous reports on Eu2+-doped GCs12–16,33–35 and phosphors whose mother materials were RAl2Si2O8 (where R represents an alkaline earth element),36–40 the 420 nm emission was clearly observed because of the incorporation of Eu2+ into the crystal structure. In the present study, reflections due to anorthite are observed in the XRD pattern of Eu2+–CaAl2Si2O8 and broad emission at 420 nm is observed in the fluorescence spectrum of Eu2+–CaAl2Si2O8 (Fig. 5, left and right). Notably, the solid-state reaction of kaolinite with CaCO3 forms metastable CaAl2Si2O8 at 900 °C under air but unfortunately generates anorthite (CaAl2Si2O8) under a reductive atmosphere despite the 900 °C reaction temperature.30 The preparation of Eu2+-doped metastable CaAl2Si2O8 could thus be the topic of a future study.
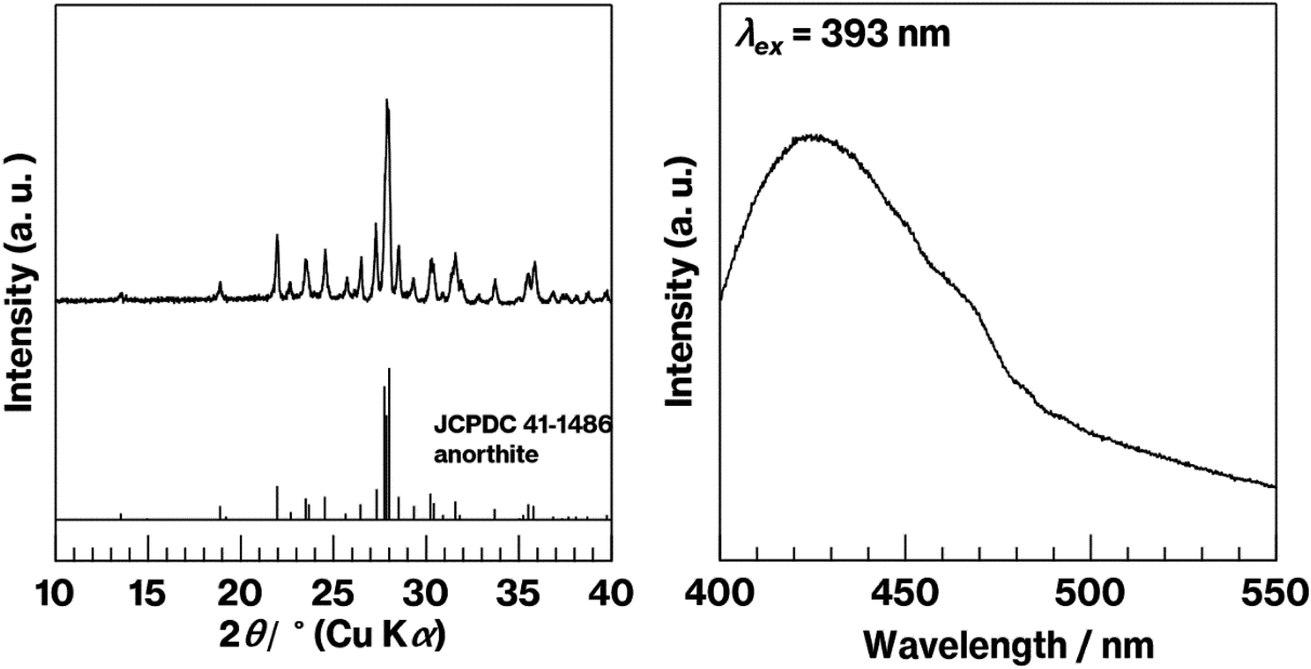 | ||
| Fig. 5 XRD pattern (left) and fluorescence spectrum (right) for Eu2+–CaAl2Si2O8. | ||
Fig. 6 shows SEM images of the heat-treated glass specimens. The SEM images of the house-of-cards structures comprising hexagonal platy particles of metastable CaAl2Si2O8 show the black regions with a needle-like appearance that, according to our previous reports,24–26 correspond to an arbitrary cross-section of a house-of-cards structure representing the CAS GC-H microstructure. In the present study, needle-like particles are considered to be crystal particles for simplicity. Needle-like particles are observed in the SEM images of all the samples prepared in the present study. The SEM images of the heat-treated glass specimens show that the needle length and width, as well as volume fractions, increase with increasing heat treatment time. The limitation of the present study lies in the estimation of the aspect ratio41,42 of the needle-like particles, because an arbitrary cross-section of the house-of-cards structures includes the diagonal cross-sections of platy particles.
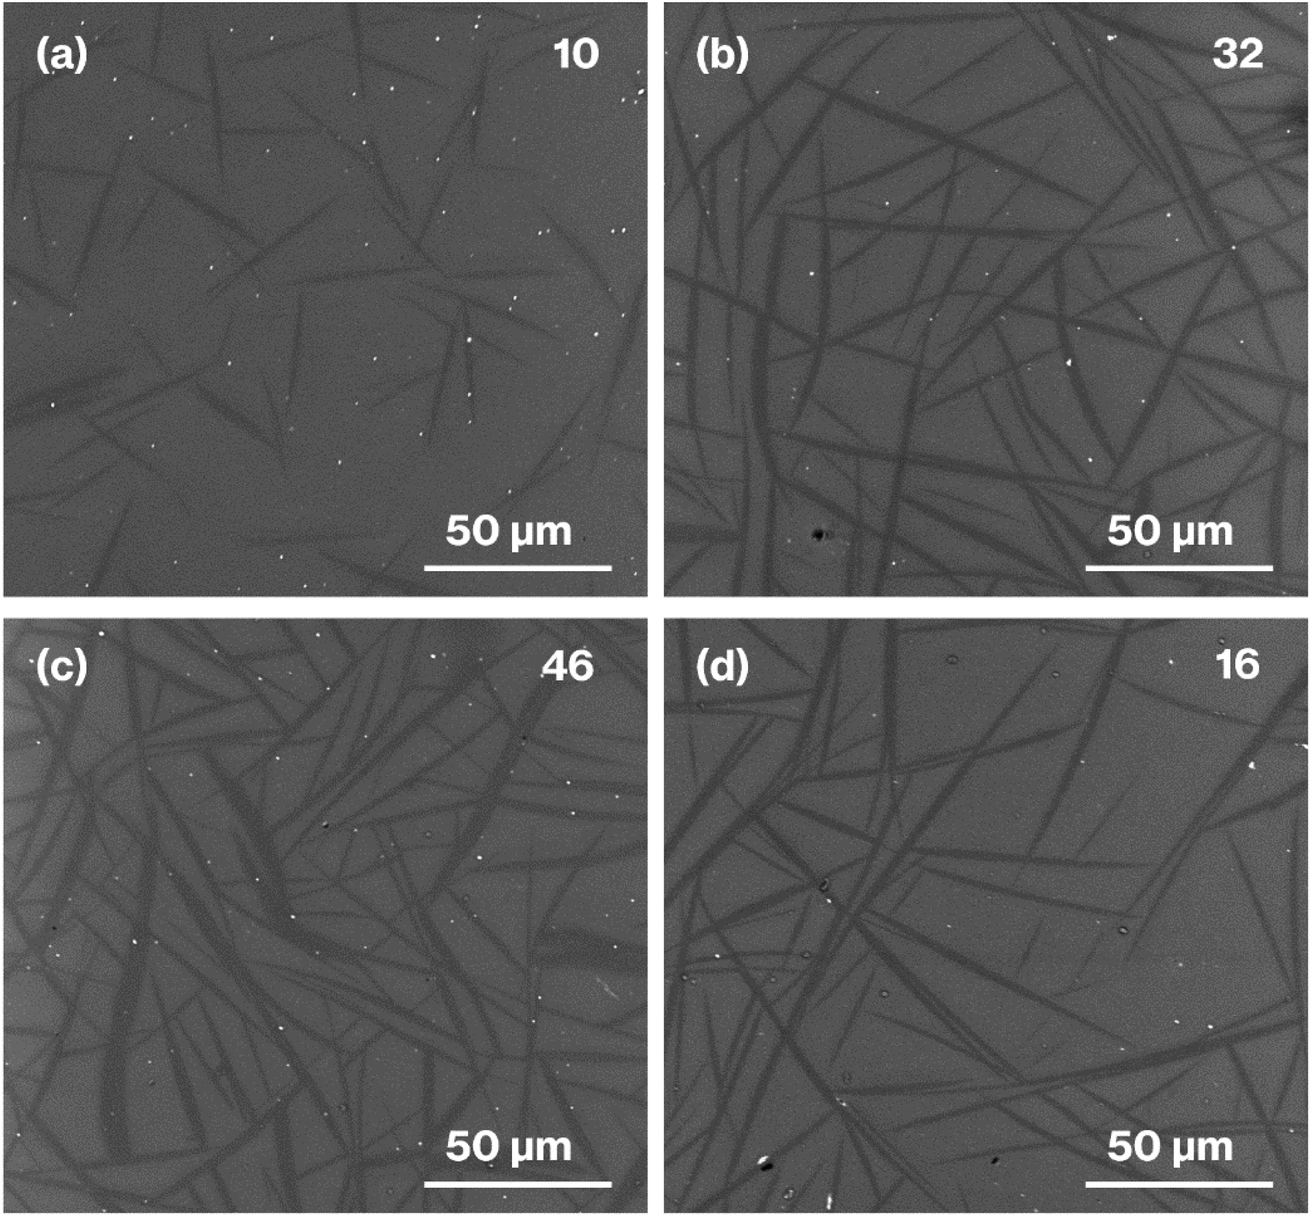 | ||
| Fig. 6 SEM images of (a) W-Eu-Glass-4.0C-0h, (b) W-Eu-Glass-4.0C-2h, (c) W-Eu-Glass-4.0C-6h, and (d) W-Eu-Glass-0.40C-2h. The volume fraction (vol%) is denoted in the upper right of each image. | ||
Fig. 7 shows XRD patterns for the glass specimens. Unlike the pattern for W-Eu-Glass-4.0C, which shows a halo profile, the patterns for the heat-treated glass specimens show reflections attributed to metastable CaAl2Si2O8.43 The diffraction intensity increases with increasing heat treatment time in the patterns for the heat-treated W-Eu-Glass-4.0C. In addition, reflections due to calcium tungstate44 were not observed in any of the profiles, in agreement with our prior research.19 Notably, the (004) reflection is attributed to the stacking direction of aluminosilicate layers of metastable-CaAl2Si2O8.43 The intensity of the (004) reflection relative to that of other reflections is greater in the patterns for W-Eu-Glass-4.0C-6h and -0.40C-2h than in the pattern for W-Eu-Glass-4.0C-2h. In addition, as a result of greater volume fraction of W-Eu-Glass-4.0C-2h than W-Eu-Glass-0.40C-2h (Fig. 6b and d), the intensity of the (004) reflection looks like equivalent for these two glass specimens. Notably, XRD profiles vary depending on the crystallinity, stacking order, and lateral sizes of stacked inorganic layers composed of layered crystals;45–47 the intensity of reflections associated with the stacking direction relative to that associated with lateral atom arrangements is particularly variable.29
 | ||
| Fig. 7 XRD patterns for (a) W-Eu-Glass-4.0C, (b) W-Eu-Glass-4.0C-0h, (c) W-Eu-Glass-4.0C-2h, (d) W-Eu-Glass-4.0C-6h, and (e) W-Eu-Glass-0.40C-2h. | ||
The results mentioned above, SEM images and XRD patterns (Fig. 6 and 7) indicate the precipitation of hexagonal platy particles of metastable CaAl2Si2O8 in the glass specimens after heat treatment. The coloration of the glass specimens under normal lighting and 254 nm irradiation (Fig. 2, top and middle), as well as their transmission and fluorescence spectra (Fig. 3 and 4), reveal the presence of Eu2+ in the glass specimens in with minute Eu3+ contents. The presence of the emission band at ∼420 nm in the fluorescence spectra of glass specimens after heat treatment, the position of which well matches that observed in the fluorescence spectrum of Eu2+–CaAl2Si2O8, strongly implies that Eu2+ was incorporated into the crystalline phases in the glass specimens after the heat treatment. In addition, the appearance of 420 nm emission did not respond to the change of glass composition by crystallization based on the absence of 420 nm emission in the fluorescence spectra of W-Eu-Glass-0C and Eu-Al-low-Glass, indicating the responsibility of the 420 nm emission to the glass crystallization with concurrent Eu2+ accommodation to crystals. These results therefore indicate the formation of Eu2+-doped CAS GC-H in the heat-treated W-Eu-Glass-4.0C and -0.40C specimens. Given the absence of dark coloration in the yellowish W-Eu-Glass-0C (Fig. 2) whose color is the same as that of Eu2+-doped glass specimens,10,32,33 the carbon added during the remelting process suppressed the oxidation of both metallic W particles and Eu2+ ions in the mixed Cullet-W and Cullet-Eu2+ (Fig. 1), respectively. Thus, the co-presence of metallic particles as nucleation agents and Eu2+ ions in the CAS glass, which was not achieved in our prior research, was accomplished in the present study by the effect of carbon and by improving the addition method for glass raw materials.10 This interpretation fits well with the lines in Ellingham diagrams decreasing in the order W/WO3, EuO/Eu3O4, Eu3O4/Eu2O as reported in previous studies.48,49 Although the co-presence of metallic W and Eu2+ is evident in the glass specimen prepared by the conventional melting method, the reduction efficiency of this method is lower than that of the improved glass raw material addition method used in the present study, as evaluated on the bases of the coloration and the fluorescence spectra of glass specimens of W-Eu-Glass-4.0C, -0.40C, and -normal (Fig. 2 and 4). This greater reduction efficiency is attributed to the carbon combustion reaction being used to reduce WO3 and Eu2O3, which minimizes the oxidation of Eu2+ and metallic W. The amount of carbon used as a glass raw material appears to be sufficient for reducing WO3 and Eu2O3, although the increase in volume of the glass batch due to the carbon bulk resulted in the mixture hardly fitting in the crucible. In addition, to the best of our knowledge, EuO is not commercially available and commercial Eu2+ compounds contain halogens and sulfur whose effects on both the Eu2+ luminescence and nucleation processes should be considered; this is a topic of another detailed study. Meanwhile, although the transparency and coloration differ between W-Eu-Glass-4.0C, and -0.40C, the intensity of the 470 nm emission due to Eu2+ is the same for these two glass specimens that exhibit minute differences in the intensity of their Eu3+ emission. Moreover, the XRD patterns and SEM images show that the amounts of crystalline phases differ between W-Eu-Glass-4.0C-2h and -0.40C-2h (Fig. 6 and 7). Therefore, suppressing of Eu2+ oxidation by controlling the amount of nucleation agent achieved by varying the amount of carbon added during the remelting process. Notably, the amounts of crystalline phases generally depend on the number of nucleation agents.19–21,50 In the case of a low carbon content (e.g. 0.40 wt%), metallic W particles would also help suppress Eu2+ oxidation to reduce the number of nucleation agents. Because glass specimens with a larger amount of nucleation agents are likely advantageous for studying the crystallization process,10 we evaluated the Eu2+ probing ability on the basis of the crystallization of CAS GC-H using W-Eu-Glass-4.0C specimens.
Fig. 8 shows the relationship between the 420 nm emission intensity and the volume fraction estimated from fluorescence spectra and SEM images of W-Eu-Glass-4.0C and -0.40C after crystallization. For W-Eu-Glass-4.0C, the emission intensity increases in proportion to the volume fraction of the crystalline phase, indicating that Eu2+ is successfully probed via the CAS glass crystallization. Given that the decrease in transparency upon crystallization of W-Eu-Glass-4.0C (Fig. 3) is likely due to light scattering by precipitating crystals, the Eu2+ luminescence in the W-Eu-Glass-4.0C specimens is unlikely affected by the presence of crystalline phases. The data point for W-Eu-Glass-0.40C-2h does not lie on the dotted line in Fig. 8. Based on the difference in coloration between the W-Eu-Glass-0.40C and -0.40C specimens (Fig. 2 and 3), the intensity of Eu2+ luminescence is likely affected by the dark coloration, which depends on the amount of metallic W particles. Unfortunately, however, a change in redox state of the metallic W particles during the heat treatment for crystallization is still unclear even in CAS GC-H.19–25 Therefore, a further study will be required to clarify the relationships among dark coloration, Eu2+ emission intensity, and crystallization, Ti3+, which can function as a reducer during glass heat treatment,51 is a feasible additive given that the lines for Ti4O7/TiO2 and Ti3O5/TiO2 lie below those for W/WO3 in the Ellingham diagrams.52 Meanwhile, in a previous study, a GC with precipitated CaAl2Si2O8, which was prepared via phase separation, displayed a slight shift of its 470 nm broad emission band upon crystallization. Although the 420 nm intensity increased after crystallization of BaO–Al2O3–SiO2–MgF2 glass, in which the main crystalline phase of was BaAl2Si2O8, the relationship between the increase intensity and crystallization is not linear according to previous reported results.12 In addition, by-phases are precipitated along with the main phase.12 These tendencies have been documented in the previous studies.14,15 Therefore, the present study clearly shows the linear relationships between the fluorescence intensity and crystallization amount because of the features of CAS GC-H, which has a single crystalline phase and relatively high transparency compared with GCs prepared via fluorine separation.11,12,26
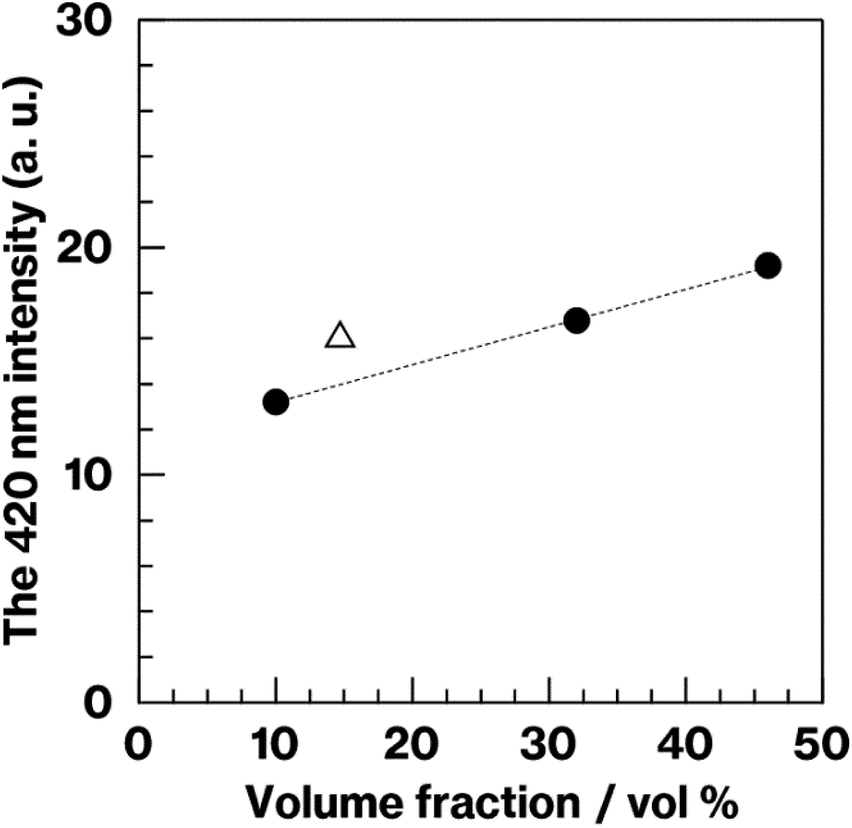 | ||
| Fig. 8 Intensity at 420 nm as a function of volume fraction (vol%) of crystalline phase, as obtained from the fluorescence spectra and SEM images of the heat-treated W-Eu-Glass-4.0C product (filled circles) and W-Eu-Glass-0.40C-2h (open triangle). | ||
In our previous study, we found that, during the remelting process, the additives and their amount strongly affected the amount of nucleation agents formed, thereby enabling the size of the hexagonal platy particles forming house-of-cards structures to be controlled in the 3–110 μm range.19–21 Among additives, carbon was added solely during the remelting process, resulting in the generation and an increase in the number of large platy particles due to the growth of metallic W particles.19 This interpretation explains the difference between W-Eu-Glass-4.0C-2h and W-Eu-Glass-0.40C-2h; the volume fraction and darkness of the former glass specimen are greater than those of the latter (Fig. 2, 3, and 6), suggesting the presence of larger and more metallic W particles in W-Eu-Glass-4.0C-2h than W-Eu-Glass-0.40C-2h. Thus, microstructural control and increased transparency of CAS GC-H is achieved under the presence of Eu2+. Among them, an increase in transparency of Eu2+-doped CAS GC-H could be useful for optimizing the luminescence property. Notably, we recently reported the effect of the particle size of carbon as a glass raw material on to both the reduction efficiency of MoO3 and microstructural control in CAS GC-H.20 The size of additives and the addition method for the glass batch and cullet were found to be key parameters for controlling both the redox states and microstructure in glass and GCs. These insights will be used for in further studies of rare-earth doped CAS and other types of glass and GC.
Conclusions
We have demonstrated the effect of carbon on the co-presence of metallic W particles and Eu2+ ions in CAS glass by observing the crystallization of the CAS glass to form CAS GC-H, where the method of mixing cullet containing metallic W and Eu2+ with glass batch containing carbon in the remelting process efficiently suppressed the oxidation of metallic W particles and Eu2+, in contrast to the conventional melting method that includes a remelting process. In addition, the Eu2+-doped CAS GC-H enabled crystallization tracking using the Eu2+ luminescence as a probe, where the luminescence intensity increased in proportion of the crystal volume fraction. Furthermore, the microstructure of the materials investigated in present study was found to be closely related to that of CAS GC-H, which exhibits larger hexagonal platy particles that lead to improved microhardness.19 These results therefore demonstrated the potential to combine studies of mechanical properties19–26 and spectroscopy17,18 to develop Eu2+ luminescence versatility.Author contributions
Shingo Machida: conceptualization, writing—original draft, data curation, investigation, supervision. Naoki Emori: investigation. Kei Maeda: writing—review and editing. Ken-ichi Katsumata: project administration. Atsuo Yasumori: project administration.Conflicts of interest
There are no conflicts of interest.Acknowledgements
This work was supported by a Reiwa 3rd year Research Grant (1-46) from the Precise Measurement Technology Promotion Foundation (PMTP-F), Japan.References
- A. V. DeCeanne, L. R. Rodrigues, C. J. Wilkinson, J. C. Mauro and E. D. Zanotto, J. Non-Cryst. Solids, 2022, 591, 121714 CrossRef CAS.
- J. Deubener, M. Allix, M. J. Davis, A. Duran, T. Höche, T. Honma, T. Komatsu, S. Krüger, I. Mitra, S. Müller, S. Nakane, M. J. Pascual, J. W. P. Schmelzeri, E. D. Zanotto and S. Zhou, J. Non-Cryst. Solids, 2018, 501, 3–10 CrossRef CAS.
- W. Höland and G. H. Beall, Glass-Ceramic Technology, ed. W. Höland and G. H. Beall, Wiley-America Ceramic Society, Hoboken, New Jersey, 3rd edn, 2019, pp 67–357 Search PubMed.
- M. Allix and L. Cormier, Crystallization and Glas-Ceramics, in Springer Handbook of Glass, ed. J. D. Musgraves, J. Hu and L. Calvez, Springer Nature, Switzerland, 1st edn, 2019, pp 113–168 Search PubMed.
- T. Homma, K. Maeda, S. Nakane and K. Shinozaki, J. Ceram. Soc. Jpn., 2022, 130, 545–551 CrossRef.
- M. E. Cruz, M. Sedano, Y. Castro, M. J. Pascual, J. Fernández, R. Balda and A. Durán, Opt. Mater. Express, 2022, 12, 3493–3516 CrossRef CAS.
- K. Kajihara, K. Kanamori and A. Shimojima, J. Ceram. Soc. Jpn., 2022, 130, 575–583 CrossRef CAS.
- T. Komatsu and T. Honnma, Int. J. Appl. Glass Sci., 2013, 4, 125–135 CrossRef CAS.
- M. E. Cruz, Y. Castro and A. Durán, J. Sol-Gel Sci. Technol., 2022, 102, 523–533 CrossRef CAS.
- S. Machida, T. Yamaguchi, N. Emori, K. Katsumata, K. Maeda and A. Yasumori, Inorg. Chem., 2022, 61, 11478–11483 CrossRef CAS.
- S. Taruata, M. Matsuki, H. Nishikiori, T. Yamakami, T. Yamaguchi and K. Kunio, Ceram. Int., 2010, 4, 1303–1309 CrossRef.
- S. K. Evstropiev, A. V. Shashkin, N. B. Knyazyan, G. G. Manukyan, V. V. Bagramyan, V. Timchuk and V. L. Stolyarova, J. Non-Cryst. Solids, 2022, 560, 121386 CrossRef.
- M. Rahimi, M. Zahedifar, R. Azimirad and A. Faeghinia, J. Lumin., 2020, 221, 117040 CrossRef CAS.
- H. Bouchouicha, G. Panczer, D. de Ligny, Y. Guyot, M. L. Baesso, L. H. C. Andrade, S. M. Lima and R. Ternane, J. Lumin., 2016, 169, 528–533 CrossRef CAS.
- A. Herrmann, A. Simon and C. Rüseel, J. Lumin., 2012, 132, 215–219 CrossRef CAS.
- K. Biswas, A. D. Sontakke, R. Sen and K. Annapurna, J. Fluoresc., 2012, 22, 745–752 CrossRef CAS PubMed.
- R. Zhang, Y. Ying, X. Rao and J. Li, J. Sci. Food Agric., 2012, 92, 2397–2408 CrossRef CAS PubMed.
- G. Trovatello, A. Genco, C. Cruciano, B. Ardini, Q. Li, X. Zhu, G. Valentini, G. Cerullo and C. Manzoni, Opt. Mater. X, 2022, 14, 100145 Search PubMed.
- S. Machida, M. Murayama, K. Maeda, K. Katsumata and A. Yasumori, J. Ceram. Soc. Jpn., 2022, 130, 850–856 CrossRef CAS.
- S. Machida, K. Maeda, K. Katsumata and A. Yasumori, Int. J. Appl. Glass Sci., 2022 DOI:10.1111/ijag.16609 , in press.
- S. Machida, K. Maeda, K. Katsumata and A. Yasumori, ACS Omega, 2022, 7, 33266–33772 CrossRef CAS PubMed.
- K. Maeda and A. Yasumori, Mater. Lett., 2016, 180, 231–234 CrossRef CAS.
- K. Maeda and A. Yasumori, Mater. Lett., 2017, 206, 241–244 CrossRef CAS.
- K. Maeda, K. Iwasaki, S. Urata, K. Akatsuka and A. Yasumori, J. Am. Ceram. Soc., 2019, 102, 5535–5545 CrossRef CAS.
- K. Maeda, K. Akatsuka, G. Okuma and A. Yasumori, Crystals, 2021, 206(11), 393 CrossRef.
- G. Okuma, K. Maeda, S. Yoshida, A. Takeuchi and F. Wakai, Sci. Rep., 2022, 12, 6994 CrossRef CAS PubMed.
- K. Maeda and A. Yasumori, J. Non-Cryst. Solids, 2015, 427, 152–159 CrossRef CAS.
- G. Poirier, F. S. Ottoboni, F. C. Cassanjes, Á. Remonte, Y. Messaddeq and S. J. L. Ribeiro, J. Phys. Chem. B, 2008, 112, 4481–4487 CrossRef CAS.
- S. Machida, K. Katsumata and A. Yasumori, RSC Adv., 2021, 11, 38473 RSC.
- S. Machida, K. Katsumata and A. Yasumori, RSC Adv., 2022, 12, 15435 RSC.
- K. Maeda and A. Yasumori, J. Non-Cryst. Solids, 2016, 434, 13–22 CrossRef CAS.
- S. Watanabe, Y. Osawa, S. Machida, K. Katsumata, A. Yasumori, K. Takahashi, K. Deguchi, S. Ohki and H. Segawa, J. Non-Cryst. Solids, 2021, 573, 121107 CrossRef CAS.
- Q. Luo, X. Fan, X. Qiao, H. Yang, M. Wang and X. Zhang, J. Am. Ceram. Soc., 2009, 92, 942–944 CrossRef CAS.
- L. Żur, J. Mol. Struct., 2013, 1041, 50–54 CrossRef.
- T. Ohgaki, A. Higashida, K. Soga and A. Yasumori, J. Electrochem. Soc., 2007, 154, J163–J166 CrossRef CAS.
- W. B. Im, Y.-I. Kim and D. Y. Jeon, Chem. Mater., 2006, 18, 1190–1195 CrossRef CAS.
- L. Zhang, H. Yamada, Y. Imai and C.-N. Xu, J. Electrochem. Soc., 2008, 155, J63–J65 CrossRef CAS.
- F. C. Lu, L.-J. Bai, B.-Z. Yang and Z.-P. Yang, ECS J. Solid State Sci. Technol., 2013, 2, R254–R257 CrossRef CAS.
- M. Ma, D. Zhu, C. Zhao, T. Han, S. Cao and M. Tu, Opt. Commun., 2012, 285, 665–668 CrossRef CAS.
- L. Sun, Q. Wnag, X. Zhang, Z. Yang, J. Cheng, A. Sidike and J. He, J. Lumin., 2020, 222, 117058 CrossRef CAS.
- S. Machida, R. Hashimoto, T. Yoshida and M. Ogawa, J. Colloid Interface Sci., 2014, 420, 66–69 CrossRef CAS.
- M. Ogawa and M. Hiramine, Cryst. Growth Des., 2014, 14, 1516–1519 CrossRef CAS.
- K. Akatsuka, A. Yasumori and K. Maeda, Mater. Lett., 2019, 242, 163 CrossRef CAS.
- T. Otsuka, M. Brehl, R. M. Cicconi, D. de Ligny and T. Hayakawa, Materials, 2021, 14, 952 CrossRef CAS PubMed.
- N. Miyamoto and T. Nakato, Isr. J. Chem., 2012, 52, 881–894 CrossRef CAS.
- M. Ogawa, K. Saito and S. Sohmiya, Dalton Trans., 2014, 43, 10340–10354 RSC.
- C. Detellier, Chem. Rec., 2018, 868–877 CrossRef CAS PubMed.
- R. V. Tominov, Z. E. Vakulov, N. Polupanov, A. Saenko, V. I. Avilov, O. A. Ageev and V. A. Smirnov, Nanomaterials, 2022, 12, 455 CrossRef CAS PubMed.
- K. T. Jacob and A. Rajput, J. Chem. Eng. Data, 2016, 61, 1710–1717 CrossRef CAS.
- S. D. Stookey, J. Int. Eng. Chem., 1959, 51, 805–808 CAS.
- K. Maeda and A. Yasumori, JAP Patent 6769476, Oct. 14, 2020.
- J. J. Yang, J. P. Strachan, F. Miao, M.-X. Zhang, M. D. Pickett, W. Yi, D. A. A. Ohlberg, G. Medeiros-Ribeiro and R. S. Williams, Appl. Phys. A, 2011, 102, 785–789 CrossRef CAS.
| This journal is © The Royal Society of Chemistry 2022 |