 Open Access Article
Investigation on dyeing mechanism of modified cotton fiber
Xiaolei Zhai,
Jinwei Ma,
Yanxiu Wu,
Tianjie Niu,
Deshuai Sun,
Long Fang * and
Xiaodong Zhang
School of Chemistry and Chemical Engineering, Qingdao University, Qingdao 266071, China. E-mail: fanglong78@hotmail.com
First published on 4th November 2022
Abstract
Cotton fabrics have been chemically modified with two cationic compounds. They were 3-chloro-2-hydroxypropyltrimethylammonium chloride and the copolymer of dimethyl diallyl ammonium chloride and allyl glycidyl ether, respectively. Under the conditions of no inorganic salt, two modified cotton fabrics were dyed with reactive dyes. The dyeing mechanism of two modified cotton fabrics was investigated in comparison with traditional dyeing of untreated cotton fabrics. It involved the adsorption type, adsorption thermodynamics, and adsorption kinetics between reactive dyes and modified cotton fabrics in the dyeing process. The color-fixing process of modified cotton fibers was also studied in detail. The results showed that there were obvious distinctions between the salt-free dyeing mechanism of modified cotton fabrics and traditional dyeing of untreated cotton fabrics. The adsorption isotherm model of the two modified cotton fabrics conformed to the Langmuir-model. The kinetic model of two modified cotton fabrics conformed to the pseudo-second-order kinetic model. The adsorption of modified cotton fabrics was an endothermic process. The adsorption of unmodified cotton fabrics was an exothermic process. These will serve as a theoretical basis of the industrial production of salt-free dyeing of modified cotton fiber.
1 Introduction
Cotton fiber has been widely used in printing and dyeing industries due to its benefits such as comfort, air permeability, and abrasion resistance.1–3 Reactive dyes have the advantages of bright colors and excellent fastness. They are some of the most widely used dyes in cotton fabric dyeing.4–9 Recently, a large amount of inorganic salts were added to the dyeing process to eliminate electrostatic repulsion and made the dye molecules come into close contact with the fabrics' surface.10,11 However, after dyeing, inorganic salts still existed in dyeing wastewater, which increased the difficulty of treatment and dyeing cost.12–14 In order to reduce the discharge of waste water and solve the problems of low dye exhaustion, many attempts have been made to improve the dyeability of cotton fiber by relevant researchers at home and abroad.10,15–22 Cotton fabrics were chemically modified by cationic additives, and cationic groups were introduced into the cotton fabrics. It could raise interactions between cotton fiber and reactive dyes and increase dye utilization efficiency. It is one of the current research directions.20,23–30 However, on the elimination or reduction of salt in reactive dyeing, chemical modification of cotton fabrics had problems of dyeing level property, poor color fastness and high dyeing cost.27,31–35 So, it had not been widely accepted by the industry.36The dyeing of cotton fabrics with reactive dye was divided into three steps. Firstly, the dye molecules diffused on the fiber surface and then entered the diffusion boundary layer. When the dye molecules were closed to the fiber surface and passed through the boundary layer, the dye molecules were rapidly adsorbed onto the fiber surface through the affinity between the dye molecules and the fiber. Secondly, because of the dye concentration inside and outside the fiber, the dye molecules diffused from the surface of the fiber to the interior. Finally, under the action of alkali, the reactive dye molecule could react with the hydroxyl anions of cellulose molecules to form chemical bonds.37 And cotton fiber was thoroughly stained.
In our previous work, the cationic copolymer of dimethyl diallyl ammonium chloride and allyl glycidyl ether (PDA) was developed.38 It could be utilized for modifying cotton fiber and had good flocculating properties to avoid secondary pollution. The total dye utilization of the reactive dyes on the modified cotton fabrics without adding salts was improved greatly upon comparison with the untreated fabrics. And the modified cotton fabrics also showed better levelness properties and color fastness. It might achieve an economical and eco-friendly dyeing process.38
PDA and 3-chloro-2-hydroxypropyltrimethylammonium chloride (CHPTAC) were used for cationic modification of cotton fabrics, respectively. The dyeing mechanism was analyzed, and modified cotton fabrics and untreated cotton fabrics were compared. Therefore, this work aimed to study the adsorption mode of C.I. Reactive Black 5 on cotton fabrics. The adsorption process, adsorption kinetics and adsorption thermodynamics were explored. The best fitting equilibrium isotherms were determined by the Freundlich-model and the Langmuir-model.18,39,40 The differences in fixation and penetration of dyes of the three cotton fabrics were discussed.
2 Experimental section
2.1 Material
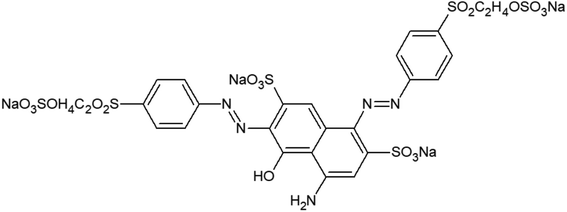
The bleached woven cotton fabrics (125 g m−2) provided by the Hongli Dyeing Corporation (Shandong, China). Dimethyl diallyl ammonium chloride (DMDAAC, 60% purity) was purchased from the Adamas Reagent Co., Ltd. (Shanghai, China). Allyl glycidyl ether (AGE), potassium persulfate (KPS), acetic acid, sodium carbonate, sodium hydroxide, and sodium sulfate anhydrous were all of reagent grade purchased from the Sinopharm Chemical Regent Co., Ltd. (Beijing, China). 3-Chloro-2-hydroxypropyltrimethylammonium chloride (CHPTAC) was purchased from McLean Chemical Reagent Company. The C.I. Reactive Black 5 dye was provided by the Zhejiang Jinhua Group Co., Ltd. (Zhejiang, China). The molecular structure of C.I. Reactive Black 5 was presented in Fig. 1.2.2 Chemical modification of cotton fabrics
![[thin space (1/6-em)]](https://www.rsc.org/images/entities/char_2009.gif) :
:![[thin space (1/6-em)]](https://www.rsc.org/images/entities/char_2009.gif) 1. Under certain stirring speed, the mixture was transferred to the glass reactor. Potassium persulfate was dissolved in a small amount of distilled water. Potassium persulfate solution was added to the reaction system. The reaction system temperature was kept at 80 °C. After stirring for 4 h, the mixture was transferred to a beaker and cooled to room temperature. The polymer was precipitated by acetone and was dried at 50 °C. The cationic degree of the prepared polymer was 3.034 mmol g−1. The weight-average molar mass was 2315 g mol−1.38
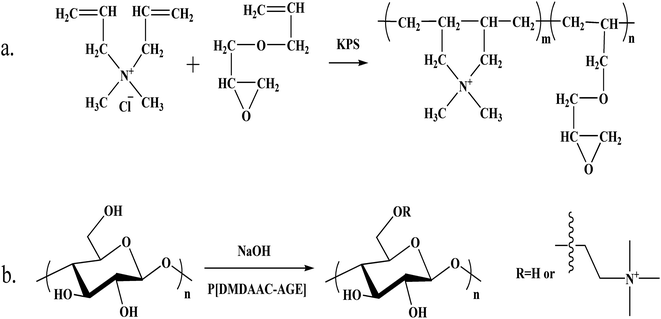
1. Under certain stirring speed, the mixture was transferred to the glass reactor. Potassium persulfate was dissolved in a small amount of distilled water. Potassium persulfate solution was added to the reaction system. The reaction system temperature was kept at 80 °C. After stirring for 4 h, the mixture was transferred to a beaker and cooled to room temperature. The polymer was precipitated by acetone and was dried at 50 °C. The cationic degree of the prepared polymer was 3.034 mmol g−1. The weight-average molar mass was 2315 g mol−1.380.7 g L−1 PDA solution was prepared and the pH value of the polymer solution was set to 13 with sodium hydroxide solution (1 mol L−1). Cotton fabrics were immersed in solution and stirred at room temperature for 6 h. The cotton fabrics after reaction were washed with distilled water and dried in air.38 The reaction equation of PDA and chemical modification process of cotton fabrics were summarized in Fig. 2.
![[thin space (1/6-em)]](https://www.rsc.org/images/entities/char_2009.gif) :
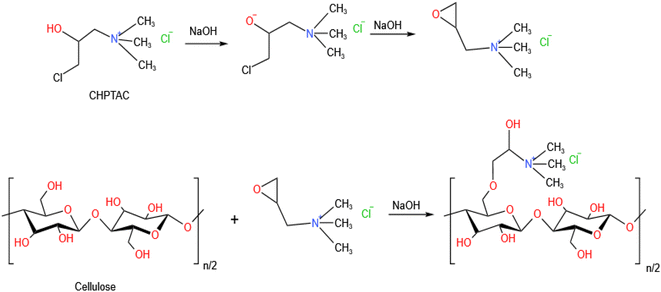
:![[thin space (1/6-em)]](https://www.rsc.org/images/entities/char_2009.gif) 30. CHPTAC solution with a concentration of 60 g L−1 was formulated and the temperature was raised to 80 °C. Cotton fabrics were dipped into the solution. After 10 minutes, sodium hydroxide with a concentration of 15 g L−1 was added to the modification solution, and the modifying process was performed for 50 minutes. After the reaction, cotton fabrics were washed with distilled water for 5 minutes, and then dried naturally at room temperature. The modification process of cotton fabrics by CHPTAC was shown in Fig. 3.
30. CHPTAC solution with a concentration of 60 g L−1 was formulated and the temperature was raised to 80 °C. Cotton fabrics were dipped into the solution. After 10 minutes, sodium hydroxide with a concentration of 15 g L−1 was added to the modification solution, and the modifying process was performed for 50 minutes. After the reaction, cotton fabrics were washed with distilled water for 5 minutes, and then dried naturally at room temperature. The modification process of cotton fabrics by CHPTAC was shown in Fig. 3.
2.3 Adsorption experiment
The dyeing process of modified cotton fabrics and untreated cotton fabrics was made at a liquor ratio of 1![[thin space (1/6-em)]](https://www.rsc.org/images/entities/char_2009.gif) :
:![[thin space (1/6-em)]](https://www.rsc.org/images/entities/char_2009.gif) 100 in a water bath. The effects on the dyeing results were investigated by changing the concentration of dyes, the temperature and dyeing time. The absorbance of the dye solution before and after dyeing (ultraviolet-visible spectrophotometer) was verified to calculate the dye exhaustion rate, adsorption capacity, and other parameters. Dye adsorption capacity (Q), dye residual concentration (Ce), and dye exhaustion rate (E) were calculated according to formula (1)–(3).
100 in a water bath. The effects on the dyeing results were investigated by changing the concentration of dyes, the temperature and dyeing time. The absorbance of the dye solution before and after dyeing (ultraviolet-visible spectrophotometer) was verified to calculate the dye exhaustion rate, adsorption capacity, and other parameters. Dye adsorption capacity (Q), dye residual concentration (Ce), and dye exhaustion rate (E) were calculated according to formula (1)–(3).| Q = C0 × V × E% | (1) |
| Ce = C0 × (1 − E%) | (2) |
| E = (A0 − A1)/A0 × 100% | (3) |
2.4 Adsorption isotherm
To investigate the adsorption isotherms of reactive dyes on modified cotton fabrics, dyeing processes were conducted at a series of concentrations ranging from 30 to 360 mg L−1 for 3 h at 30 °C. A liquor ratio of 100![[thin space (1/6-em)]](https://www.rsc.org/images/entities/char_2009.gif) :
:![[thin space (1/6-em)]](https://www.rsc.org/images/entities/char_2009.gif) 1 was used to achieve an infinite dye bath. The absorbance of the initial dye bath (A0) and the exhausted dye bath (A1) were measured using an ultraviolet-visible (UV-2600) spectrophotometer at the maximum absorption wavelength of 598 nm. The adsorption capacity (Qe) of reactive dyes on cotton fabrics and the residual dye (Ce) in the dye bath was calculated.
1 was used to achieve an infinite dye bath. The absorbance of the initial dye bath (A0) and the exhausted dye bath (A1) were measured using an ultraviolet-visible (UV-2600) spectrophotometer at the maximum absorption wavelength of 598 nm. The adsorption capacity (Qe) of reactive dyes on cotton fabrics and the residual dye (Ce) in the dye bath was calculated.
For comparison, the adsorption isotherm of reactive dye on the untreated cotton fabrics was discussed with the conventional method (adding 50 g L−1 NaCl). The dyeing bath was heated to 30 °C and 50 °C, respectively.
2.5 Kinetic model
A certain mass of modified cotton fabrics by PDA was weighed. Reactive dye solution was prepared at a concentration of 2 g L−1. The dye bath was heated to 30 °C and 50 °C, respectively, and then the modified cotton fabrics were added. After dyeing, the temperature was maintained for 300 minutes, and samples were collected every 10 minutes. The adsorption process of CHPTAC on modified cotton fabrics was consistent with that of PDA modified cotton fabrics (PDA-cotton). However, the adsorption experiment of raw cotton fabrics was slightly different from that of modified cotton fabrics. 50 g L−1 sodium chloride was added and stirred until completely dissolved. The dyeing bath was heated to 30 °C and 50 °C, respectively. Other experimental parts were the same as for modified cotton fabrics.2.6 The effect of fixation time on fixation rate
A certain mass of PDA-cotton was weighed and broke down into seven equal parts. A reactive dye solution with a concentration of 3 g L−1 was prepared. A liquor ratio of 30![[thin space (1/6-em)]](https://www.rsc.org/images/entities/char_2009.gif) :
:![[thin space (1/6-em)]](https://www.rsc.org/images/entities/char_2009.gif) 1 was used for the dyeing. The dyeing was carried out at 25 °C. After 30 minutes of dyeing, the dye bath was heated to 60 °C. 20 g L−1 of sodium carbonate was added. PDA-cotton were fixed for 0 min, 10 min, 20 min, 30 min, 40 min, 50 min and 60 min, respectively. The experimental process of CHPTAC modified cotton fabrics (CHPTAC-cotton) was consistent with the experimental process of PDA-cotton. However, the experimental process of raw cotton fabrics was slightly different from that of modified cotton fabrics. 50 g L−1 sodium chloride was added after dyeing for 10 minutes and 20 minutes respectively. Other experimental parts were the same as for modified cotton fabrics.
1 was used for the dyeing. The dyeing was carried out at 25 °C. After 30 minutes of dyeing, the dye bath was heated to 60 °C. 20 g L−1 of sodium carbonate was added. PDA-cotton were fixed for 0 min, 10 min, 20 min, 30 min, 40 min, 50 min and 60 min, respectively. The experimental process of CHPTAC modified cotton fabrics (CHPTAC-cotton) was consistent with the experimental process of PDA-cotton. However, the experimental process of raw cotton fabrics was slightly different from that of modified cotton fabrics. 50 g L−1 sodium chloride was added after dyeing for 10 minutes and 20 minutes respectively. Other experimental parts were the same as for modified cotton fabrics.
2.7 The washing procedure
Cotton fabrics were washed with soapy water (2 g L−1) at a liquid ratio of 30![[thin space (1/6-em)]](https://www.rsc.org/images/entities/char_2009.gif) :
:![[thin space (1/6-em)]](https://www.rsc.org/images/entities/char_2009.gif) 1 for 10 minutes. Cotton fabrics were washed with distilled water and dried at room temperature.
1 for 10 minutes. Cotton fabrics were washed with distilled water and dried at room temperature.
2.8 Dyeability
Single fiber of PDA-cotton, CHPTAC-cotton, and raw cotton fabrics were taken out. Cotton fabrics were wrapped in wool and sliced with a Hastelloy slicer. Under the Leica microscope (Leica Microsys-tem Co, Ltd., German), the cross-sectional appearance of the cotton fabrics was examined to determine its dye permeability.3 Results and discussion
3.1 Adsorption process of reactive dyes on cotton fabrics
The constant temperature dyeing rate curves of PDA-cotton, CHPTAC-cotton, and raw cotton fabrics were shown in Fig. 4.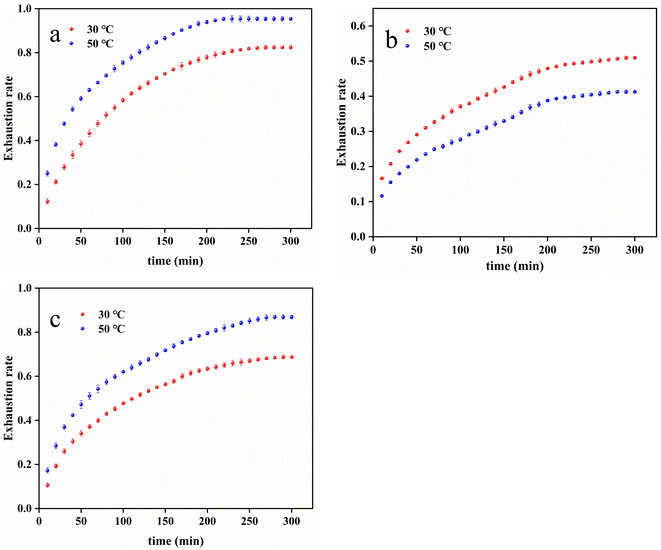 | ||
| Fig. 4 The constant temperature dyeing rate curve of (a) PDA-cotton, (b) raw cotton fabrics, and (c) CHPTAC-cotton. | ||
From Fig. 4(a), it could be seen that at 50 °C, the dyeing exhaustion rate of the PDA-cotton rapidly increased with the dyeing time in the initial stage. It demonstrated the adsorption process had a positive correlation with the adsorption time. The dye was adsorbed faster by modified cotton fabrics in the first 200 minutes. After about 250 minutes, the dyeing exhaustion rate remained basically unchanged. It showed that the adsorption process of reactive dyes on cotton fabrics gradually reached equilibrium. The reactive dye might already have covered on the surface of cotton fabrics.41 This might be because the cation position on the modified cotton fabrics was limited. When the adsorption sites were filled, the reactive dyes were no longer adsorbed by the modified cotton fabrics.
As could be observed in Fig. 4(c), similar results were also obtained in the adsorption experiments on CHPTAC-cotton. However, from Fig. 4(b), it could be noted that the amount of dye adsorption on raw cotton fabrics increased slowly and continuously with time, and did not reach adsorption equilibrium. From the Fig. 4(a), the equilibrium adsorption capacity at 30 °C was 16.48 mg g−1, and the equilibrium adsorption capacity at 50 °C was 18.54 mg g−1. The equilibrium adsorption capacity of PDA-cotton at 30 °C was less than that at 50 °C. The adsorption results of CHPTAC-cotton and PDA-cotton at 30 °C and 50 °C were roughly the same, but its equilibrium adsorption capacity was lower than that of PDA-cotton. The equilibrium adsorption capacity of CHPTAC-cotton at 30 °C was 13.74 mg g−1, and the equilibrium adsorption capacity at 50 °C was 17.37 mg g−1. The traditional dyeing process of raw cotton fabrics was exothermic. When the temperature raised, dyes were sometimes difficult to adsorb onto cotton fabrics.
According to the slope of the dyeing curve of the PDA-cotton, it could be seen that the lower the temperature, the lower the dyeing rate. Therefore, for the level dyeing of cotton fabrics, the dyeing temperature could be appropriately lowered at the beginning of dyeing. In this way, the dye could be dyed slowly and evenly.
3.2 Investigation of the adsorption isotherm
The equilibrium adsorption isotherm was necessary to describe the interactive behavior between dyeing solution and cotton fiber. The Langmuir-model was applied in many dye adsorption processes and was expressed by formula (4).| Ce/Q = 1/(Q0 × b) + Ce/Q0 | (4) |
The Freundlich-model was expressed by formula (5).
ln![[thin space (1/6-em)]](https://www.rsc.org/images/entities/char_2009.gif) Q = 1/n × ln Q = 1/n × ln![[thin space (1/6-em)]](https://www.rsc.org/images/entities/char_2009.gif) Ce + ln Ce + ln![[thin space (1/6-em)]](https://www.rsc.org/images/entities/char_2009.gif) K K
| (5) |
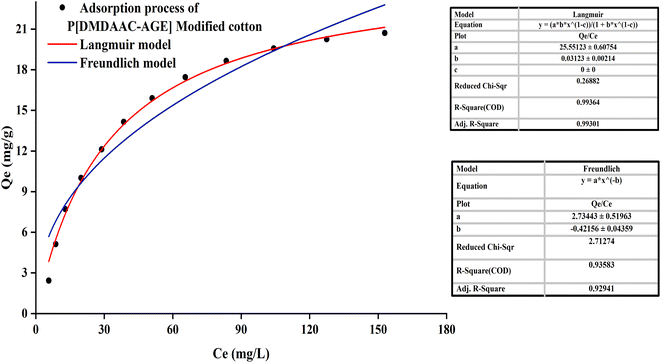
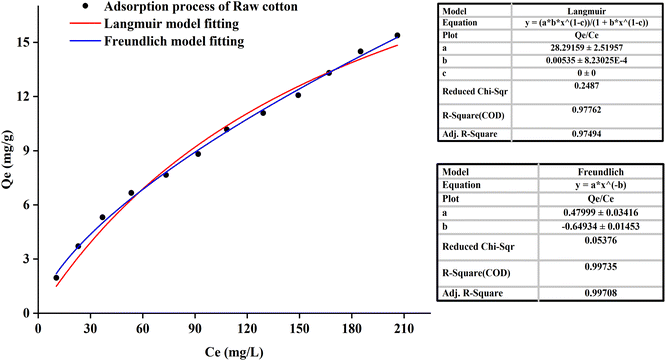
The equilibrium adsorption isotherm was essential to describe the interaction between solute and adsorbent.42 It could be observed in Fig. 5 that for the PDA-cotton, the correlation coefficient of adsorption curve fitting the Langmuir-model (R = 0.9936) was greater than that of the Freundlich-model (R = 0.9358). It suggested that the adsorption patterns of reactive dye on the PDA-cotton were basically Langmuir-type adsorption. After cotton fabrics were modified with PDA, there were many localized adsorption sites on PDA-cotton. Therefore, in the salt-free dyeing process of the modified cotton fabrics, the adsorption of reactive dyes was assisted by ionic attraction between the cationic sites of modified cotton fabrics and the anions of reactive dyes. It resulted in a Langmuir-type adsorption.
It could be seen from Fig. 6 that the correlation coefficient (R = 0.9776) of the original cotton fabrics adsorption curve fitting the Langmuir-model was smaller than the correlation coefficient (R = 0.9971) of the Freundlich-model. Raw cotton fabrics were basically in line with the Freundlich-model. It demonstrated that the adsorption process was mainly based on the non-localized adsorption of multi-molecular layers. The reactive dye was adsorbed on cotton fabrics through van der Waals force, hydrogen bonding force, etc., and the dye molecule was not fixed in a specific position.
Freundlich adsorption was physical adsorption process. And the characteristic of Freundlich adsorption was that the amount of dye adsorbed into the fiber increased with the increase of dye concentration in the dyeing solution. At the same time, the trend would become smaller and had no clear boundaries. It also explained why raw cotton fabrics did not reach adsorption equilibrium.
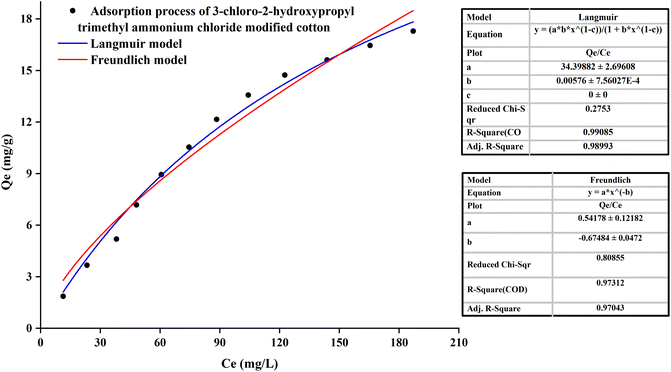
It could be noted from Fig. 7 that for the CHPTAC-cotton, the fitting results of the isothermal adsorption were roughly the same as those of PDA-cotton.
3.3 Adsorption thermodynamics of reactive dyes on cationic cotton fabrics
The standard affinity, the enthalpy change and the entropy variation were often used to describe the dyeing capability of given dyestuff on a solid substrate. These values were dependent on the properties of the dye and the cotton fiber when the temperature, the pressure and the quantity of the other components were constant in certain dyeing systems.42 The standard affinity (Δμ) was the standard chemical potential difference between the dye bath and the fabrics, which could be used to measure the trend of dye adsorption onto the fabrics. The standard affinity (Δμ) was expressed by formula (6).| −Δμ = R × T × ln([D]f/[D]s) | (6) |
The enthalpy change (ΔH) and the entropy change (ΔS) were expressed by formula (7) and (8).
| ΔH = (T2 × Δμ1 − T1 × Δμ2) × (T2 − T1) | (7) |
| Δμ = ΔH − T × ΔS | (8) |
The calculated dyeing affinity (−Δμ), enthalpy change (ΔH), and entropy change (ΔS) at 30 °C and 50 °C are shown in Table 1.
| Type | Temperature K | −Δμ kJ mol−1 | ΔH kJ mol−1 | ΔS kJ mol−1 |
|---|---|---|---|---|
| PDA-cotton | 303 | 18.523 | 40.593 | 0.195 |
| 323 | 22.425 | |||
| Raw cotton fabrics | 303 | 15.351 | −22.686 | −0.024 |
| 323 | 14.866 | |||
| CHPTAC-cotton | 303 | 17.088 | 41.722 | 0.194 |
| 323 | 20.970 |
The standard affinity was a measure of the tendency of the dye moving from its standard state in solution to its standard state in fiber.42 The values of Δμ and ΔH of raw cotton fabrics were negative. It shown that the adsorption process of reactive dye on cotton fabrics was a spontaneous and exothermic process. However, the dyeing results of PDA-cotton and CHPTAC-cotton were opposite with those of raw cotton fabrics. The enthalpy change (ΔH) values of PDA-cotton and CHPTAC-cotton were 40.593 kJ mol−1 and 41.722 kJ mol−1, which were greater than zero, respectively.
The enthalpy change in adsorption processes were positive. The results indicated that the dye adsorbed on modified cotton fabrics were endothermic process. When the temperature was low, it was difficult to enter the amorphous region of the cotton fabrics. But when the temperature increased, the dyeing molecules easily diffused into the fabrics and combined with the modified cotton fabrics.
Entropy was one of the important parameters to characterize the state of matter in thermodynamics. Its physical meaning was a measure of the degree of system confusion.42 The entropy change (ΔS) values of raw cotton fabrics at 30 °C and 50 °C were −0.024 kJ mol−1, which were less than zero. This indicated that the system disorder caused by raw cotton fabrics dyeing was decreased. The dyeing entropy of raw cotton fabrics was the same as most dyeing systems.
The entropy change (ΔS) values of PDA-cotton at 30 °C and 50 °C were 0.195 kJ mol−1, which were greater than zero, respectively. The entropy change (ΔS) values of CHPTAC-cotton at 30 °C and 50 °C were 0.194 kJ mol−1, which were also greater than zero. This indicated that the system disorder caused by modified cotton fabrics dyeing was increased.
3.4 Kinetic parameters
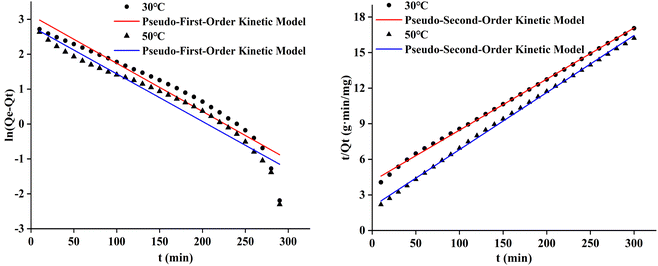
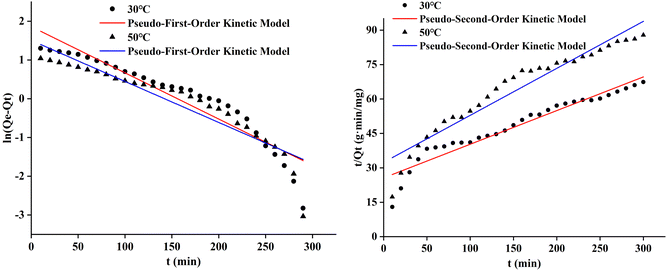
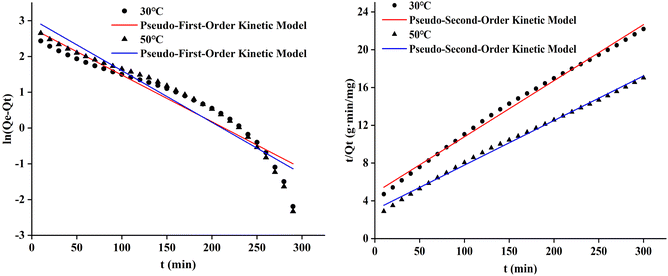
In order to further explore the diffusion process of reactive dye in the modified cotton fabrics, the pseudo-first-order and pseudo-second-order models were appiled to analyze the experimental data.42 The linear forms of the pseudo-first-order kinetics equation and the pseudo-second-order kinetics equation were shown in formula (9) and (10), respectively.
ln(Qe − Qt) = ln![[thin space (1/6-em)]](https://www.rsc.org/images/entities/char_2009.gif) Qe − k1 × t Qe − k1 × t
| (9) |
| t/Qt = 1/(k2 × Qe2) + t/Qe | (10) |
The pseudo-first-order and pseudo-second-order adsorption kinetic curves of the three cotton fabrics were presented in Fig. 8–10, respectively. And the kinetic parameters determined from slopes and intercepts of the curves were provided in Tables 2 and 3.
| Modification status | Temperature (°C) | Qe,exp (mg g−1) | Pseudo-first-order kinetic | ||
|---|---|---|---|---|---|
| k1 (min−1) | Qe,cal (mg g−1) | R2 | |||
| PDA-cotton | 30 | 17.59 | 1.378 × 10⁻² | 22.61 | 0.9289 |
| 50 | 18.50 | 1.364 × 10⁻² | 16.48 | 0.9416 | |
| CHPTAC-cotton | 30 | 13.52 | 1.306 × 10⁻² | 16.26 | 0.9647 |
| 50 | 17.62 | 1.444 × 10⁻² | 20.09 | 0.9056 | |
| Raw cotton fabrics | 30 | 10.19 | 1.193 × 10⁻² | 11.59 | 0.8408 |
| 50 | 8.25 | 1.059 × 10⁻² | 10.60 | 0.9139 | |
| Modification status | Temperature (°C) | Qe,exp (mg g−1) | Pseudo-second-order kinetic | ||
|---|---|---|---|---|---|
| k2 (min−1) | Qe,cal (mg g−1) | R2 | |||
| PDA-cotton | 30 | 17.59 | 1.262 × 10⁻³ | 17.56 | 0.9916 |
| 50 | 18.50 | 1.681 × 10⁻³ | 18.90 | 0.9999 | |
| CHPTAC-cotton | 30 | 13.52 | 1.201 × 10⁻³ | 14.32 | 0.9998 |
| 50 | 17.62 | 1.302 × 10⁻³ | 17.76 | 0.9992 | |
| Raw cotton fabrics | 30 | 10.19 | 8.395 × 10⁻⁴ | 15.08 | 0.9502 |
| 50 | 8.25 | 1.297 × 10⁻³ | 10.76 | 0.9784 | |
Tables 2 and 3 showed how the data in Fig. 8–10 were calculated.
It could be seen from Table 2 and 3 that the correlation coefficient (R2) value of modified cotton fabrics fitting pseudo-second-order kinetic model was higher than that of pseudo-first-order kinetic model. At 30 °C, the correlation coefficient (R2) values of PDA-cotton and CHPTAC-cotton were 0.9916 and 0.9998, respectively. At 50 °C, the correlation coefficient (R2) of the pseudo-second-order kinetic model were 0.9999 and 0.9992, respectively. The calculated equilibrium adsorption capacity of dye was closer to that observed in the pseudo-second-order kinetic model. These results suggested that the absorption of reactive dye on modified cotton fabrics obeyed the pseudo-second-order kinetics model. The pseudo-second-order kinetics model could better describe the absorption and diffusion process of reactive dye into modified cotton fabrics. The correlation coefficient (R2) of the pseudo-second-order kinetic model of raw cotton fabrics adsorption was greater than that of the pseudo-first-order kinetic model.
3.5 The activation energy
The activation energy could be used to measure the difficulty of dyeing. The activation energy was shown in formula (11).
ln![[thin space (1/6-em)]](https://www.rsc.org/images/entities/char_2009.gif) k = ln k = ln![[thin space (1/6-em)]](https://www.rsc.org/images/entities/char_2009.gif) A − Ea/RT A − Ea/RT
| (11) |
| Fabric | Ea |
|---|---|
| PDA-cotton | 11.674 |
| CHPTAC-cotton | 9.107 |
| Raw cotton fabrics | 17.714 |
Compared with the conventional dyeing activation energy, the dyeing activation energy of two modified cotton fabrics decreased. It shown that the modification of cotton fabrics reduced the dye diffusion resistance and made the dyeing process easy.
3.6 Diffusion coefficient
The diffusion coefficient of dyes was usually used to qualitatively analyze the diffusion properties of dyes in fibers. If the dye diffusion rate was high, the time required for complete dyeing of the fiber would be shorter. The diffusion coefficient of dye was calculated by Hill formula (12).
 | (12) |
| Time (min) | Diffusion coefficients D/(×10−14 (m2 s−1)) | |||||
|---|---|---|---|---|---|---|
| PDA-cotton | CHPTAC-cotton | Raw cotton fabrics | ||||
| 30 °C | 50 °C | 30 °C | 50 °C | 30 °C | 50 °C | |
| 10 | 7.6129943 | 12.458989 | 7.8844850 | 10.151143 | 2.1240030 | 1.5882892 |
| 20 | 6.5748586 | 9.5786854 | 7.1582825 | 8.3639705 | 1.3070788 | 0.9926808 |
| 30 | 5.7674199 | 8.7525517 | 6.4320799 | 7.2440087 | 0.9803091 | 0.7941446 |
| 40 | 5.1906779 | 7.4686953 | 5.6540057 | 6.2193627 | 0.8169242 | 0.6948765 |
| 50 | 4.7754237 | 6.5108267 | 5.0626693 | 5.5473856 | 0.7188933 | 0.6353157 |
| 60 | 4.4697504 | 5.7829359 | 4.5992829 | 5.0040849 | 0.7080010 | 0.5956084 |
| 70 | 4.2266949 | 5.2055993 | 4.2386517 | 4.5547385 | 0.7002208 | 0.5483379 |
| 80 | 4.0011476 | 4.7223589 | 3.9941141 | 4.2177287 | 0.6739625 | 0.5294297 |
| 90 | 3.7872724 | 4.3465052 | 3.7347560 | 3.9079520 | 0.6716932 | 0.5294297 |
| 100 | 3.6161723 | 4.0056321 | 3.5480182 | 3.6458333 | 0.6698778 | 0.5029582 |
| 110 | 3.4604519 | 3.7145569 | 3.3575080 | 3.4183749 | 0.6386862 | 0.4812997 |
| 120 | 3.3018475 | 3.4719943 | 3.1987494 | 3.2288262 | 0.6263086 | 0.4522212 |
| 130 | 3.1543350 | 3.2770543 | 3.0484547 | 3.0574409 | 0.6158352 | 0.4276163 |
| 140 | 3.0278954 | 3.1003937 | 2.9196307 | 2.9309640 | 0.5951876 | 0.4065264 |
| 150 | 2.9067796 | 2.9472878 | 2.7941508 | 2.8118191 | 0.5664008 | 0.3970723 |
| 160 | 2.8008035 | 2.8049472 | 2.6843559 | 2.7075674 | 0.5412123 | 0.3815008 |
| 170 | 2.6971169 | 2.6793525 | 2.6240933 | 2.6071703 | 0.5189871 | 0.3805276 |
| 180 | 2.5953389 | 2.5602702 | 2.5359454 | 2.5099854 | 0.5173853 | 0.3760127 |
| 190 | 2.5042744 | 2.4537228 | 2.4461560 | 2.4230306 | 0.4987537 | 0.3751737 |
| 200 | 2.4136652 | 2.3578302 | 2.3549712 | 2.3376225 | 0.4819853 | 0.3639829 |
| 210 | 2.3316855 | 2.2710702 | 2.2724706 | 2.2603485 | 0.4745940 | 0.3609748 |
| 220 | 2.2492937 | 2.1921975 | 2.1974701 | 2.1900995 | 0.4678748 | 0.3592559 |
| 230 | 2.1740665 | 2.1143586 | 2.1289913 | 2.1197428 | 0.4627398 | 0.3510349 |
| 240 | 2.0978990 | 2.0430063 | 2.0575739 | 2.0612064 | 0.4619237 | 0.3474382 |
| 250 | 2.0278248 | 1.9773622 | 1.9918699 | 2.0016339 | 0.4574775 | 0.3388354 |
| 260 | 1.9564863 | 1.9167676 | 1.9312200 | 1.9411450 | 0.4461663 | 0.3308936 |
| 270 | 1.8904321 | 1.8556997 | 1.8750627 | 1.8851367 | 0.4356929 | 0.3235404 |
| 280 | 1.8229166 | 1.7989938 | 1.8155064 | 1.8229166 | 0.4259676 | 0.3214395 |
| 290 | 1.7600574 | 1.7508183 | 1.7600574 | 1.7600574 | 0.4169130 | 0.3194834 |
| 300 | 1.7013888 | 1.7013888 | 1.7013888 | 1.7013888 | 0.4084621 | 0.3132459 |
It could be seen from Table 5 that the average diffusion coefficient of modified cotton fabrics was smaller than that of raw cotton fabrics. The possible reason was the combination of cationic additives and hydroxyl groups on cellulose fibers. The diffusion coefficient of raw cotton fabrics and modified cotton fabrics would increase to a certain extent when the temperature was increased. The reason might be that the thermal motion of dye molecules accelerated with the increase of temperature. As a result, the diffusion coefficient of dye molecules increased.
3.7 Half-dyeing time
The half-dyeing time was the time required to reach half the equilibrium adsorption capacity and was expressed by t1/2.42 When formula (13) and (14) were brought into formula (10), the calculation equation of half-dyeing time was shown in formula (15), and the data were calculated and sorted, as shown in Table 6.| t = t1/2 | (13) |
| Qt = Qe/2 | (14) |
| t1/2 = 1/(k × Qe) | (15) |
| Modification status | Temperature (°C) | t1/2 (min) |
|---|---|---|
| PDA-cotton | 30 | 45.12 |
| 50 | 31.48 | |
| CHPTAC-cotton | 30 | 58.14 |
| 50 | 43.25 | |
| Raw cotton fabrics | 30 | 99.61 |
| 50 | 65.58 |
It could be seen from Table 6 that the half-dyeing time of three cotton fabrics all decreased with the increase of temperature. As the temperature rose from 30 °C to 50 °C, cotton fabrics began to swell. The thermal motion of dye molecules was also accelerated. The dyeing speed was increased, and the corresponding half dyeing time was shortened.
3.8 The effect of color fixation rate
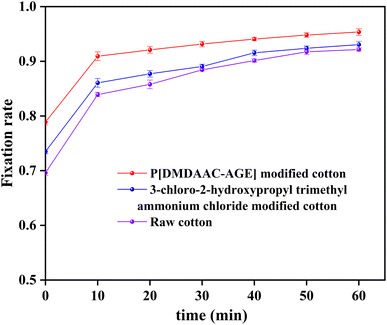
The fixation rate of the three cotton fabrics was calculated by formula (16) and plotted as a graph. As shown in Fig. 11.| F = (A0 − A1 − A2)/(A0 − A1) × 100% | (16) |
From Fig. 11, we found that all three cotton fabrics had high fixation. However, modified cotton fabrics had higher fixation rate than the unmodified cotton fabrics. Fixation rates of PDA-cotton, CHPTAC-cotton and raw cotton fabrics were 94.8%, 92.6%, and 91.7%, respectively. In alkaline environment, the active groups of reactive dyes and cellulose of cotton fabrics could further react to form covalent bonds.
3.9 Penetration of dyes
Three kinds of cotton fabrics were wrapped in wool and sliced with a Hastelloy slicer. The cross sections were presented in Fig. 12.It could be seen from Fig. 12a–c that reactive dyes had wonderful permeability on PDA-cotton, CHPTAC-cotton and raw cotton fabrics. However, the dyeing color of raw cotton fabrics were lighter than that of CHPTAC-cotton and PDA-cotton.
4 Conclusion
In this investigation, the adsorption and fixation processes of reactive dyes on modified and unmodified cotton fabrics were examined. The adsorption capacity of reactive dye on PDA-cotton increased with the increase of temperature. The adsorption isotherm conformed to Langmuir-model. Adsorption capacity and rate increased with temperature. The adsorption model of unmodified cotton fabrics was consistent with the Freundlich-model. The reaction type was exothermic reaction. The increase of temperature was not conducive to dye adsorption. Three kinds of cotton fabrics had high fixation rate, above 90%. All three cotton fabrics had good dye permeability.Ethical statement
This study following compliance with ethical standards, this study does not involve human participants, animals, and potential conflicts of interest.Author contributions
Xiaolei Zhai/investigation; writing-original draft. Jinwei Ma/investigation; data curation. Yanxiu Wu/investigation; data curation. Tianjie Niu/investigation; data curation. Deshuai Sun/investigation; validation. Xiaodong Zhang/conceptualization; supervision. Long Fang/conceptualization; methodology; reviewing and editing; supervision.Conflicts of interest
The authors declare that they have no conflict of interest.Acknowledgements
This work was supported by Shandong Provincial Natural Science Foundation (grant number ZR2020MB135) and Shandong Key Technology Research and Development Program (grant number 2018GGX108005).References
- A. Haji, S. M. Bidoki and F. Gholami, Isotherm and kinetic studies in dyeing of citric acid-crosslinked cotton with cationic natural dye, Fibers Polym., 2020, 21, 2547–2555, DOI:10.1007/s12221-020-1053-8.
- G. Yang, H. Kong and Y. Chen, et al., Recent advances in the hybridization of cellulose and carbon nanomaterials: interactions, structural design, functional tailoring, and applications, Carbohydr. Polym., 2022, 279, 118947, DOI:10.1016/j.carbpol.2021.118947.
- J. Zhou, Q. Luo and P. Gao, et al., Assembly of graphene oxide on cotton fiber through dyeing and their properties, RSC Adv., 2020, 10, 11982–11989, 10.1039/d0ra01588a.
- N. Arivithamani and V. R. G. Dev, Cationization of cotton for industrial scale salt-free reactive dyeing of garments, Clean Technol. Environ., 2017, 19, 2317–2326, DOI:10.1007/s10098-017-1425-y.
- N. V. Nikolaeva, V. A. Gribkova and N. V. Vasilievich, et al., Analysis of the properties of active dyes, IOP Conf. Ser.: Earth Environ. Sci., 2021, 677, 052046, DOI:10.1088/1755-1315/677/5/052046.
- B. Gao, X. Huang and T. Jiang, et al., Sustainable dyeing of ramie fiber with ternary reactive dye mixtures in liquid ammonia, RSC Adv., 2022, 12, 19253–19264, 10.1039/d2ra03288k.
- X. Wei, M. Wei and Z. Shufen, A new way to improve the light-fastness of azo reactive dyes through the introduction of benzene sulfonamide derivatives into the triazine ring, RSC Adv., 2019, 9, 17658–17663, 10.1039/c9ra02108f.
- C. Cao, Z. Zhao and Y. Qi, et al., Effects of alkanolamine solvents on the aggregation states of reactive dyes in concentrated solutions and the properties of the solutions, RSC Adv., 2021, 11, 10929–10934, 10.1039/d0ra10656a.
- Z. Huang, Y. Chen and R. Wang, et al., An acrylate AIE-active dye with a two-photon fluorescent switch for fluorescent nanoparticles by RAFT polymerization: synthesis, molecular structure and application in cell imaging, RSC Adv., 2020, 10, 5704–5711, 10.1039/c9ra10430e.
- P. J. Hauser and A. H. Tabba, Improving the environmental and economic aspects of cotton dyeing using a cationised cotton, Color. Technol., 2006, 117, 282–288, DOI:10.1111/j.1478-4408.2001.tb00076.x.
- L. Chen, B. Wang and X. Ruan, et al., Hydrolysis-free and fully recyclable reactive dyeing of cotton in green, non-nucleophilic solvents for a sustainable textile industry, J. Cleaner Prod., 2015, 107, 550–556, DOI:10.1016/j.jclepro.2015.05.144.
- E. Mouxiou, I. Eleftheriadis and N. Nikolaidis, et al., Reactive dyeing of cellulosic fibers: use of cationic surfactants and their interaction with reactive dyes, J. Appl. Polym. Sci., 2008, 108, 1209–1215, DOI:10.1002/app.27705.
- M. Irfan, K. Xie and A. Hou, Effect of reactive dye structures and substituents on cellulose fabric dyeing, Fibers Polym., 2020, 21, 2018–2023, DOI:10.1007/s12221-020-9472-0.
- F. M. Drumond Chequer, G. A. R. de Oliveira, E. R. Anastacio Ferraz, et al., Textile dyes: dyeing process and environmental impact, in eco-friendly textile dyeing and finishing, 2013, DOI:10.5772/53659.
- Y. Zhang and W. Zhang, Clean dyeing of cotton fiber using a novel nicotinic acid quaternary triazine cationic reactive dye: salt-free, alkali-free, and non-toxic by-product, Clean Technol. Environ., 2014, 17, 563–569, DOI:10.1007/s10098-014-0821-9.
- G. W. Wang, L. H. Zhuang and J. Sun, et al., Salt-free dyeing of ramie fabric with an amino-terminated hyperbranched polymer, Cellulose, 2014, 21, 3725–3736, DOI:10.1007/s10570-014-0345-9.
- J. Ru, X. Qian and Y. Wang, Low-salt or salt-free dyeing of cotton fibers with reactive dyes using liposomes as dyeing/level-dyeing promotors, Sci. Rep., 2018, 8, 13045, DOI:10.1038/s41598-018-31501-7.
- L. Liu and J. Yao, Salt-free dyeability of thiourea grafted cotton fabric, Fibers Polym., 2011, 12, 42–49, DOI:10.1007/s12221-011-0042-3.
- L. Fang, X. Zhang and J. Ma, et al., Eco-friendly cationic modification of cotton fabrics for improving utilization of reactive dyes, RSC Adv., 2015, 5, 45654–45661, 10.1039/c5ra05887b.
- N. Arivithamani and V. R. Giri Dev, Characterization and comparison of salt-free reactive dyed cationized cotton hosiery fabrics with that of conventional dyed cotton fabrics, J. Cleaner Prod., 2018, 183, 579–589 CrossRef CAS.
- B. F. Abdel-Wahab, H. A. Mohamed and H. M. Fahmy, Novel hydrazono-hydrazonoyl chlorides containing pyrazole moiety for concurrent dyeing and practical finishing of cotton fabrics, J. Mater. Res. Technol., 2020, 9, 7380–7386, DOI:10.1016/j.jmrt.2020.04.066.
- L. Gao, C. Wang and Y. Wei, Enhanced binding capacity of boronate affinity fibrous material for effective enrichment of nucleosides in urine samples, RSC Adv., 2016, 6, 28470–28476, 10.1039/c5ra27898h.
- M. Li, L. Zhang and M. Qiu, et al., Dyeing property of fluorescent pigment latex on cationic knitted cotton fabrics, Text. Res. J., 2017, 89, 422–433, DOI:10.1177/0040517517748494.
- M. Rehan, S. A. Mahmoud and H. M. Mashaly, et al., β-Cyclodextrin assisted simultaneous preparation and dyeing acid dyes onto cotton fabric, React. Funct. Polym., 2020, 151, 104573, DOI:10.1016/j.reactfunctpolym.2020.104573.
- N. Arivithamani and V. R. Giri Dev, Sustainable bulk scale cationization of cotton hosiery fabrics for salt-free reactive dyeing process, J. Cleaner Prod., 2017, 149, 1188–1199, DOI:10.1016/j.jclepro.2017.02.162.
- F. Giacomini, A. A. U. de Souza and M. A. S. D. de Barros, Cationization of cotton with ovalbumin to improve dyeing of modified cotton with cochineal natural dye, Text. Res. J., 2020, 90, 1805–1822, DOI:10.1177/0040517519899652.
- W. Dong, M. Zhou and Y. Li, et al., Low-salt dyeing of cotton fabric grafted with pH-responsive cationic polymer of polyelectrolyte 2-(N,N-dimethylamino)ethyl methacrylate, Colloids Surf., A, 2020, 594, 124573, DOI:10.1016/j.colsurfa.2020.124573.
- W. Ma, S. Du and S. Yan, et al., Salt free dyeing of modified cotton through graft polymerization with highly enhanced dye fixation and good strength properties, Polymers, 2020, 12, 462, DOI:10.3390/polym12020462.
- S. Kim, J. Nakamatsu and D. Maurtua, et al., Formation, antimicrobial activity, and controlled release from cotton fibers with deposited functional polymers, J. Appl. Polym. Sci., 2016, 133 DOI:10.1002/app.43054.
- L. Wang, G. Xie and X. Mi, et al., A single-step pad-steam cationisation and dyeing process for improving dyeing properties of cotton fabrics, Color. Technol., 2022, 138, 509–521, DOI:10.1111/cote.12608.
- L. Pei, Y. Luo and M. A. Saleem, et al., Sustainable pilot scale reactive dyeing based on silicone oil for improving dye fixation and reducing discharges, J. Cleaner Prod., 2021, 279, 123831, DOI:10.1016/j.jclepro.2020.123831.
- F. Zhang, Y. Chen and H. Lin, et al., Synthesis of an amino-terminated hyperbranched polymer and its application in reactive dyeing on cotton as a salt-free dyeing auxiliary, Color. Technol., 2007, 123, 351–357, DOI:10.1111/j.1478-4408.2007.00108.x.
- S. M. Burkinshaw, M. Mignanelli and P. E. Froehling, et al., The use of dendrimers to modify the dyeing behaviour of reactive dyes on cotton, Dyes Pigm., 2000, 47, 259–267, DOI:10.1016/s0143-7208(00)00053-x.
- D. Chen, K. P. Taylor and Q. Hall, et al., The neuropeptides FLP-2 and PDF-1 act in concert to arouse caenorhabditis elegans locomotion, Genetics, 2016, 204, 1151–1159, DOI:10.1534/genetics.116.192898.
- D. G. Barnes, M. Vidiassov and B. Ruthensteiner, et al., Embedding and publishing interactive, 3-dimensional, scientific figures in portable document format (PDF) files, PLoS One, 2013, 8, e69446, DOI:10.1371/journal.pone.0069446.
- M. J. Farrell, R. B. Ormond and W. J. Gabler, Quantitative analysis of trimethyl amine in cotton fabrics cationized with 3-chloro-2-hydroxypropyltrimethylammonium chloride, Cellulose, 2015, 22, 3435–3439, DOI:10.1007/s10570-015-0692-1.
- H. Xiao, K. Yan and B. Ji, Improvement of anti-wrinkle properties of cotton fabrics treated with additives of neutral salts, Fibers Polym., 2018, 19, 1576–1583, DOI:10.1007/s12221-018-7954-0.
- T. Niu, X. Wang and C. Wu, et al., Chemical modification of cotton fabrics by a bifunctional cationic polymer for salt-free reactive dyeing, ACS Omega, 2020, 5, 15409–15416, DOI:10.1021/acsomega.0c01530.
- G. Ke, K. Zhu and M. H. Chowdhury, Dyeing of Cochineal Natural Dye on Cotton Fabrics Treated with Oxidant and Chitosan, J. Nat. Fibers, 2019, 18, 317–329, DOI:10.1080/15440478.2019.1623742.
- G. Ke, S. Chen and Y. Zheng, et al., The dyeing of cotton fabric with natural dye from buddlejae flos, J. Nat. Fibers, 2021, 1–11, DOI:10.1080/15440478.2020.1870610.
- P. K. Malik, Use of activated carbons prepared from sawdust and rice-husk for adsorption of acid dyes: a case study of Acid Yellow 36, Dyes Pigm., 2003, 56, 239–249, DOI:10.1016/s0143-7208(02)00159-6.
- Y. Mao, Y. Guan and Q. Zheng, et al., Adsorption thermodynamic and kinetic of disperse dye on cotton fiber modified with tolylene diisocyanate derivative, Cellulose, 2011, 18, 271–279, DOI:10.1007/s10570-011-9495-1.
| This journal is © The Royal Society of Chemistry 2022 |

