 Open Access Article
Preparation and performance study of a reactive polyurethane hot-melt adhesive/CS–Fe3O4 magnetic nanocomposite film/fabric
Qiushi Wang *a,
Ziqin Fengb,
Caiting Hea,
Tianwei Liua,
Hailin Lu
 b and
Runjun Sun*a
aSchool of Textile Science and Engineering, Xi'an Polytechnic University, Xi'an, Shaanxi 710048, China. E-mail: wangqiushi@xpu.edu.cn; sunrunjun2018@163.com
bGroup of Mechanical and Biomedical Engineering, Xi'an Key Laboratory of Modern Intelligent Textile Equipment, College of Mechanical & Electronic Engineering, Xi'an Polytechnic University, Xi'an, Shaanxi 710048, P. R. China
First published on 28th September 2022
Abstract
Magnetic nanoparticles are attracting significant attention for their wide application as biomaterials and magnetic storage materials. As an environmentally friendly adhesive, reactive polyurethane hot-melt adhesive (PUR) is a biocompatible polymer with a wide range of applications. In this paper, chitosan (CS)-surface-modified magnetic Fe3O4 nanoparticles were synthesized by the sol–gel method. Surface modification of the Fe3O4 nanoparticles with CS enhanced their mechanical properties in PUR. The nanoparticles were characterized by Fourier transform infrared (FTIR) and X-ray diffraction (XRD) analyses, while their surface morphology was elucidated using scanning electron microscopy (SEM) and projection electron microscopy (TEM) techniques. Subsequently, PUR/CS–Fe3O4 magnetic nanocomposite films were prepared using an in situ method, wherein different amounts of CS–surface-modified magnetic Fe3O4 nanoparticles were doped into the PUR and coated on the films. The thermal, UV resistance and mechanical properties of the PUR/CS–Fe3O4 magnetic nanocomposite films were investigated by TGA, UV spectrometer and tensile testing. CS–Fe3O4 nanoparticles were successfully prepared using the sol–gel method and CS to modify the surface of the Fe3O4 nanoparticles. The results show that the mechanical properties and UV resistance of PUR/CS–Fe3O4 magnetic nanocomposites are improved by almost 50%, so the constructed PUR/CS–Fe3O4 magnetic nanocomposites have good UV-resistant properties and mechanical properties. The as-synthesized CS–Fe3O4 magnetic nanocomposites show great potential for application to mechanical and textile development.
1 Introduction
In recent years, magnetic nanoparticles, especially Fe3O4 nanoparticles, have attracted great interest in several fields, such as catalysis, magnetic recording, drug delivery systems, and magnetic resonance imaging, owing to their special physicochemical properties.1–3 Specifically, the surface of Fe3O4 magnetic nanoparticles can be functionalized with high dispersion, high reactive activity, and easy separation, and the nanoparticles can be embedded into organic polymers to prepare magnetic polymer nanocomposites.4,5 Therefore, magnetic nanopolymer composites are known as smart materials, in which the polymer acts as the nanoparticle carrier and generally displays high strength, low weight, thermal stability, and chemical resistance. The addition of nanoparticles to polymer matrices affords two advantages: (1) structural support and functionalization of the matrix by increasing its dispersion and (2) the possibility of imparting magnetic properties and some antibacterial activity to the polymer. Currently, many polymers have been used as matrices for magnetic (e.g., Fe3O4) polymer nanocomposites in a wide range of applications,6 with research areas including electromagnetic interference shielding, anti-UV, drug delivery, and electromagnetic wave absorbing materials.7,8 Among them, polyurethane is preferred for the preparation of magnetic polymer nanocomposites because it affords chemical stability, biocompatibility, and excellent mechanical properties. Compared to conventional composites, nanopolymer composites composed of metal nanoparticles exhibit significantly improved mechanical strength and heat and UV resistances.9 Therefore, composites with nanoparticles dispersed in the polymer matrix are attracting increasing interest from both scientific and industrial fields.10–13Polyurethane is a copolymer consisting of a low-molecular-weight polyether polyol and polyurethane group (–NHCO–O) connected to a polyester by a covalent bond.14,15 Owing to its solvent-free properties, it avoids the emission of volatile organic compounds and is widely used in many fields, such as electronic assembly, automotive systems, aerospace, and wood processing. Polyurethane can be classified into two categories: Thermoplastic polyurethane hot-melt adhesive (TPU) flows when heated and is fixed when cooled. TPU displays a high initial bond strength and long storage period, and can be reversibly bonded; however, its ultimate bond strength and heat and chemical resistances are poor owing to its linear structure.16 On the other hand, reactive polyurethane hot-melt adhesive (PUR) usually refers to low-molecular-weight linear polyurethanes terminated with isocyanates. PUR contains excess isocyanate groups (–NCO) that react with atmospheric moisture to form polymers with cross-linked networks that eventually form a permanent cross-linked structure. This material typically displays a higher ultimate bond strength and superior heat and chemical resistances than TPU.17–19
PUR, which is a low-molecular-weight end-isocyanate polyurethane prepolymer synthesized from polyester, polyether polyol, and diisocyanate, is also more environmentally friendly than TPU.20 PUR, as a moisture-curing adhesive, is solid at room temperature, changes to a liquid or fluid when heated, and returns back to the solid state when cooled to form a fast initial bond, with subsequent chemical cross-linking further improving the bond strength. This strategy is widely used in sealant production and high-performance coatings.21 PUR generally adopts polymers with high glass transition temperatures or crystallinity, both of which accelerate the curing process when cooled. There are two main stages in the curing process, with green strength being accomplished primarily in the first stage of physical curing, which provides rapid initial bonding through the first solidification process by cooling. The second stage, also known as chemical curing, involves the reaction of the isocyanic groups (–NCO) in the colloid with moisture or the substrate, resulting in an increased degree of cross-linking of the molecular chains and the formation of a fully reactive polymer after curing. This ultimately improves the bond strength to afford excellent mechanical properties and high heat and solvent resistances.22,23 At present, PUR is being widely used in many fields, such as railway transportation,24 automobiles,25 book binding,26 wood processing,27 and fabric lamination,28 because of its advantages of high bonding strength, a wide range of performance tuning, easy construction, a high solid content, and environmental protection.29,30
Appropriate surface modification of nanoparticles can improve their interfacial interaction and compatibility with the polymer matrix. Thus, there have been several studies on the preparation of PUR/Fe3O4 magnetic nanocomposites. Recently, Wang et al.3 investigated the self-healing and removable properties of dynamically cross-linked hot-melt polyurethane adhesives and reported that polyurethane adhesives with dynamic network structures display self-healing properties. Abbas et al.31 investigated the surface modification of Fe3O4 nanoparticles and prepared polyurethane elastomer nanocomposites by in situ polymerization, revealing that the modified Fe3O4 nanoparticles were well dispersed in the polyurethane matrix. Moreover, Xi Liao et al.32 studied graphite nanofiber fabrics functionalized with polyurethane hot-melt adhesives to enhance the waterproof, breathable, and mechanical properties of their composite fabrics.
With these facts in mind, in this study we focused on the preparation of magnetic polyurethane nanocomposites from chitosan (CS)-surface-modified Fe3O4 nanoparticles (PUR/CS–Fe3O4), using an in situ method10 to incorporate the modified nanoparticles into PUR sols. The surface modification of the Fe3O4 nanoparticles using CS improves agglomeration between the nanoparticles and the interfacial interaction force with the polyurethane matrix, which in turn can further improve the magnetic and mechanical properties of the magnetic nanocomposites. The PUR/CS–Fe3O4 magnetic nanocomposites were characterized and studied using Fourier transform infrared (FTIR) spectroscopy, scanning electron microscopy (SEM), projection electron microscopy (TEM), differential scanning calorimetry (DSC), and X-ray diffraction (XRD) analysis together with tensile, anti-UV, and electromagnetic shielding tests.
2 Experimental
2.1 Materials
Ferric chloride hexahydrate (FeCl3·6H2O) and sodium hydroxide were purchased from Damao Chemical Reagent Factory (Tianjing, China), while ferrous chloride tetrahydrate (FeCl2·4H2O) was acquired from Tianjin Guangfu Fine Research Institute (Tianjing, China). Citric acid was purchased from Fuyu Fine Chemical Co., Ltd (Tianjing, China), while CS (degree of deacetylation, ≥90%; molecular weight, 700–800 KDa) was purchased from Shanghai Lanji technology Co., Ltd (Shanghai, China). PUR was purchased from Fule Chemical Co., Ltd (Nanjing, China). TPU film and fabric (polyester) were purchased from Zhejiang Ruisheng New Material Co., Ltd.2.2 Preparation of the CS–Fe3O4 nanoparticles
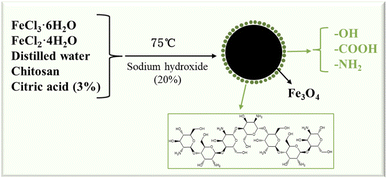
Approximately 1 g FeCl3·6H2O and 0.5 g FeCl2·4H2O were dissolved into 50 mL distilled water and stirred evenly. Next, 1% CS sol (50 mL) was prepared by dissolving CS with 3% citric acid. The iron ion solution was then added to the CS sol, and the temperature was raised to 75 °C under an applied magnetic field. Subsequently, 20% sodium hydroxide aqueous solution was added to the mixture, while stirring, until the solution turned black and continuous stirring at 75 °C was maintained for another 0.5 h. Next, the mixture was wash with distilled water repeatedly to neutral, centrifuged 2–3 times, and then dispersed by ultrasound in acetone solution. Finally, the sample was dried at 80 °C to afford the CS–Fe3O4 nanoparticles (Fig. 1).2.3 Synthesis of PUR/CS–Fe3O4 magnetic nanocomposites
First, the PUR was preheated (130 °C), and some TPU films with a radius of 8 cm were prepared. Different mass percentages (0.1–0.5%) of CS–Fe3O4 nanoparticles were infiltrated into the PUR using an in situ method. Heating and stirring were maintained until the CS–Fe3O4 nanoparticles were dispersed and mixed uniformly in the PUR, and the dispersed mixed sol was coated in two layers of TPU films, which were molded by applying a certain load (3000 N) through a press. The afforded sample was then dried for 24 h. Finally, PUR/CS–Fe3O4 magnetic nanocomposite films with different mass percentages (x PUR/CS–Fe3O4; x = 0.1, 0.2, 0.3, 0.4, and 0.5%) were obtained. Furthermore, PUR/CS–Fe3O4 magnetic nanocomposite fabrics were synthesized by coating different mass percentages (0.1–0.5%) of CS–Fe3O4 nanoparticles on the film with a fabric for double-sided lamination, which were used in the tensile strength tests. A group of PUR film was set up as the blank control for this experiment.2.4 Characterization
In this study we mainly used a tensile testing machine (model DR-502A) to establish the mechanical properties of the PUR/CS–Fe3O4 magnetic nanocomposites. Sensors were connected to collect the force data. The prepared samples had dimensions of 10 × 50 mm, and the tensile tests were performed at a speed of 5 mm min−1. Each group of experiments was repeated three times and the average value was then calculated. The surface morphology of the magnetic CS–Fe3O4 nanoparticles was observed and analyzed using an SU3500 electron microscope and H-7650 transmission electron microscope. FTIR analysis was performed on a Nicolet iS50 spectrometer and XRD characterization on a Bruker D8 with a 2θ scan range of 10–90°. XPS analysis was employed to identify the constituent elements and chemical bonding forms. TGA and DSC analyses were performed using a 409C thermal equilibrium meter with a testing temperature range of 25–1000 °C, while UV-vis spectroscopy was performed using a benchtop digital UV spectrometer (UV-1800PC) with a scan wavelength range of 200–800 nm. Finally, shielding coefficient testing was performed using an electromagnetic wave radiation tester in the frequency range 8.2–12.4 Hz.3 Results and discussion
3.1 SEM and TEM analyses
The morphology and particle size of the CS–Fe3O4 and Fe3O4 nanoparticles were investigated by SEM, while TEM allowed further observation of the fine structure of the particle surface. The SEM image in Fig. 2(a) depicts the morphology of the synthesized Fe3O4 nanoparticles, showing an obvious phenomenon similar to the glomerular aggregation. The TEM images further confirmed the aggregated pellet state as shown in Fig. 2(b). The SEM images in Fig. 2(c) depict the morphology of the synthesized CS–Fe3O4 nanoparticles, which clearly exhibit polymer coverage. In Fig. 2(d), the TEM image of the CS–Fe3O4 nanoparticles reveals significant CS coverage with a morphology comprising spherical-like aggregation and a nanoparticle diameter of 10 nm. Compared with Fig. 2(b), CS–Fe3O4 nanoparticles in Fig. 2(d) are more densely clustered. The initial guess is that CS makes the surface of Fe3O4 nanoparticles more prone to agglomeration. This is reflected in Fig. 2(c). Thus, from these results, we inferred that the polymer on the nanoparticle surface is CS, which effectively encapsulated the Fe3O4 nanoparticles. CS is a natural polysaccharide product with a large number of groups on its surface, which can form intermolecular and intramolecular hydrogen bonds through the interaction of groups distributed in macromolecular chains, thus having high adsorbability, and can be adsorbed on the surface of Fe3O4 nanoparticles to aggregate its polymers together. Therefore, we infer that the polymer on the nanoparticle surface is CS, which effectively coats the Fe3O4 nanoparticle.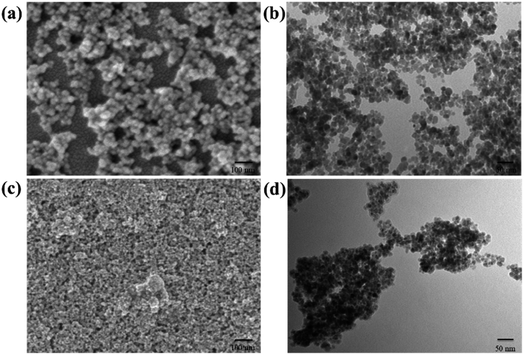 | ||
| Fig. 2 (a) SEM and (b) TEM images of the Fe3O4 nanoparticles, (c) SEM and (d) TEM images of the CS–Fe3O4 nanoparticles. | ||
3.2 FTIR, XRD, TGA, and DSC analyses
Due to the best mechanical properties at the 0.3% CS–Fe3O4 concentration, 0.3% PUR/CS–Fe3O4 composite film was selected for characterization analysis. The FTIR spectra of CS, Fe3O4, PUR and the 0.3% PUR/CS–Fe3O4 magnetic nanocomposite are shown in Fig. 3(a). The FTIR PUR spectrum displays a strong absorption peak at 1500 cm−1 assigned to the N–H stretching vibration of the carbamate group, while the different C–H vibrations of the CH2 groups are observed at 2880 and 2989 cm−1. The peak at 450 cm−1 was assigned to the symmetric and asymmetric C–O vibrations of the urethane group.31 The FTIR Fe3O4 spectrum has a characteristic peak at 580 cm−1. Which is caused by the vibration of Fe–O, and the peak value of CS FTIR spectrum at 3402 cm−1 is related to –OH functional group.33 The FTIR spectrum of the 0.3% PUR/CS–Fe3O4 magnetic nanocomposite shows similar absorption peaks to those of PUR, which is an indication of the completion of the reaction between CS–Fe3O4 and PUR and the formation of the PUR/CS–Fe3O4 composite. Similarly, in this spectrum, the peak at 3400 cm−1 was assigned to the O–H stretching and H–O–H bending vibrations of water,34 while the peak at 3400 cm−1 is characteristic to CS–Fe3O4. Therefore, the same functional groups indicate that CS and Fe3O4 are successfully bonded to the surface of 0.3% PUR/CS–Fe3O4 composite. The experimental results of FTIR show that CS–Fe3O4 successfully adheres to the composite surface. The crystallinity of the composites was investigated by XRD. Fig. 3(b) shows the XRD curves of CS, Fe3O4, PUR and the 0.3% PUR/CS–Fe3O4 magnetic nanocomposite, where the peaks at 2θ = 35.5, and 62.5° correspond to the (311), and (440) diffraction planes of the Fe3O4 cubic-tip crystal structure, respectively.33,35 These data indicate that the CS–Fe3O4 magnetic nanocomposite exhibits the same physicochemical properties as those of standard Fe3O4 nanoparticles. In addition, a broad peak at 2θ = 22.5° indicates a typical hypocrystalline structure. Thus, comparison of this peak in the two spectra revealed that the PUR samples comprised a semicrystalline structure.36 It can be clearly observed that PUR, CS and PUR/CS–Fe3O4 composite have similar diffraction peaks (105), which means that they have the same crystal structure and single crystal type,37 while the 0.3% CS–Fe3O4 magnetic nanocomposite sample, for which the broad peak intensity is significantly increased, displays increased crystallinity.38 In summary, the XRD results show that CS–Fe3O4 effectively adheres to the surface of the composite. The thermal stability and decomposition behaviors of the PUR and composite samples under nitrogen atmosphere were next studied by TGA, as shown in Fig. 3(c). In the TGA curve of the 0.3% PUR/CS–Fe3O4 magnetic nanocomposite, the sharp weight loss between 270 and 580 °C, was mainly attributed to the decomposition of CS and disruption of the hydrogen bonding between the polyurethane chains caused by the nanoparticles. This resulted in physical cross-linking between the polyurethane chains, which led to weight stability from 580 to 1000 °C, with 10.2% fixed residue.39 Finally, in Fig. 3(d) the DCS plot shows a glass transition temperature of 300–600 °C for PUR,40 while the observed heat absorption range of the 0.3% CS–Fe3O4 magnetic nanocomposite is in the range of 300–600 °C, proving that the samples began to react with air. At 500 °C PUR underwent a more intense curing reaction, in which the isocyanate group (–NCO) reacted completely and the molecular chains were cross-linked to a greater extent. In conclusion, the TGA and DSC results demonstrate that the CS–Fe3O4 nanoparticles increase the thermal stability and adhesive strength of PUR.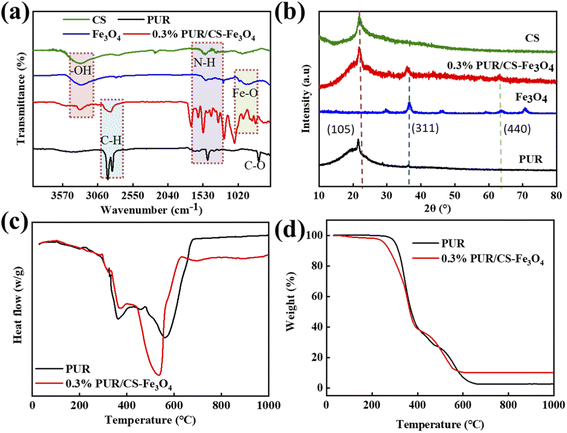 | ||
| Fig. 3 Analysis of the 0.3% PUR/CS–Fe3O4 composite film: (a) FTIR, (b) XRD, (c) TGA, and (d) DSC spectra. | ||
3.3 XPS analysis
Fig. 4 shows the XPS results of the 0.3% PUR/CS–Fe3O4 magnetic nanocomposite. Fig. 4(a) shows that the PUR/CS–Fe3O4 magnetic nanocomposite presented significant C1s, O1s, N1s, and Fe 2p signals, among which, the C1s and O1s absorption peaks have the highest intensities. The main high-resolution N1s XPS peak was observed at 398.98 eV (Fig. 4(b)), which was assigned to C–N bonding by reviewing the relevant N-element electron binding energy table. Moreover, a high-resolution Fe 2p XPS peak was observed at 712 eV (Fig. 4(c)). Fig. 4(d) shows the high-resolution C1s XPS spectrum, which shows a double-peaked signal at 287.3 and 283.89 eV, corresponding to the standard C1s peaks for the C–O and C–C bonds, respectively. Fig. 4(e) shows the high-resolution O1s XPS spectrum, where the table of electronic binding energies of the relevant elemental oxygen shows that the O1s binding energies at 530.39, 531.46, and 532.48 eV belong to the FeOOH, O–H, and C![[double bond, length as m-dash]](https://www.rsc.org/images/entities/char_e001.gif) O bonds, respectively. Finally, Fig. 4(f) lists the elemental atomic percentages of the 0.3% PUR/CS–Fe3O4 magnetic nanocomposite. Because the polyol in PUR has a high C content, the C1s content was the highest, accounting for 81.37% of the total atoms. N1s accounted for 2.8% of the total atoms, indicating that CS effectively covered the Fe3O4 nanoparticles. The Fe 2p content was 0.43% of the total atoms, indicating adequate mixing of the CS–Fe3O4 nanoparticles and PUR.
O bonds, respectively. Finally, Fig. 4(f) lists the elemental atomic percentages of the 0.3% PUR/CS–Fe3O4 magnetic nanocomposite. Because the polyol in PUR has a high C content, the C1s content was the highest, accounting for 81.37% of the total atoms. N1s accounted for 2.8% of the total atoms, indicating that CS effectively covered the Fe3O4 nanoparticles. The Fe 2p content was 0.43% of the total atoms, indicating adequate mixing of the CS–Fe3O4 nanoparticles and PUR.
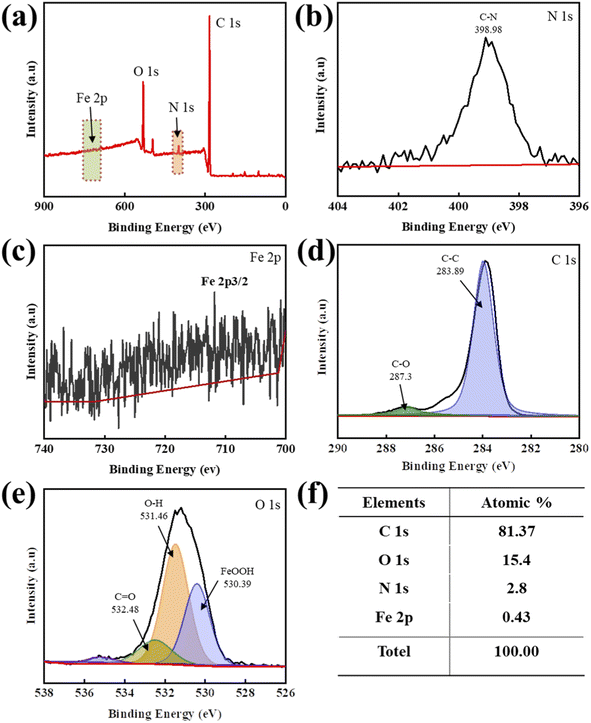 | ||
| Fig. 4 XPS analysis of the 0.3% PUR/CS–Fe3O4 composite film: (a) XPS profile; high-resolution spectra of the (b) N 1s, (c) Fe 2p, (d) C 1s, and (e) O 1s regions; and (f) elemental atomic percentages. | ||
3.4 Magnetic property analysis of the PUR/CS–Fe3O4 composites
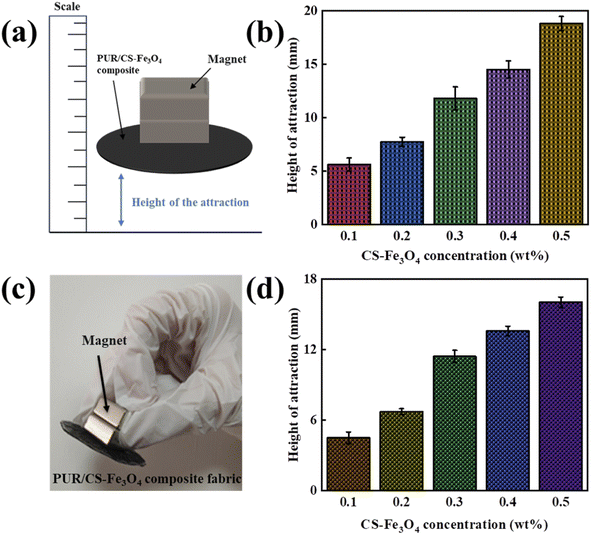
The schematic diagram of magnetic properties of the PUR/CS–Fe3O4 magnetic nanocomposite films with different CS–Fe3O4 concentrations were next tested (Fig. 5(a)). The height of attraction is the initial magnetic strength, and then the attraction height is read with a scale. Three samples are prepared for each concentration, the average value is finally taken, and their height of attraction curves are shown in Fig. 5(b). The curves show a gradual increase with increasing CS–Fe3O4 nanoparticle concentration, indicating that the CS–Fe3O4 nanoparticles had certain magnetic properties that increased with increasing nanoparticle concentration. This was attributed to the good magnetic properties of the experimentally prepared CS–Fe3O4 nanoparticles. Specifically, the interaction force between the nanoparticles is weakened in solution because the CS or acetone molecules isolate the particles from each other. However, in the powder state, the interaction force between the nanoparticles is larger and they exhibit a super magnetic force at room temperature. Therefore, the magnetic strength of the composite film gradually increases. The magnetic properties of the as-synthesized PUR/CS–Fe3O4 composite fabrics were also tested (Fig. 5(c)). Up to a certain critical value, small-sized nanoparticles exhibit varied magnetic properties, however, the CS–Fe3O4 nanoparticles prepared in this experiment displayed good superparamagnetic properties at a diameter of 10 nm. To further investigate their magnetic properties, the CS–Fe3O4 nanoparticles were laminated on fabric, and the height of attraction of the PUR/CS–Fe3O4 composite fabric at different CS–Fe3O4 concentrations investigated (Fig. 5(d)). The magnetic properties of the PUR/CS–Fe3O4 composite fabric gradually increased with increasing CS–Fe3O4 nanoparticle concentration and became increasingly stronger, owing to the increase in the interaction force between the nanoparticles.3.5 Mechanical property analysis of the PUR/CS–Fe3O4 composite films
Fig. 6(a) shows the mechanical property test of a PUR/CS–Fe3O4 magnetic nanocomposite film, which shows the elastic–plastic properties of the composite film before and after stretching more macroscopically. To further investigate the mechanical properties of the composite films, the stress–strain, tensile strength, and elongation at break at different CS–Fe3O4 concentrations were next measured. Fig. 6(b) shows the stress–strain curves of the PUR/CS–Fe3O4 composite films with different CS–Fe3O4 concentrations, which reveal that the stress generated during deformation increased with increasing CS–Fe3O4 concentration. The stress value of the 0.1% PUR/CS–Fe3O4 composite film was therefore the lowest (3.8 MPa), while that of the 0.5% PUR/CS–Fe3O4 composite film was the highest (6.3 MPa). In contrast, the elasticity was the smallest (180%) for the 0.5% PUR/CS–Fe3O4 composite film, while the best elasticity (240%) was observed for the 0.3% PUR/CS–Fe3O4. These trends were attributed to the increase in the CS–Fe3O4 nanoparticle concentration, which leads to a large aggregation of nanoparticles, resulting in an increase in stress and a decrease in the toughness of the composite film. Fig. 6(c) shows the tensile strength and elongation at break curves of the PUR/CS–Fe3O4 composite films with different concentrations. The 0.1% PUR/CS–Fe3O4 composite film showed the lowest tensile strength (3.5 MPa) and the second highest elongation at break (210%), while the 0.5% PUR/CS–Fe3O4 composite film showed the highest tensile strength (6.2 MPa) and lowest elongation at break (182%). Among the tested samples, the 0.3% PUR/CS–Fe3O4 composite film presented the best overall performance, with both a high tensile strength and good resistance to deformation. The experimental results further prove that the PUR/CS–Fe3O4 composite film has better tensile strength at higher CS–Fe3O4 concentrations.3.6 Mechanical property analysis of the PUR/CS–Fe3O4 composite fabrics
Fig. 7(a) shows the stress–strain curves of the composite fabric with different CS–Fe3O4 concentrations. With the increase in CS–Fe3O4 nanoparticle concentration, the stress values of the composite fabrics show a trend of decreasing, increasing, and then decreasing again. The 0.4% PUR/CS–Fe3O4 composite fabric presented the maximum stress value (26 MPa), while the 0.5% PUR/CS–Fe3O4 composite fabric displayed a lower stress value (20 MPa). Notably, the stress–strain curve of the composite fabric shows the opposite trend to that of the composite films in Fig. 6. This is because the composite fabric decreases the elasticity of the composite film, while its resistance to distortion increases. Fig. 7(b) shows the tensile strength and elongation at break curves of the PUR/CS–Fe3O4 composite fabrics with different CS–Fe3O4 concentrations. Both curves displayed a decreasing trend between 0.1 and 0.2%, followed by an increase between 0.2 and 0.4%, and finally a sharp drop between 0.4 and 0.5%. The composite fabric with a CS–Fe3O4 concentration of 0.4% displayed the highest tensile strength (30.5 MPa) and elongation at break (93%). In contrast, the fabric composite with the 0.2% CS–Fe3O4 concentration displayed the lowest tensile strength (21 MPa) and second lowest elongation at break (58%). The lowest elongation at break (50%) was observed for the fabric with a CS–Fe3O4 concentration of 0.5%, which displayed the second lowest tensile strength (22 MPa). This is because at higher CS–Fe3O4 concentrations, the nanoparticles are more easily aggregated, and thus, the interaction force between the particles increases. Furthermore, the addition of the fabric increases the mechanical properties of the PUR/CS–Fe3O4 composite fabric and decreases the elasticity, which in turn increase the resistance to deformation of the CS–Fe3O4 composite fabric. These experimental results show that the CS–Fe3O4 composite fabric has excellent mechanical properties.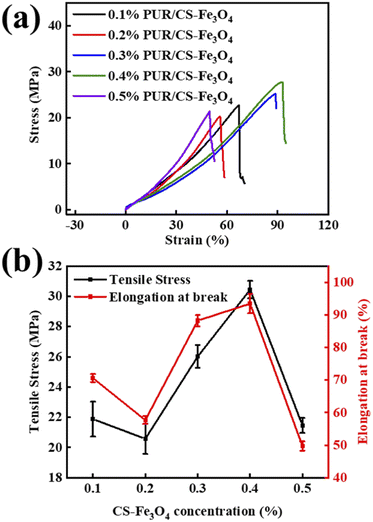 | ||
| Fig. 7 Analysis of the PUR/CS–Fe3O4 composite fabrics at different CS–Fe3O4 concentrations: (a) stress–strain and (b) tensile and elongation at break curves. | ||
3.7 Analysis of the UV resistance of the PUR/CS–Fe3O4 composite films
Fig. 8 shows the UV resistance curves of the PUR/CS–Fe3O4 composite films with different CS–Fe3O4 concentrations. The vertical axis in the figure is the absorbance, which indicates the degree of absorption of UV light, as can be seen in the figure. The PUR film and PUR/CS–Fe3O4 composite films all presented wide absorption spectra, which almost cover the UV-to-visible light range. After coating of the CS–Fe3O4 nanoparticles, the absorption intensity of the PUR/CS–Fe3O4 composite films were significantly enhanced in the UV region (200–300 nm), and the absorbance values increased continuously from 0.8 to 1.4 a.u. after which they leveled off. In particular, the characteristic absorption peaks (500 and 610 nm) of the 0.3% PUR/CS–Fe3O4 composite film showed a significant red shift, which we initially speculated to be the result of the citric acid participation in CS modification process. In addition, the absorbance of the PUR film increased from 0.8 to 1.3 a.u. in the 200–300 nm wavelength region; however, the absorption intensity in the UV-vis region (300–400 nm) began to decrease sharply. Thus, we supposed that this region corresponds to the weakening of the absorbance in PUR, which eventually leveled off so that the absorbance tended to be 0. In summary, the enhancement of the UV absorption intensity should be related to the orbital leap of the C–O bond, which was also verified by the FTIR experimental data. Hence, the excellent anti-UV performance indicates that the PUR/CS–Fe3O4 composite film has a good application prospect in photocatalysis.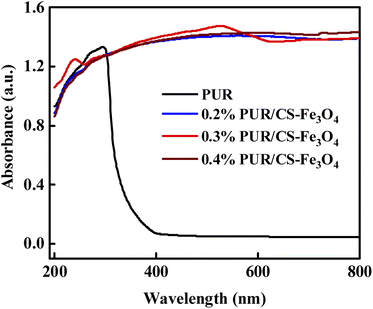 | ||
| Fig. 8 Analysis of the UV resistance of the PUR/CS–Fe3O4 composite films at different CS–Fe3O4 concentrations. | ||
3.8 Analysis of the cross-linking mechanism of the PUR/CS–Fe3O4 composites
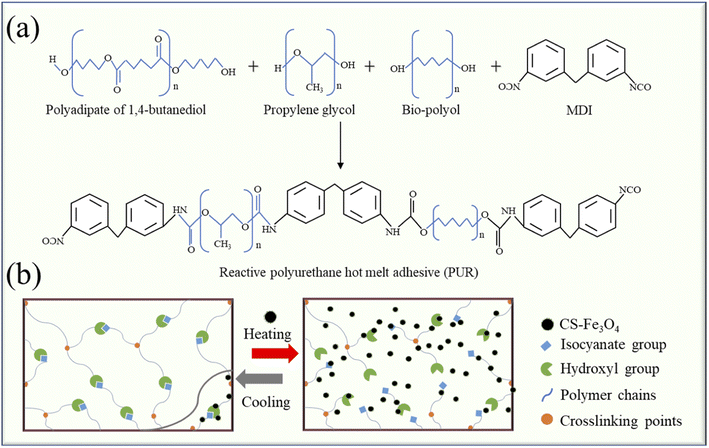
Fig. 9 shows the mechanistic analysis of the PUR/CS–Fe3O4 magnetic nanocomposites during the cross-linking process. One of the synthetic schemes of PUR is shown in Fig. 9(a). The PUR used in this study is synthesized from poly(ethylene glycol), 1,4-butanediol, polypropylene glycol (PPG), diisocyanate (MDI), and various bio-polyols. The cross-linking curing of PUR comprises two main processes: first, physical curing is a green cross-linking process that can achieve initial cementation with the substrate through various processes including crystallization of colloids and molecular cross-linking. Next, in chemical curing, the isocyanate (–NCO) in the cross-linker reacts with moisture in the air or compounds with active hydrogen and expands the chain to produce a polymer with a cross-linked network, thus improving the final bond strength. Fig. 9(b) shows a schematic diagram of the dissociation and reorganization of the polymer network of the composite material. As the PUR is heated, its isocyanate (–NCO) and hydroxyl (–OH) groups are broken, so that the CS–Fe3O4 nanoparticles become better dispersed in the PUR. Subsequently, during the cooling process, the –NCO and –OH groups are reorganized, and the polymer chain increases polymer cohesion through the connection point (hydrogen bonding), thereby leading to enhanced mechanical properties. The results showed that the CS–Fe3O4 nanoparticles were eventually better dispersed in PUR, endowing the PUR/CS–Fe3O4 magnetic nanocomposites with magnetic and UV-resistant properties.4 Conclusions
In this study, CS–Fe3O4 nanoparticles were successfully prepared by the sol–gel method. CS, used to modify the surface of the Fe3O4 nanoparticles effectively wrapped around the nanoparticles. The CS–Fe3O4 nanoparticles were characterized by SEM, TEM, FTIR, XPS, TGA, and DSC analyses, and the results showed that the CS effectively covered the Fe3O4 surface. Notably, the increase in the CS–Fe3O4 concentration increased the magnetic character of the PUR/CS–Fe3O4 magnetic nanocomposites. Tensile testing revealed that the CS–Fe3O4 magnetic nanocomposites display excellent mechanical properties. UV-vis spectral analysis revealed that the CS–Fe3O4 magnetic nanocomposites display excellent UV resistance and have positive application prospects for future mechanical and textile development. In summary, the nanocomposites obtained by nanoparticle loading showed better mechanical properties and UV resistance, thus laying a foundation for the next step of functionalized nanoparticle composites.Author contributions
Qiushi Wang and Ziqing Feng developed the initial concept. All authors discussed the results and commented on the manuscript.Conflicts of interest
The authors declare that they have no known competing financial interests or personal relationships that could have appeared to influence the work reported in this paper.Acknowledgements
This work was supported by Scientific Research Program Funded by the Shaanxi Provincial Education Department (Program No. 21JY015).References
- M. Wu, Y. Liu, P. Du, X. Wang and B. Yang, Int. J. Adhes. Adhes., 2020, 100, 102597 CrossRef CAS.
- W. Xie, Q. Yan and H. Fu, Polym. Adv. Technol., 2021, 32, 4415–4423 CrossRef CAS.
- S. Wang, Z. Liu, L. Zhang, Y. Guo, J. Song, J. Lou, Q. Guan, C. He and Z. You, Mater. Chem. Front., 2019, 3, 1833–1839 RSC.
- L. Sun, K. Li, W. Xue and Z. Zeng, J. Adhes. Sci. Technol., 2018, 32, 1253–1263 CrossRef CAS.
- L. Sun, S. Cao, W. Xue, Z. Zeng and W. Zhu, J. Adhes. Sci. Technol., 2016, 30, 1212–1222 CrossRef CAS.
- I. Anshori, K. A. A. Kepakisan, L. N. Rizalputri, R. R. Althof, A. E. Nugroho, R. Siburian and M. Handayani, Nanocomposites, 2022, 8, 155–166 CrossRef CAS.
- T. K. Kim, B. K. Kim, Y. S. Kim, Y. L. Cho, S. Y. Lee, Y. B. Cho and H. M. Jeong, Polym.-Plast. Technol. Eng., 2009, 48, 932–938 CrossRef CAS.
- J. S. Jung, J. H. Kim, M. S. Kim, H. M. Jeong, Y. S. Kim, T. K. Kim, J. M. Hwang, S. Y. Lee and Y. L. Cho, J. Appl. Polym. Sci., 2008, 109, 1757–1763 CrossRef CAS.
- P. Bekhta, B. Lis, T. Krystofiak and N. Bekhta, Forests, 2022, 13, 777 CrossRef.
- A. Mohammadi, M. Barikani and M. Barmar, J. Mater. Sci., 2013, 48, 7493–7502 CrossRef CAS.
- S. T. Moghaddam and M. R. Naimi-Jamal, J. Thermoplast. Compos. Mater., 2019, 32, 1224–1241 CrossRef CAS.
- T. K. Kim, B. K. Kim, Y. S. Kim, Y. L. Cho, S. Y. Lee, Y. B. Cho, J. H. Kim and H. M. Jeong, J. Appl. Polym. Sci., 2009, 114, 1169–1175 CrossRef CAS.
- M. C. Saha, M. E. Kabir and S. Jeelani, Polym. Compos., 2009, 30, 1058–1064 CrossRef CAS.
- H. M. Jeong, D. H. Kim, J. S. Jung, T. K. Kim, B. K. Kim, Y. S. Kim, Y. L. Cho and J. M. Hwang, Compos. Interfaces, 2007, 14, 467–476 CrossRef CAS.
- M. Fernandez, M. Landa, M. Eugenia Munoz and A. Santamaria, Macromol. Mater. Eng., 2010, 295, 1031–1041 CrossRef CAS.
- J. Jiang, M. Zhou, Y. Li, B. Chen, F. Tian and W. Zhai, J. Supercrit. Fluids, 2022, 188, 105654 CrossRef CAS.
- C.-H. Chung, W.-C. Shih and W.-M. Chiu, e-Polym., 2019, 19, 535–544 CAS.
- K. Furtak-Wrona, P. Kozik-Ostrowka, K. Jadwiszczak, J. E. Maigret, V. Aguie-Beghin and X. Coqueret, Radiat. Phys. Chem., 2018, 142, 94–99 CrossRef CAS.
- M. M. Azevedo, P. Ramalho, A. P. Silva, R. Teixeira-Santos, C. Pina-Vaz and A. G. Rodrigues, J. Med. Microbiol., 2014, 63, 1167–1173 CrossRef CAS.
- L. Sun, W. Zhang, W. Xue and Z. Zeng, J. Macromol. Sci., Part B: Phys., 2022 DOI:10.1080/00222348.2022.2094665.
- L. Sun, W. Zhang, W. Xue and Z. Zeng, J. Adhes. Sci. Technol., 2022 DOI:10.1080/01694243.2022.2036407.
- M. P. C. Blasco, M. A. P. Liminana, C. R. Silvestre, E. O. Calpena and F. A. Ais, Polymers, 2022, 14, 284 CrossRef CAS PubMed.
- Z. Lu, W. Xue, Z. Zeng and Z. Zhou, J. Adhes. Sci. Technol., 2021, 35, 941–954 CrossRef CAS.
- T. K. Kim, B. K. Kim, Y. S. Kim, Y. L. Cho, S. Y. Lee, Y. B. Cho, J. H. Kim and H. M. Jeong, Int. J. Material Form., 2008, 1, 615–618 CrossRef.
- Z. Liu, J. Huang, S. Chen, Y. Huang, F. Ding, W. Guo, D. Lei, L. Yang, F.-L. Qing and Z. You, Int. J. Adhes. Adhes., 2020, 96, 102456 CrossRef CAS.
- J. H. Kim, M. S. Kim, H. M. Jeong, Y. S. Kim, T. K. Kim, J. M. Hwang, S. Y. Lee and Y. L. Cho, Compos. Interfaces, 2008, 15, 577–587 CrossRef CAS.
- H. M. Jeong, D. H. Kim, K. S. Yoon, J. S. Jung, Y. S. Kim, T. K. Kim, Y. L. Cho and J. M. Hwang, J. Adhes. Sci. Technol., 2007, 21, 841–853 CrossRef CAS.
- D. J. Duffy, A. M. Heintz, H. D. Stidham, S. L. Hsu, W. Suen and C. W. Paul, Int. J. Adhes. Adhes., 2005, 25, 39–46 CrossRef CAS.
- W. Sikorska, M. Milner-Krawczyk, M. Wasyleczko, C. Wojciechowski and A. Chwojnowski, Polymers, 2021, 13, 1311 CrossRef CAS.
- C. Mattu, A. Silvestri, T. R. Wang, M. Boffito, E. Ranzato, C. Cassino, G. Ciofani and G. Ciardelli, Polym. Int., 2016, 65, 770–779 CrossRef CAS.
- A. Mohammadi, M. Barikani and M. Barmar, Polym. Adv. Technol., 2013, 24, 978–985 CrossRef CAS.
- C. Liu, X. Liao, W. Shao, F. Liu, B. Ding, G. Ren, Y. Chu and J. He, Polymers, 2020, 12, 836 CrossRef CAS.
- L.-y. Zhang, X.-j. Zhu, H.-w. Sun, G.-r. Chi, J.-x. Xu and Y.-l. Sun, Curr. Appl. Phys., 2010, 10, 828–833 CrossRef.
- M. T. Sturm, K. Schuhen and H. Horn, Sci. Total Environ., 2022, 806, 151388 CrossRef CAS PubMed.
- S. Parveen, M. Sultan, M. I. Sajid, F. Jubeen, S. Parveen, I. Bibi and Y. Safa, Polym. Bull., 2022, 79, 2487–2500 CrossRef CAS.
- M. Ruan, H. Luan, G. Wang and M. Shen, Ind. Crops Prod., 2019, 128, 436–444 CrossRef CAS.
- A. Chen, C. Yao, S. Zeng, C. Yi and Z. Xu, Polym. Bull., 2008, 61, 363–371 CrossRef CAS.
- G. C. Psarras, K. G. Gatos and J. Karger-Kocsis, J. Appl. Polym. Sci., 2007, 106, 1405–1411 CrossRef CAS.
- O. Akay, C. Altinkok, G. Acik, H. Yuce and G. K. Ege, Eur. Polym. J., 2021, 161, 110856 CrossRef CAS.
- M. Shahrousvand, M. S. Hoseinian, M. Ghollasi, A. Karbalaeimandi, A. Salimi and F. A. Tabar, Mater. Sci. Eng., C, 2017, 74, 556–567 CrossRef CAS PubMed.
| This journal is © The Royal Society of Chemistry 2022 |

