DOI:
10.1039/D2RA04859K
(Paper)
RSC Adv., 2022,
12, 27473-27482
The use of acrylic yarn modified with amidoxime and carboxylate-containing polymer for lead removal from drinking water†
Received
4th August 2022
, Accepted 9th September 2022
First published on 27th September 2022
Abstract
Amidoxime and carboxylate-containing polymer adsorbents derived from acrylic yarn exhibit high adsorption capacity for lead(II) (Pb2+) ions in water. The adsorption process follows pseudo-second-order kinetics and fits the extended Langmuir isotherm model with the maximum adsorption capacity of Pb2+ with 238 mg lead per gram of the fiber at room temperature. Endothermic (ΔH° = 20.3 kJ per mole), spontaneous, and with the increase in the entropy of Pb2+ adsorption was observed from the thermodynamic studies. Dynamic column adsorption experiments showed that the fiber can process 4.3 L of water spiked with 1 ppm of lead(II) solution at a flow rate of 4.4 mL per min under the specified conditions. The selectivity of Pb2+ with the competitive metal ions showed varying results with highly selective for Pb2+ in a binary solution with sodium and calcium and varying degrees of competitiveness with transition metal ions. This efficient and easily prepared fiber adsorbent appears to be a promising new material for the remediation of lead-contaminated aquatic environments and potable waters.
1. Introduction
There is a growing worldwide concern about heavy metal contamination of drinking water resulting from anthropogenic activities. Toxic elements, such as lead, present an environmental danger that is aggravated by their persistence and cumulative characteristics.1,2 Lead is known to interfere with hemoglobin production and cellular metabolism of vital organs such as the brain and kidneys.3,4 For this reason, the maximum permissible level of lead in drinking water is set at 15 ppb and 10 ppb by the USEPA5 and the WHO, respectively.6 Several technologies exist to remove heavy metals from drinking water and industrial wastewater. They include precipitation and electrochemical treatment, which are, however, only effective when the metal ion concentrations are high.7–9 For lower concentrations, membrane filtration and adsorption methodologies yield better results. Of these, membrane filtration tends to be expensive because of its high power requirements.10 Adsorption techniques are cheaper and therefore hold more promise for the practical remediation of low-level lead pollution.11 The recent advancements in the field of nanoscience and nanotechnology offer new opportunities to explore nano-adsorbents, including self-assembled monolayers on mesoporous silica (SAMMS), metal–organic frameworks (MOFs), and magnetic nanocomposites.12–16 Those nano-adsorbents have a large surface area, porosity, and abundant surface functional groups exhibiting remarkable adsorption capacity. However, those adsorbents are in powder forms, which are not suitable for large-scale water treatment applications. Functionalized polymeric fiber adsorbents can be easily handled and directly deployed in waste streams, rivers, lakes, and oceans, which cannot be achieved by the powder adsorbents.
Metal ions can be separated from an aqueous solution by the adsorption of functional groups attached to macromolecular frameworks. By tailoring these functionalities – e.g., amidoxime, amino, carboxylate, imidazoline, phosphate, or thioamido groups – metal ion selectivity can be imparted to the adsorption sites.17,18 In the past, polyethylene polymers containing amidoxime and carboxylate functionalities have been widely studied to extract uranium from seawater.13–15 They were traditionally prepared by a radiation-induced grafting process, which involves the attachment of acrylonitrile and methacrylic acid entities to polyethylene fibers.16 Amidoxime functional groups were also introduced on other substrates such as cellulose,19,20 resins,21 a polymer of poly(5-cyanoindole),22 and wool fiber.23 Nitrile groups on these substrates were introduced/grafted by cyanoethylation with acetonitrile on the substrate, followed by the oxidative addition of oxalic acid on wool. The conversion of the grafted nitrile group to an amidoxime group was achieved by a reaction with hydroxylamine. The newly formed amidoxime group adsorbed heavy metal cations from aqueous solutions. In addition, the adsorption capacity of the adsorbent is related to the amount of amidoxime on the substrate. The conversion of the grafted nitrile groups into amidoxime groups was accomplished by a reaction with hydroxylamine.24,25 It is generally accepted that the amidoxime groups provide binding sites for metal ions, whereas the carboxylate groups make the fiber adsorbent hydrophilic.
The scopes of this work involved (a) preparing and characterizing an amidoxime and carboxylate-containing polymer adsorbent from commercial acrylic yarn for the adsorption of heavy metal ions from aqueous solutions, (b) evaluating the sorption and selectivity, and potential mechanisms of Pb2+ by the adsorbent using batch experiments, and (c) studying its practical approach using dynamic column experiments.
2. Experimental
2.1 Materials and methods
All chemicals used were of analytical grade except the acrylic yarn. This yarn was labeled “100%” and was purchased from a local merchant for the preparation of the adsorbent. Sodium hydroxide (NaOH, 99% purity) and hydroxylamine hydrochloride (NH2OH‧HCl, 99% purity) were supplied by Fisher Scientific and Alfa Aesar, respectively. Lead nitrate (Pb(NO3)2), nickel nitrate (Ni(NO3)2), copper nitrate (Cu(NO3)2), cadmium nitrate (Cd(NO3)2) and chromium nitrate (Cr(NO3)3) were Analyzed Reagent purchased from Baker. Deionized water, filtered through a Millipore system, was used for all aqueous solutions. The corresponding salts were used for the preparation of 1000 ppm, respective, stock solutions, from which all lower concentrations of the respective salt solutions were prepared.
2.2 Adsorbent fiber preparation
The adsorbent fiber was prepared from acrylic yarn purchased from a local vendor. It was boiled in hot water, followed by thorough washing with DI water to remove the soluble and greasy layer if present on the surface of the yarn. It was dried and cut into pieces 1 to 2 mm long. The small pieces of the yarn were amidoximated, wherein a part of the nitrile groups was converted to amidoxime (hereafter AO) followed by the base hydrolysis where a part of the nitrile groups was converted to carboxylate (hereafter CO). A small amount of the nitrile group was left unconverted. The involved reactions for the preparation of the adsorbent fiber comprise the following two steps:
Amidoximation: a 100 mg dried acrylic fiber was added to a neutralized 3% hydroxylamine solution (prepared by dissolving 6.317 g of NH2OH‧HCl in 100 mL of 1![[thin space (1/6-em)]](https://www.rsc.org/images/entities/char_2009.gif) :1 water:methanol and then the solution was neutralized by adding NaOH). The mixture was heated in the 67–70 °C range in an ultrasonication bath for 10, 20, 30, 40, 60, and 120 min. The fibers were then washed with DI water under vacuum filtration. They were dried to constant weight in an oven at 90 °C. All the adsorbents were labeled according to their AO with their corresponding reaction times in minutes: AO10, AO20, AO30, AO40, AO60, and AO120.
:1 water:methanol and then the solution was neutralized by adding NaOH). The mixture was heated in the 67–70 °C range in an ultrasonication bath for 10, 20, 30, 40, 60, and 120 min. The fibers were then washed with DI water under vacuum filtration. They were dried to constant weight in an oven at 90 °C. All the adsorbents were labeled according to their AO with their corresponding reaction times in minutes: AO10, AO20, AO30, AO40, AO60, and AO120.
Base hydrolysis: the hydrolysis of the remaining nitrile and ester groups on the acrylic fiber to carboxylates was carried out in a 1 M NaOH solution. The treatment proceeded for about 18 h on amidoximated yarn at room temperature with constant shaking. The fiber was then thoroughly rinsed with deionized water until excess NaOH was washed off, and the washed water was neutral to litmus. It was dried to a constant weight at 90 °C and stored in a desiccator. All adsorbents were again labeled as AO and CO with AO reaction time (min) as AOCO10, AOCO20, AOCO30, AOCO40, AOCO60, and AOCO120.
2.3 Physiochemical characterization of the adsorbents
A scanning electron microscope (SEM, Zeiss Supra 35) with an X-ray energy dispersive spectrometer (X-EDS) was used to examine the surface morphology and provide the qualitative microanalysis of the adsorbent before and after Pb2+ adsorption. Each sample was coated with thin layers of carbon using a carbon-sputtering device before SEM observation. IR spectra of the adsorbent fiber were recorded in the spectral range between 4000 and 600 cm−1 with the resolution of 2 cm−1 and 32 scans, before and after the experiment using a Fourier transform-infrared (FT-IR) spectrometer (Thermo-Nicolet 6700) equipped with a SplitPea Attenuated Total Reflection (ATR) microsampler (Harrick Scientific Corporation). The spectra were compared to assess the changes in the surface functional groups on the fiber. The conversion of nitrile groups to AO and CO on the fiber was verified by determining the change in the nitrile absorption intensity before and after the reaction. The change in the peak intensity of the nitrile was used to estimate the AO and CO contents on the surface of the fiber. The decrease in the nitrile content was expressed using eqn (1), and AO% and CO% were estimated using eqn (2) and (3).| |
 | (1) |
| | |
AO% = 100% – (% nitrile)
| (2) |
| | |
CO% = 100% – AO% – (% nitrile after base treatment)
| (3) |
2.4 Adsorption experiments
2.4.1 Influence of solution pH. The influence of pH on the adsorption was studied in a solution having 25 ppm Pb2+ as the initial concentration and 25 mg of AOCO30. The pH of the solution was adjusted without any additional control during the adsorption process. The final pH and the residual Pb2+ after adsorption were measured. A pH meter (Thermo Scientific, Orlon Star Series) was used to measure the pH.
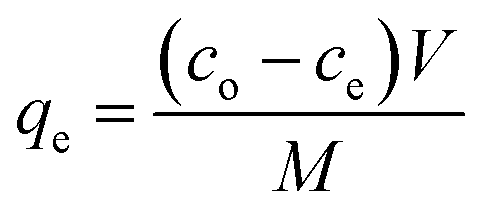
2.4.2 Adsorption experiments and kinetics. Batch adsorption experiments were performed to evaluate the potential of the fibers to adsorb Pb species from the solution. The adsorbent was soaked in DI water overnight and then added to Pb(NO3)2 solutions, ranging in concentrations from 5 to 45 ppm with the sorbent dosage of 0.1 g L−1. Pb2+ solutions were stirred at 120 rpm, and samples were collected at preselected intervals from the pool and analyzed for Pb2+ concentration using an atomic absorption spectrometer (AAS, Thermo Electron Corporation S-Series). The Pb2+ adsorption capacity of the adsorbent fiber (mg Pb per g fiber) at equilibrium (qe) was calculated as:| |
 | (4) |
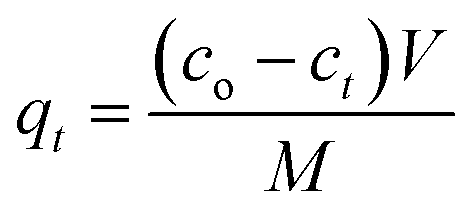
The amount of Pb adsorbed (mg Pb per g fiber) at a preselected time (qt) was calculated as:
| |
 | (5) |
where
co,
ct and
ce are the initial, preselected time
t, and equilibrium concentrations of Pb
2+, respectively, in the solution (mg L
−1);
V is the solution volume (L);
M is the amount of dry fiber used (g). For further elucidation of the sorption mechanism, the pseudo-first-order and the pseudo-second-order models were fitted to the kinetic data using the linear
eqn (6) and
(7), respectively.
| | |
ln(qe − qt) = lnqe − k1t
| (6) |
| |
 | (7) |
where
qe and
qt have the same definitions as in
eqn (4) and
(5) and are expressed in mg g
−1.
k1 (min
−1) and
k2 (g mg
−1 min
−1) are the rate constants of the pseudo-first-order reaction and pseudo-second-order adsorption, respectively
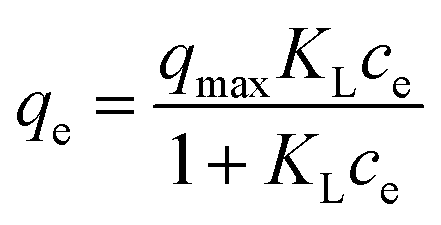
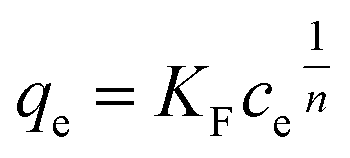
2.5 Adsorption isotherm studies
Adsorption experiments were carried out with varying concentrations from 5 ppm to 45 ppm of Pb2+ and adsorbent dosage of 0.1 g L−1. The loss in the volume during sampling was maintained under 5%. Throughout the experiments, the initial pH of the solution was kept constant at 5.4 and the solutions were stirred at 120 rpm for 24 h at 295 K. The Pb2+ concentration at equilibrium was analyzed. The relationship between the amount of Pb2+ adsorbed and its concentration at equilibrium was evaluated using Langmuir, extended Langmuir,26 and Freundlich isotherms. The monolayer adsorption onto homogeneously-distributed adsorption sites with no adsorbate–adsorbate interaction was used in the Langmuir isotherm model. The concept of the extended Langmuir isotherm model is that two different adsorbates compete for the active sites with the monolayer coverage and with no interaction between them. Multilayer adsorption on heterogeneous surfaces is considered in the Freundlich isotherm model. The equations of these isotherms and their parameters are summarized in Table 1.
Table 1 Adsorption equilibrium isotherm equations
| Isotherm |
Equation |
Parameters |
| Langmuir |
 (8) (8) |
qmax and KL |
| Extended Langmuir |
 (9) (9) |
qmax, b and KLm |
| Freundlich |
 (10) (10) |
KF and n |
Here, qe and ce have the usual meaning as described before; qmax is the maximum adsorption capacity at monolayer adsorption (mg g−1), n is the heterogeneity factor, and b (dimensionless) is a measure of the spread of the distribution of adsorption energies. It tends to unity as the surfaces become homogeneous.26 KL, KLm, and KF are the equilibrium constant for Langmuir, modified Langmuir, and Freundlich models, respectively.
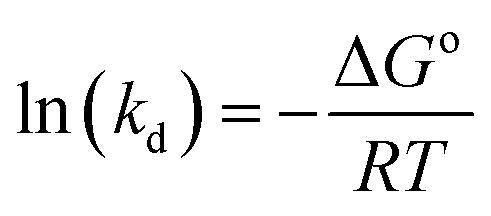
2.6 Thermodynamic studies
Adsorption thermodynamics and the nature of the adsorption process of Pb2+ were evaluated using three parameters: (i) change in free energy (ΔGo), (ii) enthalpy (ΔHo), and (iii) entropy (ΔSo). The parameters are essential in determining the feasibility and the nature of the adsorption process. They were determined using eqn (11) and (12).| | |
ΔGo = −RTln(kd)
| (11) |
| |
 | (12) |
By substituting eqn (13) in eqn (12), the apparent enthalpy and entropy for the adsorption of Pb2+ were determined from the van't Hoff eqn (14).
| |
 | (14) |
For the adsorption experiment, the value of kd is mL g−1, which can be made dimensionless using eqn (15).
where
∅ is the phase fraction parameter (the density of water) at the given temperature. For the temperatures, 0 °C, 23.2 °C, and 32.2 °C, the values of
∅ were 999.87, 997.49, and 995.10 g L
−1, respectively.
R is the universal gas constant (8.314 × 10
−3 kJ mol
−1 K
−1), and
T is the temperature (K).
2.7 Influence of competitive ions
The adsorption of Pb2+ in the presence of competing cations was studied by preparing binary solutions with Pb2+ and one other metal ion from the s- and d-blocks of the periodic table, either monovalent, bivalent, or trivalent. The selectivity of Pb2+ was studied at equal concentrations (ppm) of both metal ions in a fixed volume of the solution. A control, lacking competing ions, was also run. The binary solutions were treated with a fixed amount of the adsorbent. The adsorbent dose of 0.1 g L−1 was added to the binary solution and stirred for 24 h. The concentrations at the equilibrium and the preselected time were measured and calculated using eqn (4) and (5), respectively.
2.8 Column adsorption experiments
The study was carried out in a 7.8 cm long plastic column with an inner diameter of 1.5 cm, containing a layer of fiber adsorbent with a glass wool support on the top and bottom of the fiber layer. The apparatus was assembled as shown in Fig. 1. The influent solution was pumped through the column using a peristaltic pump in the downward direction from the solution reservoir, and the effluent was collected using a fraction collector in 10 mL glass tubes. The influent and effluent concentrations were both analyzed for Pb2+ using an Inductive Couple Plasma Mass Spectrometer (ICP-MS, Agilent 7700).
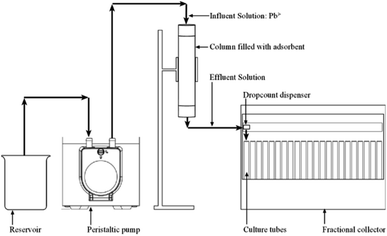 |
| | Fig. 1 Schematic diagram of the column adsorption experiment. | |
3. Results and discussion
3.1 Preparation and characterization of modified acrylic yarn
Screening of different AOCO adsorbents prepared from batch adsorption experiments indicated that AOCO30 had the highest adsorption capacity for Pb2+ per gram of the adsorbent (see Fig. S1†). As such, the rest of the studies were conducted using AOCO30. The surface modification of the substrate of the acrylic yarn was performed in a 2-step process described in the experimental section. In the first step, a part of the nitrile groups on the acrylic substrate underwent nucleophilic addition in the presence of at 67–70 °C for 30 min. The AO reaction mechanism has been reported in the literature.25 AO on the fiber surface resulted in the formation of a hydrogel layer due to bonding between the AO group and water molecules.27 At 70 °C, the AO reaction proceeded efficiently in methanol/water. The density of the AO groups formed on the fiber depended on the reaction time, as the nitrile to AO conversion is time-dependent. Temperature and hydroxylamine concentration were other determining factors.28 The second step was the room-temperature alkaline hydrolysis of the nitrile groups on the substrate. The pendant nitrile group on the acrylic yarn was stable in the basic solution at room temperature. Without AO, the conversion of nitrile to CO is not possible in ordinary conditions. The possible alkaline hydrolysis mechanism is presented in ESI Scheme S1.†
The physical properties of the fiber adsorbent also depended on the relative amounts of AO and CO present in the final product. With an increase of AO on the fiber, it became first sticky and then hard and brittle. The base treatment of the adsorbent with different AO contents produced different products. The adsorbents were fibrous for AOCO10 and AOCO20 and jelly-like for AOCO30, AOCO40, and AOCO60. In the case of AOCO120, the fiber dissolved.
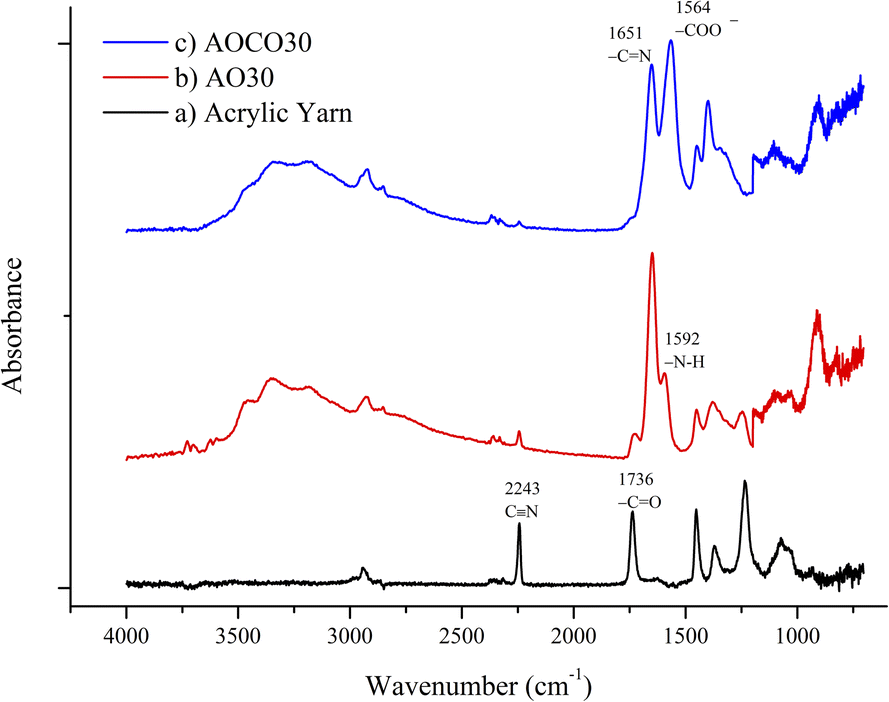
The acrylic yarn, intermediate and final products of the adsorbent synthesis with an AO reaction time of 30 min were characterized using IR spectra, as shown in Fig. 2 (see the ESI in Fig. S2 and S3† for adsorbent synthesis with different AO and CO reaction times). The C![[triple bond, length as m-dash]](https://www.rsc.org/images/entities/char_e002.gif) N stretching frequency at 2243 cm−1 and the ester C
N stretching frequency at 2243 cm−1 and the ester C![[double bond, length as m-dash]](https://www.rsc.org/images/entities/char_e001.gif) O frequency at 1736 cm−1 were used to follow the reaction. The intensities of these peaks decreased after the amidoximation and carboxylation reactions, and new frequencies appeared at 1651 cm−1, 1564 cm−1, and 909 cm−1. These were assigned to CN, COO−, and N–O groups on the fiber, respectively. The absorption peak for the amine N–H bending at 1592 cm−1 was buried under the broad signals for the CO groups after hydrolysis. The intensities of the broad absorption bands of OH were also observed around 3000 cm−1 in all the products. The absorption peak of the acrylate ester shrank as it was converted to CO during hydrolysis.
O frequency at 1736 cm−1 were used to follow the reaction. The intensities of these peaks decreased after the amidoximation and carboxylation reactions, and new frequencies appeared at 1651 cm−1, 1564 cm−1, and 909 cm−1. These were assigned to CN, COO−, and N–O groups on the fiber, respectively. The absorption peak for the amine N–H bending at 1592 cm−1 was buried under the broad signals for the CO groups after hydrolysis. The intensities of the broad absorption bands of OH were also observed around 3000 cm−1 in all the products. The absorption peak of the acrylate ester shrank as it was converted to CO during hydrolysis.
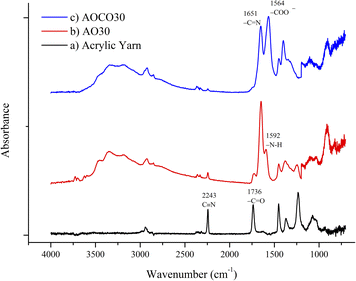 |
| | Fig. 2 IR spectra of (a) acrylic yarn, (b) AO30 and (c) AOCO30. | |
IR spectral analysis was used to quantify the AO and CO densities on the fiber surface. The intensities of the nitrile peaks were normalized to the intensity of the methylene peaks in the spectra in the calculation for comparison (Fig. S4†). The AO and CO densities obtained were used to measure the adsorbent in further studies. For AOCO30, the calculated AO% and conversion of the nitriles into CO and CS were 41% and 42%, respectively.
The CN stretching frequency at 2243 cm−1 and the ester CO frequency at 1736 cm−1 were used to follow the reaction. The intensities of these peaks decreased after amidoximation and carboxylation reactions, and new frequencies at 1651 cm−1, 1564 cm−1, and 909 cm−1 appeared, which are ascribed to CN, COO−, and N–O groups in the fiber, respectively. The absorption peak for the amine N–H bending at 1592 cm−1 was buried under the broad signals for the CO groups after hydrolysis. The intensities of the broad absorption bands of OH were also observed at around 3000 cm−1 in all the products. The absorption peak of the acrylate ester shrank as it got converted to CO during hydrolysis.
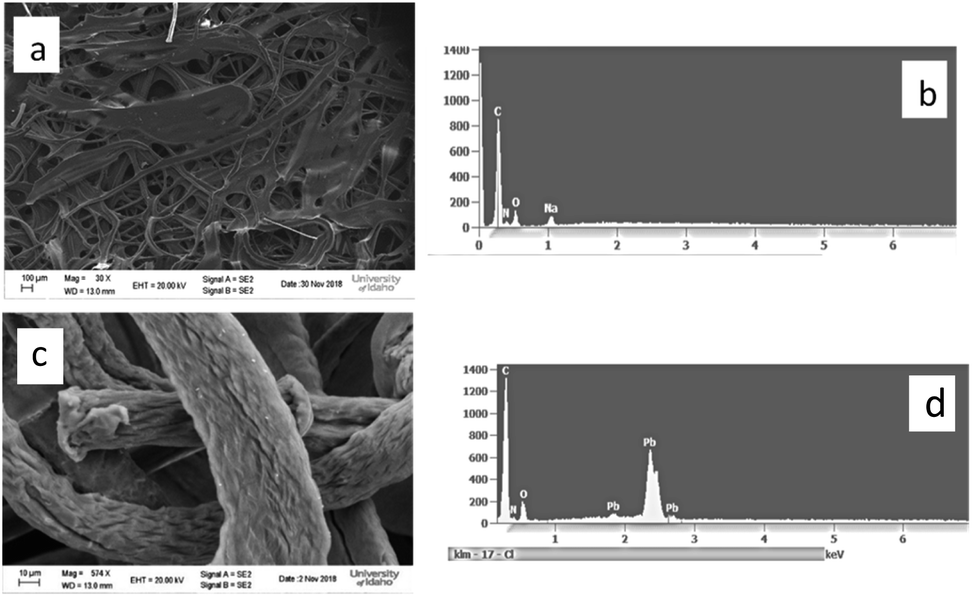
The SEM image of the adsorbent AOCO30 before adsorption indicates a fused mass-like structure with porous surfaces (Fig. 3a). The elemental composition of the adsorbent before the Pb2+ treatment was accessed by surface mapping and XEDS spectra. In the XEDS spectra, the prominent peaks related to C, O, N, and Na were noticed (Fig. 3b). A fibrous morphology was observed after the sorption of Pb2+ on the adsorbent (Fig. 3c). After treatment with Pb2+ solution, new peaks related to Pb2+ were observed (Fig. 3d).
 |
| | Fig. 3 SEM images of (a) AOCO30 before Pb2+ adsorption, (c) AOCO30 after Pb2+ adsorption; XEDS of AOCO30 (b) before and (d) after Pb2+ adsorption. | |
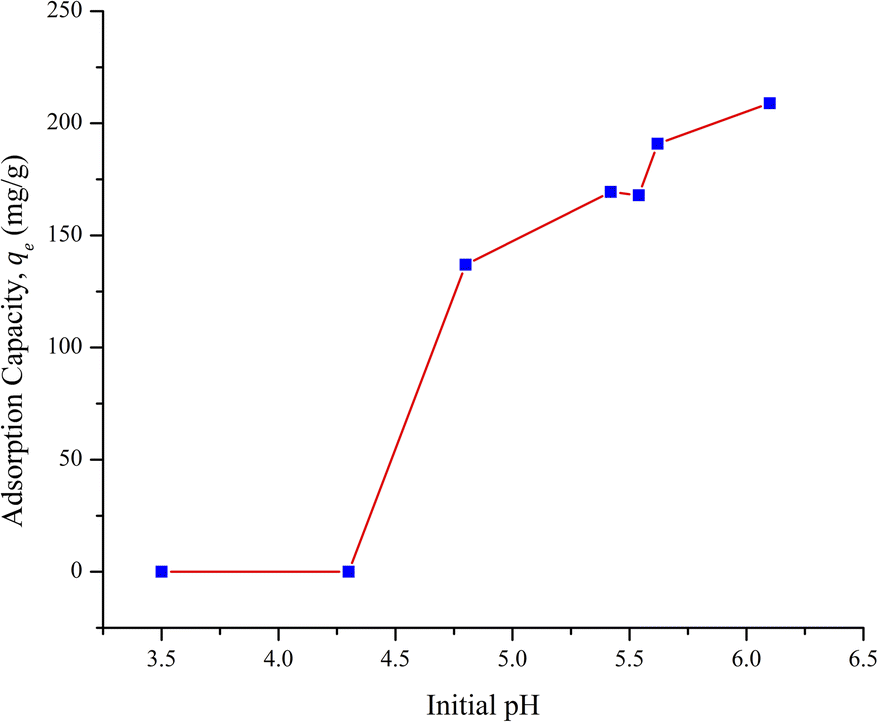
The pH of the solution played an essential role in the adsorption of Pb2+ onto the fiber since it affected both the surface charge on the adsorbent and the existence of the lead species in the solution. Lead can exist as Pb2+, Pb(OH)+, Pb(OH)20, and Pb(OH)3−, depending on the pH of the solution.29 pH influence on the adsorption was studied with the solution pH initially adjusted and without control throughout the experiment. The amount adsorbed vs. initial pH is presented in Fig. 4. It was observed that the adsorption of Pb2+ failed when the pH of the solution was less than 4.3 since the competitive proton adsorption blocked the Pb2+ binding sites.30 At a pH higher than 7, Pb was hydrolyzed and precipitated as Pb(OH)2. The precipitated form did not play a role in the removal of Pb2+ under the solution conditions used. The pH values beyond the point at which precipitation of lead was formed were not studied.
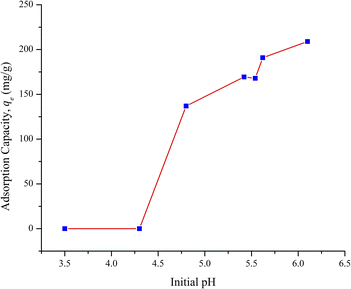 |
| | Fig. 4 Effect of initial pH of the solution on the adsorption capacity of Pb2+ by AOCO30. (Dosage = 0.1 g L−1, c0 = 25 ppm, T = 295 K, and contact time = 24 h). | |
3.2 Kinetics and thermodynamics of Pb2+ adsorption on modified yarn
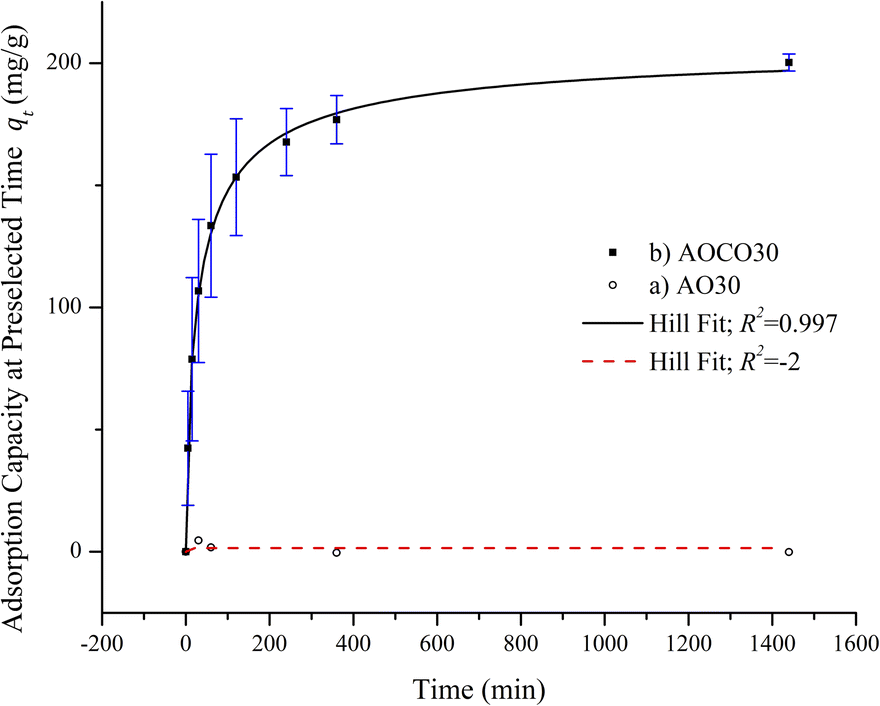
The adsorption kinetics of the adsorbents AO30 and AOCO30 were studied. Fig. 5 shows the adsorption of Pb2+ on AO30 and AOCO30 as a function of contact time. In the case of AOCO30, the adsorption equilibrium was achieved within two hours. The adsorption curve slope was very steep in the first hour and flattened out as the active sites on the adsorbent were occupied.31 With AO30, no significant adsorption was observed. Further elucidation of the kinetic mechanism was performed by fitting the kinetic data to the pseudo-first-order and pseudo-second-order kinetic models. The graphs of ln(qe − qt) against t and  against t yielded a linearized form of a pseudo-first-order reaction and pseudo-second-order reaction, respectively, and the data are presented in (Fig. S5 and S6†). The calculated adsorption kinetic parameters are tabulated in Table 2. The pseudo-second-order kinetic model fits better than the pseudo-first-order model, as shown by the respective correlation coefficients closer to unity. Also, the calculated qe was much closer to the experimental data (qe,exp). This suggests that the rate-limiting step was not pseudo-first order, but pseudo-second-order, and involved chemisorption, i.e., chemical interactions between adsorbate and adsorbent.32
 |
| | Fig. 5 Adsorption of Pb2+ on (a) AO30 and (b) AOCO30 as a function of contact time (initial concentration = 25 ppm; temperature = 22 ± 3 °C; adsorbent dose = 0.1 g L; pH = 5.4; stirring rate = 120 rpm). | |
Table 2 Parameters of pseudo-first order and pseudo-second order kinetics for Pb2+ adsorption on AOCO30 (initial concentration = 25 ppm; temperature = 22 ± 3 °C; adsorbent dose = 0.1 g L; pH = 5.4; duration 24 h)
| Order |
qe,exp (mg g−1) |
qe,cal (mg g−1) |
k1 (min−1) |
k2 (g mg−1 min−1) |
R2 |
| Pseudo-first order model |
200.23 |
105.56 |
0.011 |
|
0.839 |
| Pseudo-second order model |
198.81 |
|
3.24 × 10⁻⁴ |
0.997 |
The variation of initial concentrations of Pb2+ ranging from 5 to 45 ppm solutions on the adsorption capacity was evaluated at 295 K. The observed results are presented in Fig. 6. It showed that the adsorption capacity increased with a steep rise with the increase in the initial concentration from 5 ppm to 25 ppm and a plateau was reached beyond the high concentrations. The availability of the vacant sites at low concentrations indicates the steady rise in the adsorption capacity but at higher concentrations, these sites are saturated and hence form a plateau.
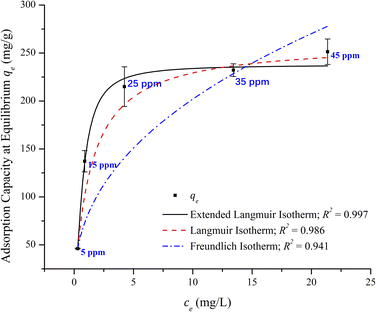 |
| | Fig. 6 Effect of the initial concentration on the adsorption capacity and adsorption equilibrium isotherms of Pb2+ on the adsorbent in 24 h. Adsorbent dose = 0.1 g L; pH = 5.45; T = 22 °C. | |
To explain the Pb2+ sorption mechanism, the experimental data were analyzed using Langmuir, the extended Langmuir, and Freundlich isotherm models. The non-linear fitting of the isotherm models for the obtained experimental data is also shown in Fig. 6 as a plot of qe and ce. The parameters for all adsorption isotherms with their correlation coefficients for nonlinear fittings are summarized in Table 3. The equilibrium data show that the extended Langmuir isotherm has a correlation coefficient closer to unity. Hence, it may be a better fitting to the adsorption behavior of the adsorbent in the sorption of Pb2+. This indicates that adsorption takes place on the surface of the adsorbent as a monolayer homogeneous adsorption process with adsorbate–adsorbate competing for the active sites with no interactions, i.e., selective adsorption for Pb2+ than Na+.
Table 3 Parameters of adsorption isotherm of Pb2+ (nonlinear fitting)
| Isotherms |
Parameters |
Units |
Values |
| Langmuir |
qmax |
mg g−1 |
261.39 |
| KL |
L mg−1 |
0.713 |
| R2 |
|
0.986 |
| Extended Langmuir |
qmax |
mg g−1 |
237.74 |
| KLm |
L mg−1 |
1.598 |
| b |
|
1.579 |
| R2 |
|
0.997 |
| Freundlich |
KF |
mg1−1/n L1/n g−1 |
76.69 |
| ns |
|
2.381 |
| R2 |
|
0.941 |
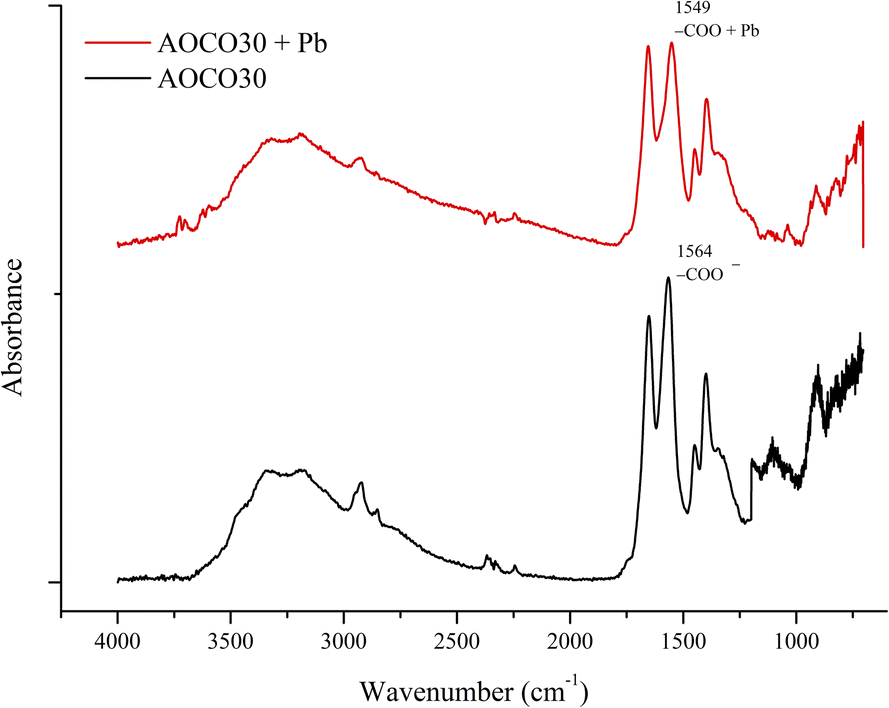
The kinetic study showed that the adsorption of Pb2+ is pseudo-second-order kinetics, suggesting that it is a chemisorption-driven process. The thermodynamic studies showed that the adsorption is feasible and endothermic in nature. The sorption mechanism can be explained by the FTIR study. The presence of the NaOH trapped within the gel results in the existence of carboxylate and negatively charged amidoxime structure on the surface of the adsorbent. The negatively charged surface was favorable for the adsorption of Pb2+ by electrostatic attraction.33 In addition, some chelation may also occur during the adsorption process, but because of its complex chemistry, it is not clearly understood. However, the participation of AO and CO is involved in the adsorption of Pb2+ from the aqueous solution. FTIR spectra of the adsorbent before and after the adsorption of Pb2+ showed a red-shift in the carboxylate peak of about 15 cm−1 in Fig. 7. Hence, the synergistic effect of both AO and CO can be predicted in the sorption mechanism.
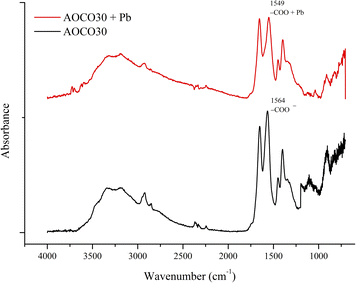 |
| | Fig. 7 Comparison of FTIR spectra of the adsorbent before and after the adsorption of Pb2+. | |
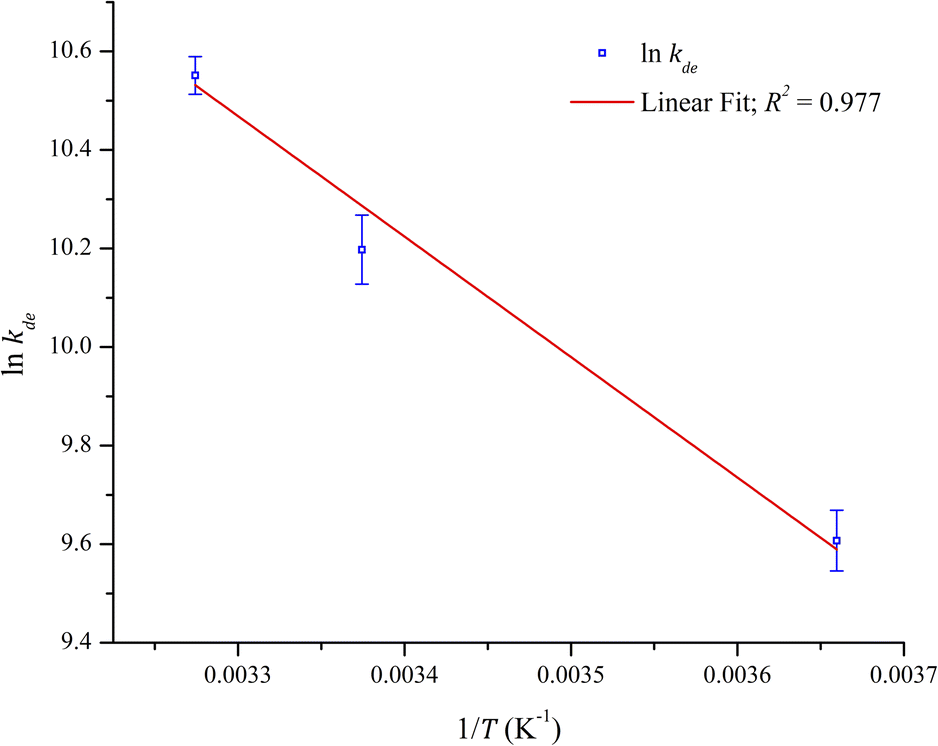
The thermodynamic parameters were evaluated using the adsorption isotherm of Pb2+. The values of ΔHo and ΔSo were determined from the van't Hoff linear plot of ln(kde) against 1/T. Using the slope and the intercept from Fig. 8, ΔHo and ΔSo were obtained, whereas ΔGo was obtained using eqn (11). The results are summarized in Table 4. The values of ΔGo obtained for all temperatures in the study were negative, signifying that the adsorption process was thermodynamically favored and spontaneous. The positive values of ΔHo indicate an endothermic adsorption process and is supported by the increase in the adsorption capacity with the rise in temperature. Similarly, ΔSo is also a positive value, which indicates an increase in randomness during the adsorption of Pb2+. This is more likely due to the release of Na+ during the selective adsorption of Pb2+.
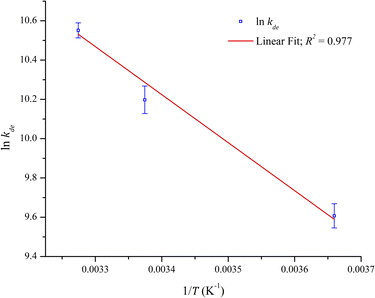 |
| | Fig. 8 The van't Hoff plot for the adsorption of Pb2+. | |
Table 4 Thermodynamic parameters for the adsorption of Pb2+ (adsorbent dose = 0.1 g L−1; initial concentration = 25 ppm; contact time = 24 h)
| T (K) |
kde |
ΔHo (kJ mol−1) |
ΔSo (kJ mol−1) |
ΔGo at 296.35 K (kJ mol−1) |
| 273.25 |
14890.13 |
20.33 |
0.15 |
−24.12 |
| 296.35 |
26885.70 |
| 305.42 |
38241.83 |
3.3 Application of modified yarn for the sorption of Pb2+ from drinking water
The adsorption of Pb2+ in the presence of competing cations was carried out. For this purpose, binary solutions were prepared with Pb2+ and one other metal ion from the s- and d-blocks of the periodic table, either monovalent, bivalent, or trivalent. The selectivity of Pb2+ was studied at equal concentrations (ppm) of both metal ions in a fixed volume of solution. A control, lacking competing ions, was also run. The binary solutions were treated with a fixed amount of adsorbent. Table 5 shows the adsorption capacities (qe) at equilibrium, the distribution coefficient (kd), and selectivity coefficient (k). The data show that Pb2+ is exclusively selected from binary mixtures with K+, Ca2+, Cd2+, and Ni2+ after 2 h of treatment. There was competitive adsorption of Pb2+/Cu2+ and Pb2+/Cr3+ after the solution was brought to pH 5.6. Fig. S7a, b, S8a, b, and S9a, b† show that the competing ions altered the adsorption capacity of Pb2+ and competing adsorbates in mixtures. The least effect was observed in the presence of K+ and ions. Competitive adsorption was observed for Cu2+ and Cr3+ after increasing the pH to 5.6. In the case of Cd2+ and Ni2+, there was initial adsorption of the competing elements, but later in the run, they were displaced by Pb2+. The pH of the solution played a vital role in the adsorption capacity of the adsorbent and determined the species of metal ions that were adsorbed.
Table 5 Selectivity parameters of Pb2+ and competing metals in binary solutions at 22 °C. (Adsorbent dose = 0.1 g L−1; initial concentration = 25 ppm each and contact time = 2 h)
| Metal ion |
Competing ion |
qe (mg g−1) of Pb2+ |
qe (mg g−1) of competing ion |
kd (L g−1) of Pb2+ |
kd (L g−1) of competing ion |
k |
| pH adjusted to 5.4. |
| Pb2+ |
— |
129.76 |
— |
9.58 |
— |
— |
| Pb2+ |
K+ |
136.06 |
4.82 |
9.93 |
0.19 |
51.77 |
| Pb2+ |
Ca2+ |
104.08 |
4.42 |
7.26 |
0.18 |
39.56 |
| Pb2+ |
Cu2+ |
46.56 |
45.80 |
2.11 |
2.87 |
0.74 |
| Pb2+a |
Cr3+a |
50.08 |
33.06 |
2.51 |
1.45 |
1.73 |
| Pb2+ |
Ni2+ |
97.87 |
45.61 |
5.69 |
2.57 |
2.21 |
| Pb2+ |
Cd2+ |
107.14 |
31.72 |
7.07 |
1.30 |
5.42 |
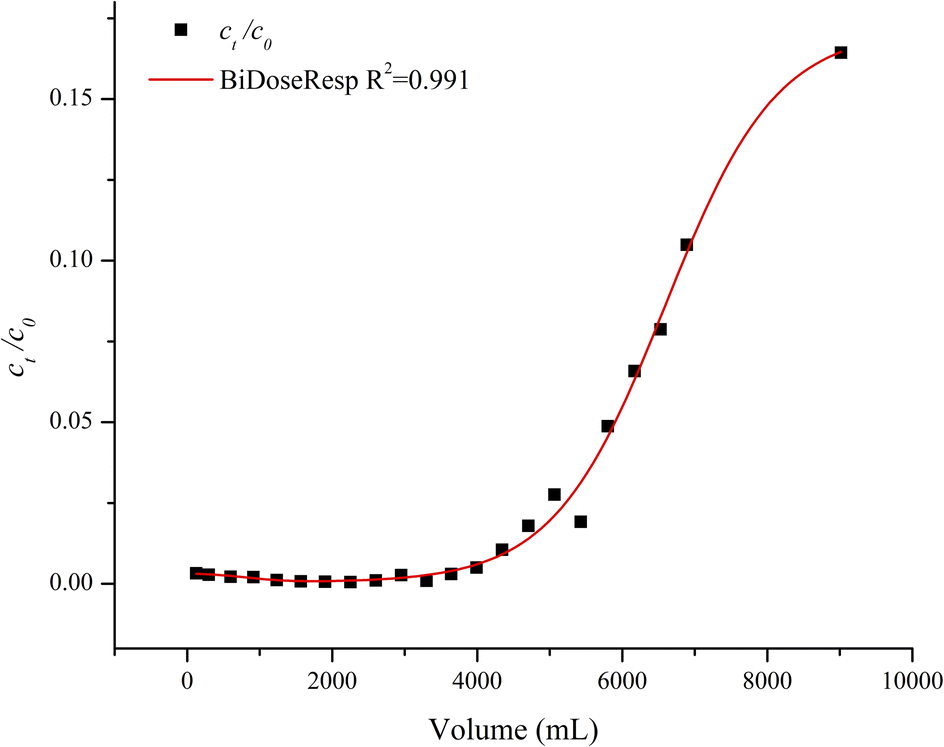
The AO/CO-containing fiber adsorbent derived from acrylic yarn is highly effective for the adsorption of lead from water. The fiber can be placed in lead-contaminated water in a container to remove the toxic metal from the water. It can also be packed in a column like a filter to remove lead from the flowing water. A solution containing 1 ppm of lead was fed into the column from the top using a peristaltic pump at a flow rate of about 4.4 mL per minute. Lead concentration in the effluent was found to be less than 10 ppb, the permissible level of lead in drinking water, for at least the first four liters of the water passing through the column (Fig. 9). The lead break-through point, i.e., effluent containing more than 10 ppb lead, occurred at about 4.3 liters. This simple column adsorption experiment demonstrates that the amidoxime/carboxylate-containing fiber adsorbent derived from acrylic yarn may be a potential new filter material for removing lead from contaminated potable water.
 |
| | Fig. 9 Adsorption of lead in water passing through a column packed with AOCO fiber adsorbent. Influent 1 ppm Pb, flow rate 4.4 mL min−1, 0.5 g fiber, fiber bed height 2 cm, column diameter 1.5 cm, room temperature 22 °C. | |
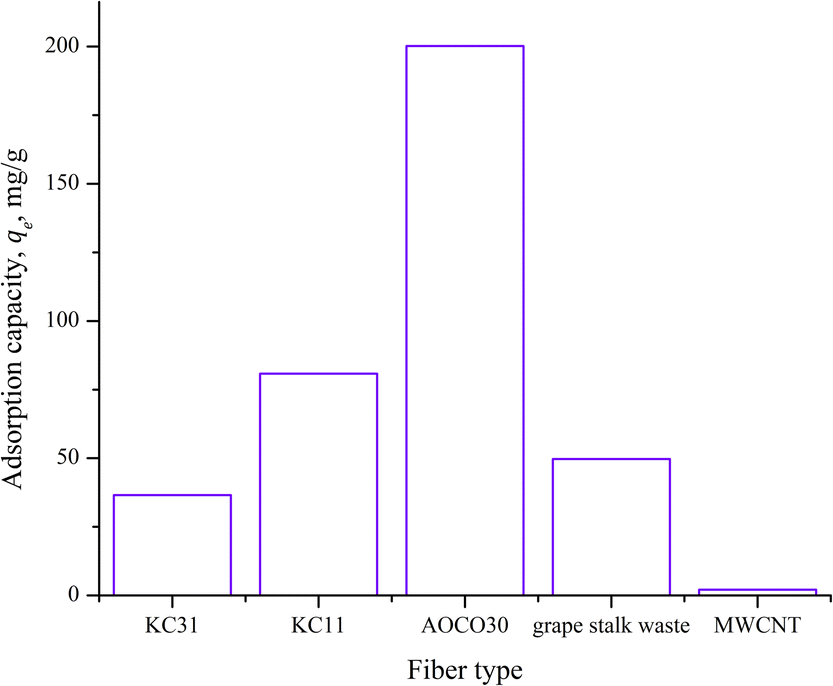
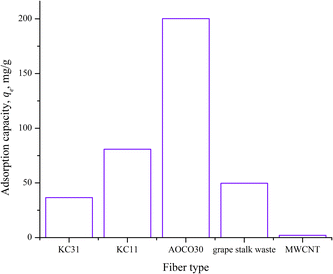
Some chelating fibers are commercially available for removing toxic metals – lead – from water. A brief description of the different adsorbents considered in this study is presented in Table 6. Two types of commercial chelating fibers: KC11 and KC31 were tested in this study for comparison. Under the same experimental conditions, KC11 and KC31 showed about 50% and 25% Pb2+ adsorption capacity, respectively, relative to AOCO30, as shown in Fig. 10 after 6 h of contact. AOCO also showed a high sorption capacity of Pb2+ (200 mg g−1 or 0.97 mmol g−1) compared to other adsorbents such as grape stalk waste (0.24 mmol g−1)31 and multiwalled carbon nanotubes (MWCNT, 9.92 × 10⁻³ mmol g−1).34
Table 6 Comparison of different adsorbents with AOCO30
| Adsorbent |
Functional group |
Substrate |
Preparation method |
| KC11 |
Iminodiacetate |
Polyethylene |
Radiation-induced grafting technique |
| KC31 |
Polyamine |
Polyethylene |
Radiation-induced grafting technique |
| AOCO30 |
Amidoxime, carboxylate, and nitrile |
Acrylic yarn |
2-Step chemical processes: AO and CO |
| Grape stalk waste |
Unspecified |
Grape stalk |
Drying at 110 °C until constant weight is reached |
| Oxidized multiwalled carbon nanotubes |
Hydroxyl, carboxyl and carbonyl |
Multiwalled carbon nanotubes |
Oxidation of multiwalled carbon nanotubes with nitric acid followed by calcination process |
 |
| | Fig. 10 Comparison of the adsorption capacity of different commercial adsorbent materials with AOCO30. | |
4. Conclusion
This work established that acrylic yarn can be used as a starting material for synthesizing amidoxime and carboxylate-containing chelating fibers for removing Pb2+ from water. The study showed that AOCO30 had the maximum adsorption of Pb2+. The synergistic effect of AO and CO can be predicted from the IR study in the adsorption process and the adsorption capacity increases with an increase in pH. The Pb2+ adsorption process follows pseudo-second-order kinetics, suggesting the process probably involves chemisorption. The adsorption isotherm study on the system shows that the extended Langmuir isotherm fits well with the data with a qmax of 238 mg lead per gram fiber. The Pb2+ adsorption is endothermic (ΔHo = 20.3 kJ per mole) and the adsorption capacity increases with temperature. Gibb's free energy was about −24.12 kJ mol−1 at 296.35 K and the entropy was 0.15 kJ mol−1. The selectivity for Pb2+ varied with the nature of the metal ions. It was highly selective for Pb2+ in a binary mixture with Na+ and Ca2+. Transition metal ions showed varying degrees of competitiveness in the adsorption process. The adsorption process was observed to be effective after fixing the pH of the binary solution for Cu2+ and Cr3+ to pH 5.6. The column adsorption test showed that the fiber material can reduce water containing 1 ppm of lead to less than 10 ppb of lead, as required by the drinking water standard with good efficiency. When compared with other commercial chelating adsorbents and from agricultural origin, it has a higher removal capacity of Pb2+ from the aqueous solution. This new fiber adsorbent is easy to prepare, and the starting material is readily available. It appears promising for the remediation of lead-contaminated aquatic systems, including lead-contaminated potable water.
Author contributions
AT conceptualized, investigated, developed the methodology; and wrote the original draft. HBP conceptualized the adsorbent preparation and supervised it. IP reviewed and edited the manuscript.
Conflicts of interest
The authors declare no competing financial interest.
Acknowledgements
The work described has been published previously in parts as an academic dissertation by ProQuest LLC with the copyright retained by Dr A. Tuladhar. The author would like to thank LCW Supercritical Technologies (Seattle, WA). The publication of this article was funded by the University of Idaho – Open Access Publishing Fund.
References
- P. Li, C. Lin, H. Cheng, X. Duan and K. Lei, Contamination and health risks of soil heavy metals around a lead/zinc smelter in southwestern China, Ecotoxicol. Environ. Saf., 2015, 113, 391–399 CrossRef CAS PubMed
 .
. - S. Khan, Q. Cao, Y. M. Zheng, Y. Z. Huang and Y. G. Zhu, Health risks of heavy metals in contaminated soils and food crops irrigated with wastewater in Beijing, China, Environ. Pollut., 2008, 152, 686–692 CrossRef CAS PubMed .
- J. J. Chisolm, Lead Poisoning, Sci. Am., 1971, 224, 15–23 CrossRef CAS PubMed .
- A. A. Alghamdi, A.-B. Al-Odayni, W. S. Saeed, A. Al-Kahtani, F. A. Alharthi and T. Aouak, Efficient Adsorption of Lead (II) from Aqueous Phase Solutions Using Polypyrrole-Based Activated Carbon, Materials, 2019, 12 DOI:10.3390/ma12122020 .
- OUSEPA, Basic Information about Lead in Drinking Water, https://www.epa.gov/ground-water-and-drinking-water/basic-information-about-lead-drinking-water, accessed 29 April 2022 Search PubMed.
- WHO|Guidelines for drinking-water quality, 4th edn, https://www.who.int/water_sanitation_health/publications/2011/dwq_guidelines/en/, accessed 26 April 2020 Search PubMed.
- D. Feng, C. Aldrich and H. Tan, Treatment of acid mine water by use of heavy metal precipitation and ion exchange, Miner. Eng., 2000, 13, 623–642 CrossRef CAS .
- M. Sadrzadeh, T. Mohammadi, J. Ivakpour and N. Kasiri, Neural network modeling of Pb2+ removal from wastewater using electrodialysis, Chem. Eng. Process, 2009, 48, 1371–1381 CrossRef CAS .
- R. K. Gautam, A. Mudhoo, G. Lofrano and M. C. Chattopadhyaya, Biomass-derived biosorbents for metal ions sequestration: adsorbent modification and activation methods and adsorbent regeneration, J. Environ. Chem. Eng., 2014, 2, 239–259 CrossRef CAS .
- R. Semiat, Present and Future, Water Int., 2000, 25, 54–65 CrossRef CAS .
- G. M. Al-Senani and F. F. Al-Fawzan, Adsorption study of heavy metal ions from aqueous solution by nanoparticle of wild herbs, Egypt. J. Aquat. Res., 2018, 44, 187–194 CrossRef .
- G. E. Fryxell, S. V. Mattigod, Y. Lin, H. Wu, S. Fiskum, K. Parker, F. Zheng, W. Yantasee, T. S. Zemanian, R. S. Addleman, J. Liu, K. Kemner, S. Kelly and X. Feng, Design and synthesis of self-assembled monolayers on mesoporous supports (SAMMS): the importance of ligand posture in functional nanomaterials, J. Mater. Chem., 2007, 17, 2863–2874 RSC .
- D. T. Sun, L. Peng, W. S. Reeder, S. M. Moosavi, D. Tiana, D. K. Britt, E. Oveisi and W. L. Queen, Rapid, Selective Heavy Metal Removal from Water by a Metal–Organic Framework/Polydopamine Composite, ACS Cent. Sci., 2018, 4, 349–356 CrossRef CAS .
- C. Wang, X. Liu, N. K. Demir, J. P. Chen and K. Li, Applications of water stable metal–organic frameworks, Chem. Soc. Rev., 2016, 45, 5107–5134 RSC .
- M. Mon, R. Bruno, J. Ferrando-Soria, D. Armentano and E. Pardo, Metal–organic framework technologies for water remediation: towards a sustainable ecosystem, J. Mater. Chem. A, 2018, 6, 4912–4947 RSC .
- J. Zhu, S. Wei, M. Chen, H. Gu, S. B. Rapole, S. Pallavkar, T. C. Ho, J. Hopper and Z. Guo, Magnetic nanocomposites for environmental remediation, Adv. Powder Technol., 2013, 24, 459–467 CrossRef CAS .
- S. Deng, R. Bai and J. P. Chen, Behaviors and mechanisms of copper adsorption on hydrolyzed polyacrylonitrile fibers, J. Colloid Interface Sci., 2003, 260, 265–272 CrossRef CAS .
- B. W. Zhang, K. Fischer, D. Bieniek and A. Kettrup, Synthesis of carboxyl group containing hydrazine-modified
polyacrylonitrile fibres and application for the removal of heavy metals, React. Polym., 1994, 24, 49–58 CrossRef CAS .
- R. Saliba, H. Gauthier, R. Gauthier and M. Petit-Ramel, Adsorption of copper(II) and chromium(III) ions onto amidoximated cellulose, J. Appl. Polym. Sci., 2000, 75, 1624–1631 CrossRef CAS .
- M. L. Rahman, S. M. Sarkar, M. M. Yusoff and M. H. Abdullah, Efficient removal of transition metal ions using poly(amidoxime) ligand from polymer grafted kenaf cellulose, RSC Adv., 2016, 6, 745–757 RSC .
- S.-H. Choi, M.-S. Choi, Y.-T. Park, K.-P. Lee and H.-D. Kang, Adsorption of uranium ions by resins with amidoxime and amidoxime/carboxyl group prepared by radiation-induced polymerization, Radiat. Phys. Chem., 2003, 67, 387–390 CrossRef CAS .
- C. Zhijiang, J. Jianru, Z. Qing and Y. Haizheng, Preparation of amidoxime surface-functionalized polyindole (ASFPI) nanofibers for Pb(II) and Cd(II) adsorption from aqueous solutions, RSC Adv., 2015, 5, 82310–82323 RSC .
- Z. Yin, J. Xiong, M. Chen, S. Hu and H. Cheng, Recovery of uranium(VI) from aqueous solution by amidoxime functionalized wool fibers, J. Radioanal. Nucl. Chem., 2016, 307, 1471–1479 CrossRef CAS .
- L. Stephenson, W. K. Warburton and M. J. Wilson, Reaction of some aromatic nitriles with hydroxylamine to give amides, and an alternative preparation of amidoximes, J. Chem. Soc. C, 1969, 861–864 RSC .
- N. Horzum, T. Shahwan, O. Parlak and M. M. Demir, Synthesis of amidoximated polyacrylonitrile fibers and its application for sorption of aqueous uranyl ions under continuous flow, Chem. Eng. J., 2012, 213, 41–49 CrossRef CAS .
- A. Kapoor, J. A. Ritter and R. T. Yang, An extended Langmuir model for adsorption of gas mixtures on heterogeneous surfaces, Langmuir, 1990, 6, 660–664 CrossRef CAS .
- H. Zhao, X. Liu, M. Yu, Z. Wang, B. Zhang, H. Ma, M. Wang and J. Li, A Study on the Degree of Amidoximation of Polyacrylonitrile Fibers and Its Effect on Their Capacity to Adsorb Uranyl Ions, Ind. Eng. Chem. Res., 2015, 54, 3101–3106 CrossRef CAS .
- W. Lin, Y. Lu and H. Zeng, Studies of the preparation, structure, and properties of an acrylic chelating fiber containing amidoxime groups, J. Appl. Polym. Sci., 1993, 47, 45–52 CrossRef CAS .
- P. Delahay, M. Pourbaix and P. V. Rysselberghe, Potential-pH Diagram of Lead and its Applications to the Study of Lead Corrosion and to the Lead Storage Battery, J. Electrochem. Soc., 1951, 98, 57 CrossRef CAS .
- C.-H. Weng and C. P. Huang, Adsorption characteristics of Zn(II) from dilute aqueous solution by fly ash, Colloids Surf., A, 2004, 247, 137–143 CrossRef CAS .
- M. Martínez, N. Miralles, S. Hidalgo, N. Fiol, I. Villaescusa and J. Poch, Removal of lead(II) and cadmium(II) from aqueous solutions using grape stalk waste, J. Hazard. Mater., 2006, 133, 203–211 CrossRef .
- Y. S. Ho and G. McKay, Pseudo-second order model for sorption processes, Process Biochem., 1999, 34, 451–465 CrossRef CAS .
- A. Hasan Fahmi, A. Wahid Samsuri, H. Jol and D. Singh, Physical modification of biochar to expose the inner pores and their functional groups to enhance lead adsorption, RSC Adv., 2018, 8, 38270–38280 RSC .
- D. Xu, X. Tan, C. Chen and X. Wang, Removal of Pb(II) from aqueous solution by oxidized multiwalled carbon nanotubes, J. Hazard. Mater., 2008, 154, 407–416 CrossRef CAS .
|
| This journal is © The Royal Society of Chemistry 2022 |
Click here to see how this site uses Cookies. View our privacy policy here. 
 Open Access Article
 This Open Access Article is licensed under a Creative Commons Attribution-Non Commercial 3.0 Unported Licence
 *ac,
Horng-Bin Pan
*ac,
Horng-Bin Pan

 (8)
(8) (9)
(9) (10)
(10)


 against t yielded a linearized form of a pseudo-first-order reaction and pseudo-second-order reaction, respectively, and the data are presented in (Fig. S5 and S6†). The calculated adsorption kinetic parameters are tabulated in Table 2. The pseudo-second-order kinetic model fits better than the pseudo-first-order model, as shown by the respective correlation coefficients closer to unity. Also, the calculated qe was much closer to the experimental data (qe,exp). This suggests that the rate-limiting step was not pseudo-first order, but pseudo-second-order, and involved chemisorption, i.e., chemical interactions between adsorbate and adsorbent.32