 Open Access Article
A hybrid microwave sintered PZT composite as a flexible piezoelectric nanogenerator†
T. Avanish Babua and
W. Madhuri *b
*b
aDepartment of Physics, School of Advanced Sciences, Vellore Institute of Technology, Vellore, Tamilnadu 632014, India. E-mail: avani.thirumalasetty@gmail.com
bCeramic Composites Laboratory, Centre for Functional Materials, SAS, VIT, Vellore-632014, Tamilnadu, India. E-mail: madhuriw12@gmail.com
First published on 30th November 2022
Abstract
Interest in piezoelectric nanogenerators has grown extensively due to high piezoelectric coefficients. Piezoelectric ceramic-based devices have dominated research in large-scale energy harvesting. Morphotropic phase boundary PbZr0.52Ti0.48O3 (MPB-PZT) synthesized using Hybrid Microwave Sintering (HMS) at a low temperature (940 °C) for 20 min has emerged as a dense ceramic. The Rietveld refinement studies confirm its dual phase (tetragonal (P4mm) and rhombohedral (R3m)). The PZT ceramic is exploited as a piezoelectric material, which can improve the output piezoelectric potential of a piezoelectric nanogenerator (PENG). Multi-walled carbon nanotubes (MWCNTs) are evenly distributed in the PZT composite to reduce the internal resistance of the PENG. According to the percolation theory, small amounts of MWCNTs dispersed within the composite ink can significantly improve the output voltage of the PENG by acting as conductive bridges between the polymer (polyvinylpyrrolidone (PVP)) and ceramic particles. The concentration of PZT and the amount of MWCNTs are changed to enhance the device's output voltage. As a result, an optimized PENG with a PZT (1.5 g)/MWCNT (0.06 wt%)/PVP (4 g) (PVP – polyvinylpyrrolidone) composite film is obtained. The PENGs are mechanically poled. The optimised output voltage of the PENG is 16 Vpp, which could light up a series of 20 commercial light emitting diodes (LEDs). The PENG is attached to footwear and is noticed to efficiently harvest energy from daily human activities which demonstrate its practical applications.
1 Introduction
With increasing climatic changes due to global warming caused by the effluents from fossil fuels, demand for clean energy as well as renewable energy sources is increasing day by day. This has led researchers to explore renewable energy sources like hydro energy, solar energy, nuclear energy and wind energy. However, these renewable energy sources need significant financial investment and infrastructure, limiting the widespread utilization of renewable energy in daily life. Batteries cannot replace the current energy demand, they have shorter life time and its disposal would add to environmental pollution.1 On the other hand, mechanical energy is an optimal alternative. Compared to other technologies, it is abundant in nature and its self-powered technology could replace traditional batteries. Pierre and Jacques Curie first proposed the conversion of vibrational energy to electrical energy through the piezoelectric effect.2 Piezoelectric energy sources are convenient and created by vibration sources such as roadways, railways, surrounding vibrations in the environment, body movements, etc. and they are applicable in various fields. The state of California converted its normal road highways to smart highways using piezoelectric materials. Piezoelectric renewable energy is attracting researchers’ attention because of many factors like being economical and pollution-free. It could replace other green energy due to being low cost and maintenance-free. Among piezoelectric materials, PZT has high piezoelectric coefficients and high transition temperatures compared to other ferroelectric materials. In ABO3 perovskites, B cation (3d states) and anion (2p states) hybridization is crucial for ferroelectricity in the PZT, and A cation (lead) and anion (oxygen) hybridization leads to huge strain. It can automatically stabilize the phase of the ferroelectric materials. But in other ferroelectric materials, the interaction between the A cation and anion (oxygen) is completely ionic and it has less sensitivity compared to PZT materials.3 Among all ferroelectrics, lead zirconium titanate (PZT) displays a significantly high piezoelectric effect and has wide commercial use. PZT is a combination of PbZrO3 (PZ) and PbTiO3 (PT). In 1971, Jaffe et al. reported the coexistence of PZ and PT phases in PZT resulting in superior piezoelectric properties at the morphotropic phase boundary (MPB).4 PZT has good thermal stability, leading to its applications in various fields like electronics, aerospace, biomedicine, energy harvesting, sensors, transducers, actuators, etc. Piezoelectric ceramics are synthesized via different routes like the sol–gel, hydrothermal and oxygen peroxide methods, but solid-state reaction is the best technique for mass production and reproducibility as the yield is 100% at a lower cost compared to other chemical routes. Hybrid microwave sintering (HMS) is a good alternative compared to conventional sintering due to its low sintering temperature and facilitating low temperature co-fired ceramics (LTCC) technology. HMS enhances the density and dielectric constant while achieving low dielectric loss and reduced lead volatilization. Hence, the piezoelectric coefficients are directly proportional to the polarization.5 HMS is perfectly suitable for avoiding the lead volatilization difficulties faced in the manufacturing processes of lead-based materials. However, most of the ceramics are brittle and are not suitable for bulk energy harvesting. Instead, piezoelectricity from a flexible ceramic material is a viable option for energy harvesting and sensing applications. A flexible piezoelectric-based energy harvesting device termed as nanogenerator has been investigated as a simple and notable power source for flexible and wearable electronic devices. Furthermore, milliwatt scale nanogenerators are vital technology for implementing wireless sensor networks in environmental and health care monitoring applications, as well as military systems that demand high output, extended lifetime, and lightweight self-powered systems compared to single crystals and polycrystalline materials. Polymer-based composite materials have dual advantages like flexibility and wearability.6 Unfortunately, rigid ceramics require extremely high pressures of the order of megapascals to function, making them not suitable for energy harvesting associated with a small force. The sensitivity of film-based piezoelectric generators and sensors to small mechanical energy can be greatly improved by making them flexible.7 Nanofiber-based flexible piezoelectric devices generate small-scale voltages because of their lesser device thickness. The output voltage depends on several factors like the purity of the material, piezoelectric coefficients, thickness and area of the device, etc.8 Nanofiber-based devices are perfectly suitable for sensing applications. Researchers select the printing technique and synthesis methods depending on the application.The 0–3 type piezoelectric composites have earned a lot of attention due to their several advantages over other types of nanocomposites like 1–3 and 2–2 connectivities. They possess superior flexibility, an accessible material pattern that can be tailored to their application field with numerous ceramic particle concentrations and simple manufacturing of shapes and sizes.9 However, 0–3 type piezoelectric composites face low piezoelectric properties compared to conventional piezoelectric ceramics because of the polymer matrix. High polarization is very difficult in a polymer matrix due to the high resistance of the polymer.10 This is due to the fact that PZT particles are randomly dispersed in the polymer matrix and are not interconnected. Nowadays, many reports are available on increasing the dielectric and piezoelectric properties of bulk and composite materials by adding conducting materials to the polymer composite materials. It was consistently discovered that adding a small quantity of a conductive phase to the polymer matrix definitely improves the electrical conductivity of the PZT composite and thus makes the PZT composite polarize more easily. PVP was chosen as the polymer matrix because of its high stability in the electronic industry and its ease of preparation.11–13 The ceramic filler (PZT) is mixed with the polymer matrix (PVP) to form the composite structure. The majority of the literature on the conducting phase in a polymer matrix has been focused on conducting materials such as carbon blocks, graphite, and other forms of carbon-based materials. Among these conductive additives, carbon nanotubes have been identified as the most promising for achieving high-performance piezoelectric composites due to their high aspect ratio. It is reported that CNTs with high conductivity can easily provide a three-dimensional conductive network within the PVP polymer matrix compared to other conductive additives.14,15 The present work reports on the 0–3 type piezoelectric composite (PZT/MWCNT/PVP) ink formulation and optimisation. The PZT (1.5 g)/MWCNT (0.06 wt%)/PVP (4 g) composite exhibits good output performance. MWCNT is utilized as a conductive bridge between the polymer and ceramic. It can reduce internal resistance and improve the piezoelectricity of the PZT composite. Further, it is expected to enhance the output voltage of the piezoelectric harvester. The present article reports the development of a flexible piezoelectric harvester and the corresponding output voltages.
2 Experimental
2.1 Synthesis of PZT
Lead zirconium titanate (PZT), Pb(Zr0.52Ti0.48)O3 has been prepared by the regular solid-state double sintering method. The compositional powder materials, Pb(NO3)2 (Aldrich 99.99%), TiO2 (Aldrich 99.99%), and ZrO2 (Aldrich 99.99%) are weighed in a suitable stoichiometric ratio and milled in a zirconium bowl using zirconium balls and acetone as grinding media for 8 h at 400 rpm in a high-energy planetary ball mill (PULUERISETTE-6). After milling, the slurry is dried at 60 °C for 2 h. The obtained powder is compacted by cold pressing and calcinated at 500 °C for 20 min in an alumina crucible using a microwave furnace (VB Ceramics Pvt. Ltd. India) consisting of two magnetrons. Magnetrons generate microwaves with a power of approximately 2.2 kW at a frequency of 2.45 GHz. An alumina container acts as a microwave susceptor. The susceptor is lined inside with silicon carbide and silicon wool on the outside to avoid heat leakage (see ESI Fig. S1(a)†). An IR sensor is used to measure the sample temperature. The microwave interaction with the sample is depicted in ESI Fig. S1(b).† After calcination, the green pellet is crushed and milled again for 8 hours using the previous milling conditions to obtain fine particles. The resultant slurry is dried as before and the green powder is sieved using a 10-micron mesh to obtain uniform particles. For the pellet preparation, 0.5 ton pressure is applied to the stainless-steel dye with the help of a hydraulic press. The set of green pellets (10 mm diameter and 1 mm thickness) are used for final sintering. PZT is perfectly sintered at 940 °C for a dwell time of 20 min using the hybrid microwave sintering (HMS) technique. The sintered pellets are milled and sieved for uniform particle size. The sintered ceramic powders are used for developing the composite.2.2 Synthesis of PZT–CNT composite ink
The synthesis of the composite ink, electrode contacts, particulate structure and layer structure of the PENG device is depicted in Fig. 1(a–f). To prepare the PZT composite inks, 4 g of PVP was added to 20 ml of DMF and stirred vigorously. Appropriate ratios of PZT and MWCNT (AdNano Technologies Pvt. Ltd. 99% purity) were loaded into the polymer matrix and stirred. The stirring was continued until a homogeneous viscous solution was obtained. It is shown in Fig. 1(c–e). Different ratios of PZT ceramic and MWCNT loaded into the polymer matrix are given in Table 1.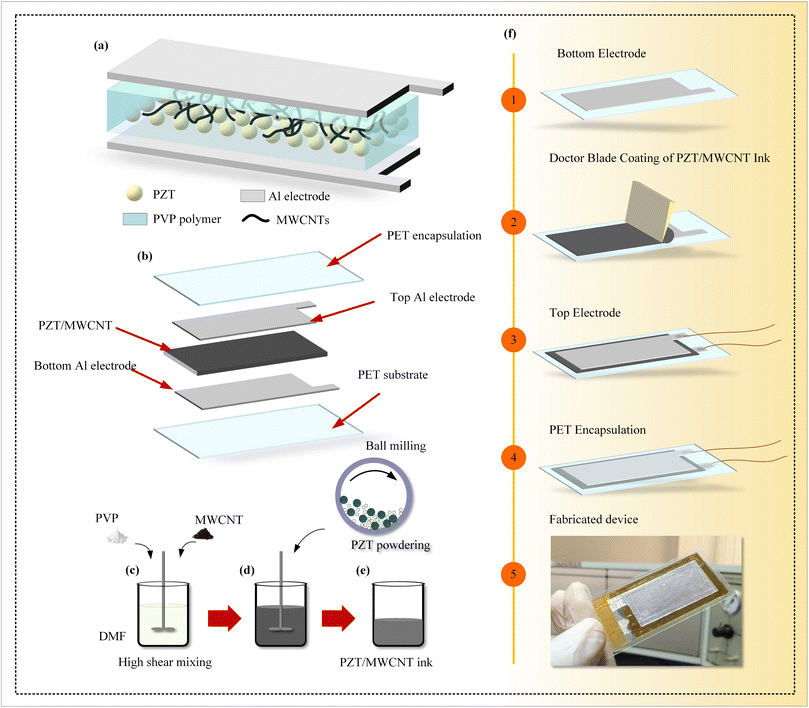 | ||
| Fig. 1 (a and b) Schematic diagrams of the device. (c–e) Ink formulation. (f(1–5)) The flowchart for device fabrication. | ||
| Polymer weight (g) (PVP) | Ceramic weight (g) (PZT) | MWCNT weight |
|---|---|---|
| 4 | 1.2 | 0.06 |
| 4 | 1.5 | 0.06 |
| 4 | 1.8 | 0.06 |
| 4 | 2.1 | 0.06 |
2.3 Device fabrication
The schematic diagram of a PENG device with a PZT/MWCNT/PVP composite film is shown in Fig. 1(a). In order to fabricate a PENG, the composite ink is coated onto the bottom electrode with the help of the doctor blade technique to a size of 2 × 4 cm2. The film is dried at 120 °C for 10 min in an IR oven. Copper wires are pasted onto the Al electrodes with the help of a conductive epoxy to measure the output performance of the device (PENG). Again, the device is kept in an oven heated at 80 °C for 5 min. The top electrode is arranged on the surface of the PZT composite film without any gap between the surface of the film and electrode. Fig. 1(f(2)) depicts images of a 170 μm thick PZT/MWCNT/PVP composite film. The total device is encapsulated with the help of PET. Finally, the device is mechanically poled for 2 h under uniform vibrations as shown in ESI Fig. S2.†2.4 Poling
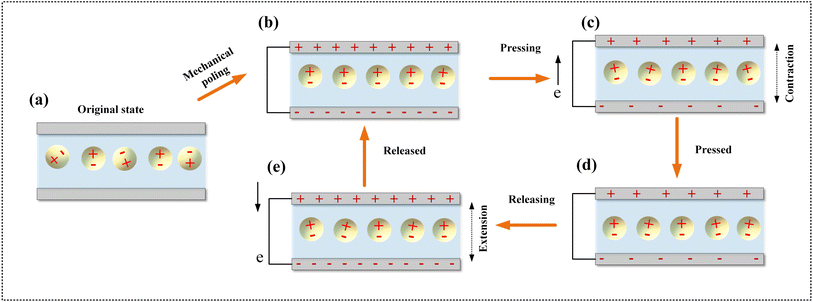
The crystalline piezoelectric material consists of several unit cells. The dipoles are found to be randomly oriented in the unit cells. When the ferroelectric material is subjected to an electric field, or vibrational or mechanical stress, all the dipoles orient along the strain direction. The alignment of dipoles in the same direction is essential for enhanced electromechanical performance of piezoelectric materials. The process of aligning dipoles in a single direction is known as poling. After poling, most of the dipoles do not revert to their original position because of the pinning effect caused by micro defects in the crystalline lattice. In the present work, mechanical poling is administrated on the devices fabricated as shown in ESI Video V1† – mechanical poling setup.Phase purity and other phases are detected using an X-ray diffractometer (XRD) (Panalytical). The surface morphology and microstructure of the sintered pellets are analysed through field emission scanning electron microscopy (FE-SEM) (Thermo Fisher Scientific FEI Quanta 250 FEG) and X-ray photoelectron spectroscopy (XPS) (make: Kratos/Shimadzu Amicus, model: ESCA 3400) is used to investigate the elemental composition and oxidation states. A typical ferroelectric PE loop tester is used to evaluate field-induced polarisation at 1 kHz (aixACCT GmbH, TF 2000). A digital phosphor oscilloscope (DSO 1002A (Agilent Technologies)) was used to measure the open-circuit voltage (Voc) of the PENG device.
3 Results and discussion
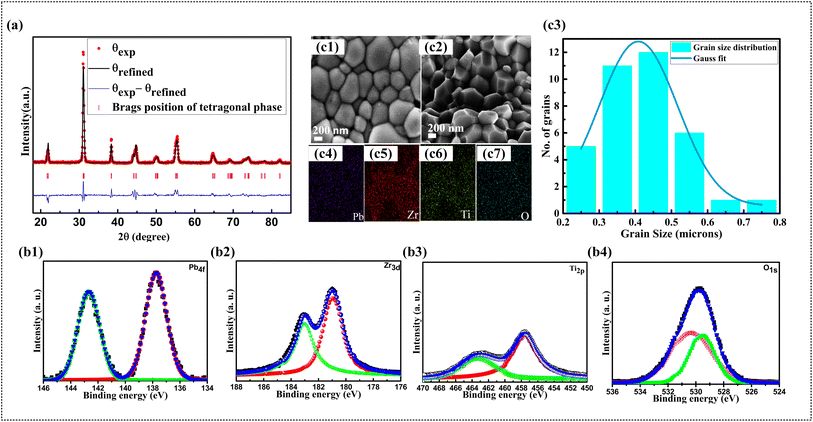
The XRD patterns of the hybrid microwave sintered PZT sample sintered at 940 °C (PZT-940) exhibited a perovskite structure. Fig. S2† shows the XRD pattern of PZT, it exhibits an MPB (tetragonal crystal structure with P4mm space group and rhombohedral R3m space group). The XRD arrangement is matched with JCPDS card #70-4060. At relatively low sintering temperatures, the formation of PZT is difficult as zirconium ions diffuse slower than titanium ions. An inhomogeneous distribution of Zr ions is observed at low sintering temperatures. At high sintering temperatures (>1000 °C), the rate of diffusion enhances the distribution of Zr ions, leading to the formation of dense homogeneous PZT. Further, Nayak et al.,16 and Ramana et al.,17 proposed 1000 °C as the perfect sintering temperature when using microwaves, while Chen et al.18 reported 900 °C as a good sintering temperature for PZT tapes. At higher sintering temperatures, the density of PZT tapes decreases and impurity phases are noticed. Gupta et al.19 prepared multi-phase PZT via spark plasma sintering (SPS) at 900 °C. The present work proposes 940 °C as the perfect sintering temperature using hybrid microwave sintering to obtain the MPB PZT. This is attributed to the high internal diffusion rate of nitrates compared to oxides, and the penetration rate of microwaves through the PZT during hybrid microwave sintering compared to others. The relatively low sintering temperatures and short dwell times of hybrid microwave sintering compared to conventional sintering preserve lead stoichiometry and avoid volatilization. Thus, the hybrid microwave sintering technique is an easy and energy efficient method for obtaining single phase ceramics at relatively low temperatures. While fitting the XRD of the PZT-940 tetragonal phase with P4mm space group and the rhombohedral phase with R3m space group using Rietveld refinement, the X2 value is found to be 2.47. Fig. 2(a) shows the refined XRD pattern. Similar refinement studies by Gupta et al.19 reported the multiphase refinement of a spark plasma sintered PZT ceramic sample (900 °C) with a goodness of fit value of 3.19. Within the MPB area, the diffraction lines that correspond to the FT phase and the FR (HT) phase partially overlap with one another. The tolerance factor (t-factor) of the composition determines whether it forms a perovskite structure or not. Goldschmidt has proposed calculating the tolerance factor as given in eqn (1).20 Eqn (2) is a modified form of eqn (1) for the present PZT composition, where RPb, RZr, RTi, and RO are the ionic radii of Pb, Zr, Ti, and O respectively. Rietveld refinement studies confirm the tetragonal phase and the radii of the Pb, Zr, Ti and O ions. The t-factor is obtained as follows:
 | (1) |
 | (2) |
| S. no. | State of the electron | Binding energy (present work) | Binding energy (literature)16 | |
|---|---|---|---|---|
| 1 | Pb4f | 4f5/2 | 142.69 | 142.52 |
| 4f7/2 | 137.35 | 137.69 | ||
| 2 | Zr3d | 3d3/2 | 183.05 | 183.44 |
| 3d5/2 | 180.98 | 181.06 | ||
| 3 | Ti2p | Ti2p1/2 | 463.46 | 463.58 |
| Ti2p3/2 | 457.59 | 457.31 | ||
| 4 | O1s | O1s | 529.4, 530.48 | 528.95, 530.56 |
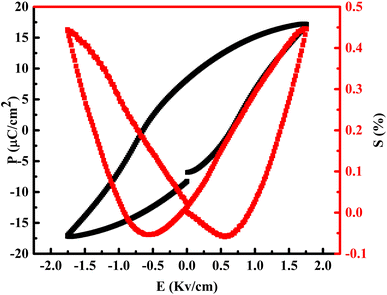
The surface morphology of PZT (pellet surface) is presented in Fig. 2(c1). It is evident that the sintered PZT has mostly spherical, uniform grain structure. A similar spherical morphology of PZT is reported by Nayak et al.16 Fig. 2(c2) presents the fractured surface morphology of the sintered PZT revealing uniform grains. The grain size distribution is studied by preparing heterojunctions with the help of ImageJ software. The histogram image of PZT is shown in Fig. 2(c3). From the histogram, it is observed that the average grain size is 0.45 microns. An Energy Dispersive X-ray Analysis (EDAX) spectrometer was used to perform quantitative elemental analysis of the PZT sample. It clearly reveals the presence of constituent lead (Pb), titanium (Ti), zirconium (Zr), and oxygen (O), as shown in ESI Fig. S4.† Furthermore, the distinct elemental mapping images of Pb, Zr, Ti, and O are shown in Fig. 2(c4–c7). Fig. 3 depicts the electric field dependent saturation polarization (P–E) and strain (S–E) curves at 1 Hz for unpoled PZT. The observed well saturated P–E loop indicates normal ferroelectric behaviour, whereas the S–E loop demonstrates systematic butterfly behaviour. The remnant polarization (Pr), coercive field Ec and maximum strain (Smax) values identified from the saturated P–E loops are ∼8.22 μC cm−2, ∼0.67 kV cm−1 and ∼0.45%. The synthesized PZT ceramics have higher ferroelectric parameters than previous findings.17
4 Device results
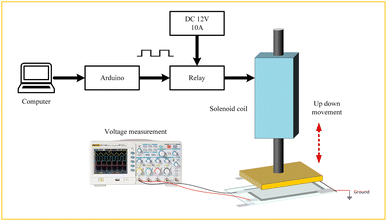
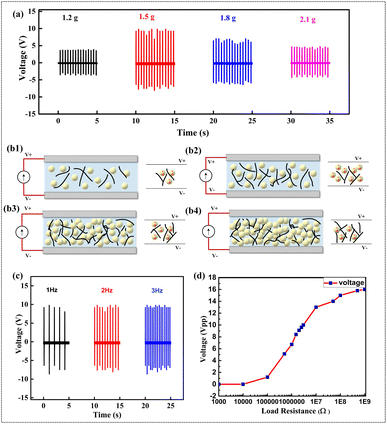
The present work is focused on 0–3 type piezoelectric nanocomposites. A PZT device is prepared to investigate the piezoelectric output of the PZT composite monolayer. Fig. 1 depicts a schematic representation of the piezoelectric device that is fabricated. The device is encapsulated with PET for mechanical strength, and to prevent the material from interacting with the ambient atmosphere. Furthermore, it avoids slipping between the material and the electrode during measurements. The PENG is prepared by sandwiching the composite film between the two Al electrodes. Necessary precautions are taken to avoid any air bubbles between the electrode and film. The PVP film does not result in any electrical voltage output as it is not piezoelectric in nature. In order to enhance the output voltage of the film, PZT is systematically loaded into the PVP matrix. A consistent mechano-electrical transducer of the PVP/PZT compositions resulted in a high output voltage when using a concentration of 1.5 g PZT in the matrix. Thus, the obtained optimal PVP/PZT composition is used in subsequent studies. In the next stage, MWCNT is used as a filler while fabricating the composite device. Evenly dispersed MWCNTs can provide a conduction path to collect and transfer charges across the surface layer of PZT to the Al electrodes. This is attributed to the high conductivity and surface area of MWCNTs.23,24The output performance of the device is systematically studied. Fig. 4 depicts the working mechanism of a PENG device. In order to perform piezoelectric characterisation, samples were mounted on a solid base on a vibration-free table to prevent the build-up of spurious voltage caused by vibrations. To avoid electromagnetic interference with the device data, the device was covered with metal aluminium tapes. The outer surface of the device is grounded and acts as a Faraday cage,25,26 as seen in Fig. 5. Fig. 6(a) illustrates the open circuit voltage of PENG devices made of the PZT/MWCNT/PVP composite at various PZT load weights (i.e.1.2, 1.5, 1.8, and 2.1 g). The MWCNT is kept at a constant weight percentage for all compositions. The external applied force and frequency are kept constant during these measurements. The piezoelectric activity of the ceramic fillers contributes significantly to the PENG's output performance. The flexibility and voltages of the composite devices with various weights of PZT ranging from 1.2 to 2.1 g (Fig. 6(a)) revealed that the output performance gradually increases up to a composition of 1.5 g PZT. On further increasing PZT concentration in the polymer matrix, the output performance gradually decreased. The device testing video is shown in ESI Video V2† (device testing facility).
These studies clearly indicate that increasing the concentration of PZT results in a high voltage of the PENG. This can improve the electrical dipole orientations or electrical polarizations in the PENG. The decrease in the output voltage observed for higher PZT loads in PVP is attributed to the formation of PZT lumps. Similar results were found by Luo et al. in BT/PDMS/C PNGs.27 As a result, the external force acting on the PENG device is not distributed uniformly across the PZT particles because of the immensely porous nature of high ceramic loads.1 Due to this reason, the electrical dipole orientations may partially cancel each other. Nonetheless, increasing the concentration of the piezoelectric fillers weakened the Voc to 9 Vpp in the device. That is, increasing the amount of piezoelectric filler after a threshold value reduces the piezoelectric composite film's output voltage, causing pores to expand, and as a result, PENG output performance suffered. Identical reports were published by Su et al. on a PDMS/BT flexible PENG.1 The above discussion is clearly depicted in Fig. 6(a). A schematic of the ceramic–polymer interaction is presented to corroborate the above discussion in Fig. 6(b). The output voltage is not affected by changing the operating PENG's frequency from 1 to 3 Hz as seen from Fig. 6(c), suggesting that the PENG device can harvest mechanical energy in a natural environment and at adaptive frequencies. ESI Fig. S5† illustrates the open-circuit voltage of PENG devices made with the PZT/MWCNT/PVP composite at numerous MWCNT weights (i.e.0, 0.02, 0.04, 0.06, 0.08, and 0.1 wt%). The PZT is kept at a constant load concentration of 1.5 g for all the compositions. As shown in ESI Fig. S5,† increasing the load concentration of MWCNT from 0 to 0.06 wt% improved the electrical output performance of the PENG device by forming a conductive bridge network between the polymer and ceramic matrix to provide a channel for current flow. Further increase in the load concentration of MWCNT consumed the electrical charge, resulting in the negative performance of the PENG. A greater percentage of CNTs, like continuous conductors, creates more conductive paths between the ceramic particles and electrodes. As a result, they are in full contact with each other in the matrix. The percolation theory which describes the insulator-to-conductor transition mechanism in composites made of conductive additives and an insulating matrix can explain this.14,28,29 However, when compared to other composite devices, the composite PENG with 0.06 wt% of MWCNT produced the highest voltage of 16 Vpp. As a result, the composite composition containing 1.5 g PZT and 0.06 wt% of MWCNT is identified as the best sample for achieving a high output voltage for the PENG. Thus, the fabricated PZT/MWCNT/PVP flexible composite device is mechanically poled for further mechano-electrical studies. The PENG device is attached to footwear for practical and real-time applications as shown in ESI Video V3† (energy harvesting from human activities), and the device harvests electrical voltage from regular human activities in daily life such as touching, walking, jogging, and running.
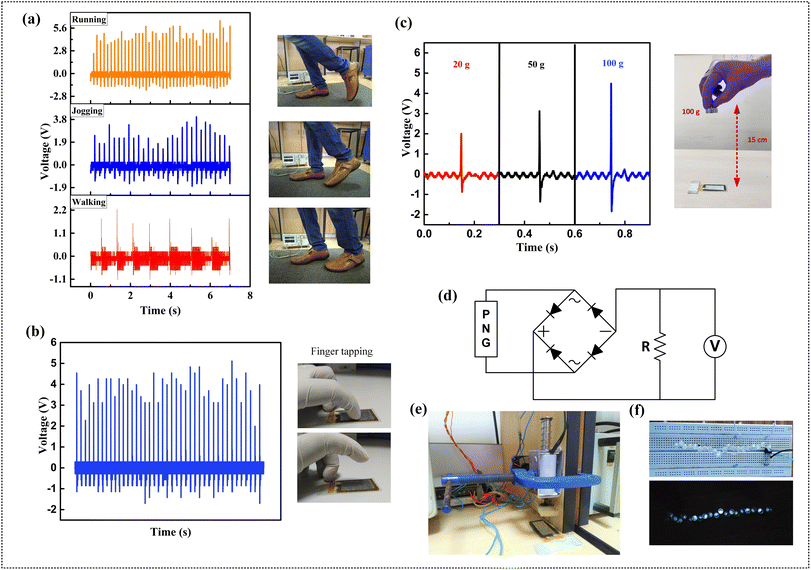
The PENG device attached to footwear has exhibited an electrical output voltage of 2, 4, 6 and 5 V from human activities like walking, jogging, running and touching respectively, as shown in Fig. 7(a and b). Similarly, the weight drop test is also performed on the PENG device. Standard weights (20 g to 100 g) are dropped onto the surface of the PENG device. The output voltages are shown in Fig. 7(c). These studies clearly indicate that the output voltage and dropping weights are related in a linear way. In addition, to investigate the effect of external load resistance on the electrical output of a PZT/MWCNT/PVP-based PENG device, its electrical output voltage values are examined at different external load resistances ranging from 1 K to 1000 MΩ. These measurements are made at a constant applied force. The Voc value of the PENG device is increased from 2 to 16 Vpp as the load resistance is increased from 100 K to 1000 MΩ, as shown in Fig. 6(d) and Fig. 7(d) shows the rectifier bridge that can generate the output voltage of 16 Vpp under a constant cyclic force. The forward and reverse connections with a vertical stress of 10 N at 3 Hz were used to verify the PENG's open-circuit voltage signal generated by the PZT/MWCNT/PVP composite, as shown in ESI Fig. S6.† It is clearly observed that the output voltage peaks of the forward connection are exactly reversed when compared with the reverse connection. This demonstrates that the piezoelectric effect is responsible for the output quality. The PENG device could sustain 500 cycles in a durability test and the results are presented in ESI Fig. S7.† Further, the PENG device output voltage is enough to drive 20 LEDs connected in series as shown in Fig. 7(f) and ESI Video V4.† Table 3 compares the electrical output and the efficiency of the present PENG with earlier reports. Based on the comparison, it is concluded that the fabrication of PZT and PENG devices using the doctor blade technique is relatively simple and cheaper compared to other methods like freeze casting,6 3D-printing,30 interdigital electrodes,31 screen printing,32 sputtering,33 chemical vapour deposition (CVD), PLD,34 spin coating,35 solution casting36 and electrospinning.37 As a result of the above findings, the proposed PENG with a PZT/MWCNT/PVP composite can be used as a wearable device in self-driven physical activity applications like sensors and energy harvesters for detecting human body movements.
| Material | Method and synthesis technique | Output voltage | Area | Thickness | Poling voltage and time | Ref. |
|---|---|---|---|---|---|---|
| PZT–PZN–MWCNT–PDMS | Freeze cast | 1.6 V | 1.5 × 1.5 × 0.1 cm3 | — | 30 kV cm−1 (2 h) | 6 |
| PZT–MWCNT–epoxy | Doctor blade technique | 575.42 mV | 25 × 25 mm2 | 45 μm | 1.5 to 4 kV mm−1 (30 min) | 14 |
| PZT–PDMS–CNT | Spin casting | 10 V | 3 × 3 cm2 | — | 2 kV (10 h) | 23 |
| BT/PVDF-TrFE | Electrospinning | 12.6 V | 2.5 × 2.5 cm2 | 20 μm | — | 25 |
| PMN–PZT–CNT–PDMS | 3d printing | 14 Vpp | — | — | 10 kV mm−1 | 30 |
| PZT nanowires/PDMS | Spin coating | 6 V | 1.5 × 0.8 mm2 | 5 μm | — | 35 |
| PZT/PVDF-TrFE | Solution casting | 3.42 V | 10 × 10 mm2 | 80 μm | — | 36 |
| BZT–BCT/PDMS | Electrospinning | 3.25 V | 1.5 × 0.8 mm2 | 5 μm | 1.5 kV mm−1 | 37 |
| Zno/PDMS | Spin coating | 1.6 V | 15 × 15 mm2 | 50 μm | — | 38 |
| BT/CNT/PDMS | Tape casting | 4.6 V | — | 0.25 cm | 25 kV (2 h) | 39 |
| PZT–PVP–MWCNT | Doctor blade technique | 16 Vpp | 2 × 4 cm2 | 170 μm | Mechanical poling (2 h) | Present work |
5 Conclusion
In summary, hybrid microwave sintered PZT powders are utilized to fabricate high performance 0–3 type PENGs consisting of a PZT/MWCNT/PVP composite. The PENG is developed using the doctor blade technique. A systematic variation of PZT in the composite has resulted in a gradual increase of the output voltage up to a threshold value of 1.5 g. At a frequency of 3 Hz, the PENG device with 1.5 g PZT, 0.06 wt% MWCNT, and 4 g PVP exhibited the highest voltage with a Voc of 16 Vpp. The PENG device’s output voltage was enough to light 20 commercial blue LEDs connected in series. The real-time applications of the PENG are demonstrated by attaching it to footwear. Further, the electrical output performance of the PENG at various physical loads is also systematically reported. The prepared device is a potential candidate for energy harvesting.Author contributions
T. Avanish Babu: synthesis, experiments, data collection, ξ analysis and rough draft preparation. W. Madhuri: final drafting and supervised overall project.Conflicts of interest
No conflicts of interest.Acknowledgements
The authors would like to thank SAS, VIT University for XRD facilities. Special thanks to Dr Adiraj Srinivas Advanced Magnetic Group, Defence Metallurgical Research Laboratory Kanchanbagh, Hyderabad, India and the FESEM facility provided by the School of Physics, University of Hyderabad.Notes and references
- H. Su, X. Wang, C. Li, Z. Wang, Y. Wu, J. Zhang, Y. Zhang, C. Zhao, J. Wu and H. Zheng, Nano Energy, 2021, 83, 105809 CrossRef CAS.
- C. Covaci and A. Gontean, Sensors, 2020, 20, 3512 CrossRef CAS PubMed.
- R. E. Cohen, Nature, 1992, 358, 136–138 CrossRef CAS.
- B. Jaffe, W. R. Cook and H. Jafe, Piezoelectric Ceramics, 1971, vol. 3 Search PubMed.
- R. Pandey, G. Sb, S. Grover, S. K. Singh, A. Kadam, S. Ogale, U. V. Waghmare, V. R. Rao and D. Kabra, ACS Energy Lett., 2019, 4, 1004–1011 CrossRef CAS.
- Y. Hao, Y. Hou, H. Xu, X. Gao, M. Zheng and M. Zhu, J. Mater. Chem. C, 2021, 9, 14303–14308 RSC.
- J. Chen, S. K. Oh, H. Zou, S. Shervin, W. Wang, S. Pouladi, Y. Zi, Z. L. Wang and J. H. Ryou, ACS Appl. Mater. Interfaces, 2018, 10, 12839–12846 CrossRef CAS PubMed.
- Y. Zhang, C. Liu, J. Liu, J. Xiong, J. Liu, K. Zhang, Y. Liu, M. Peng, A. Yu, A. Zhang, Y. Zhang, Z. Wang, J. Zhai and Z. L. Wang, ACS Appl. Mater. Interfaces, 2016, 8, 1381–1387 CrossRef CAS.
- H. J. Lee, S. Zhang, Y. Bar-Cohen and S. Sherrit, Sensors, 2014, 14, 14526–14552 CrossRef PubMed.
- S. K. Sharma, H. Gaur, M. Kulkarni, G. Patil, B. Bhattacharya and A. Sharma, Compos. Sci. Technol., 2013, 77, 42–51 CrossRef CAS.
- S. Fakher, M. Alias, P. Sayers and M. Mabrook, J. Mater. Sci.: Mater. Electron., 2018, 29, 17644–17650 CrossRef CAS.
- C. J. Lee, K. H. Jung, B. G. Park, Y. Kim and S. B. Jung, J. Mater. Sci.: Mater. Electron., 2019, 30, 4079–4084 CrossRef CAS.
- S. Ding, Q. Cai, J. Mao, F. Chen, L. Fu, Y. Lv and S. Zhao, RSC Adv., 2020, 10, 33112–33118 RSC.
- H. J. Kim and Y. J. Kim, Mater. Des., 2018, 151, 133–140 CrossRef CAS.
- Z. Wang, J. Keith Nelson, H. Hillborg, S. Zhao and L. S. Schadler, Compos. Sci. Technol., 2013, 76, 29–36 CrossRef CAS.
- S. Nayak, T. K. Chaki and D. Khastgir, Ceram. Int., 2016, 42, 14490–14498 CrossRef CAS.
- M. Venkata Ramana, S. Roopas Kiran, N. Ramamanohar Reddy, K. V. Siva Kumar, V. R. K. Murthy and B. S. Murty, Mater. Chem. Phys., 2011, 126, 295–300 CrossRef CAS.
- Y. T. Chen, C. I. Sheu, S. C. Lin and S. Y. Cheng, Ceram. Int., 2008, 34, 621–624 CrossRef CAS.
- A. K. Gupta and A. Sil, Mater. Res. Express, 2020, 7, 12 Search PubMed.
- V. Wadhawan, Introduction to ferroic materials, CRC press, 2000 Search PubMed.
- P. Kour, P. Kumar, S. K. Sinha and M. Kar, Solid State Commun., 2014, 190, 33–39 CrossRef CAS.
- C. Dragoi, N. G. Gheorghe, G. A. Lungu, L. Trupina, A. G. Ibanescu and C. M. Teodorescu, Phys. Status Solidi A, 2012, 209, 1049–1052 CrossRef CAS.
- K. Il Park, C. K. Jeong, J. Ryu, G. T. Hwang and K. J. Lee, Adv. Energy Mater., 2013, 3, 1539–1544 CrossRef.
- K. Il Park, M. Lee, Y. Liu, S. Moon, G. T. Hwang, G. Zhu, J. E. Kim, S. O. Kim, D. K. Kim, Z. L. Wang and K. J. Lee, Adv. Mater., 2012, 24, 2999–3004 CrossRef.
- K. Shi, B. Chai, H. Zou, P. Shen, B. Sun, P. Jiang, Z. Shi and X. Huang, Nano Energy, 2021, 80, 105515 CrossRef CAS.
- Z. Wang, X. Yuan, J. Yang, Y. Huan, X. Gao, Z. Li, H. Wang and S. Dong, Nano Energy, 2020, 73, 104737 CrossRef CAS.
- C. Luo, S. Hu, M. Xia, P. Li, J. Hu, G. Li, H. Jiang and W. Zhang, Energy Technol., 2018, 6, 922–927 CrossRef CAS.
- W. Bauhofer and J. Z. Kovacs, Compos. Sci. Technol., 2009, 69, 1486–1498 CrossRef CAS.
- F. He, S. Lau, H. L. Chan and J. Fan, Adv. Mater., 2009, 21, 710–715 CrossRef CAS.
- Z. Wang, X. Yuan, J. Yang, Y. Huan, X. Gao, Z. Li, H. Wang and S. Dong, Nano Energy, 2020, 73, 104737 CrossRef CAS.
- K. Il Park, J. H. Son, G. T. Hwang, C. K. Jeong, J. Ryu, M. Koo, I. Choi, S. H. Lee, M. Byun, Z. L. Wang and K. J. Lee, Adv. Mater., 2014, 26, 2514–2520 CrossRef PubMed.
- S. Grall, O. Santawitee, I. Dufour, V. Aubry and H. Debéda, Sens. Actuators, A, 2020, 304, 111826 CrossRef CAS.
- R. Harada, N. Iwamoto, S. H. Kweon, T. Umegaki and I. Kanno, Sens. Actuators, A, 2021, 322, 112617 CrossRef CAS.
- S. Zhang, L. Zhang, L. Wang, F. Wang and G. Pan, J. Mater. Chem. C, 2019, 7, 4760–4769 RSC.
- W. Wu, S. Bai, M. Yuan, Y. Qin, Z. L. Wang and T. Jing, ACS Nano, 2012, 6, 6231–6235 CrossRef CAS.
- J. X. Chen, J. W. Li, C. C. Cheng and C. W. Chiu, ACS Omega, 2022, 7, 793–803 CrossRef CAS.
- W. Wu, L. Cheng, S. Bai, W. Dou, Q. Xu, Z. Wei and Y. Qin, J. Mater. Chem. A, 2013, 1, 7332–7338 RSC.
- R. Pandey, G. Khandelwal, I. A. Palani, V. Singh and S. J. Kim, Nanoscale, 2019, 11, 14032–14041 RSC.
- U. Erturun, A. A. Eisape, S. H. Kang and J. E. West, Appl. Phys. Lett., 2021, 118, 063902 CrossRef CAS.
Footnote |
| † Electronic supplementary information (ESI) available. See DOI: https://doi.org/10.1039/d2ra05570h |
| This journal is © The Royal Society of Chemistry 2022 |

