
 Open Access Article
 This Open Access Article is licensed under a Creative Commons Attribution-Non Commercial 3.0 Unported Licence
A highly active Z-scheme SnS/Zn2SnO4 photocatalyst fabricated for methylene blue degradation†
Yingjing Wang,
Fen Xu *,
Lixian Sun*,
Yaying Li,
Lumin Liao,
Yanxun Guan,
Jianhao Lao,
Yukai Yang,
Tianhao Zhou,
Yu Wang,
Bin Li,
Kexiang Zhang and
Yongjin Zou
*,
Lixian Sun*,
Yaying Li,
Lumin Liao,
Yanxun Guan,
Jianhao Lao,
Yukai Yang,
Tianhao Zhou,
Yu Wang,
Bin Li,
Kexiang Zhang and
Yongjin Zou
Guangxi Key Laboratory of Information Materials, Guangxi Collaborative Innovation Center for Structure and Properties for New Energy and Materials, School of Material Science and Engineering, Guilin University of Electronic Technology, Guilin 541004, P. R. China. E-mail: xufen@guet.edu.cn; sunlx@guet.edu.cn
First published on 8th November 2022
Abstract
Herein, a highly active Z-scheme SnS/Zn2SnO4 photocatalyst is fabricated by a one-step hydrothermal route. The structure, composition, photoelectric and photocatalytic properties of the as-prepared photocatalysts are systematically researched. The results demonstrate that SZS-6 displays a good photocatalytic performance with an efficiency of 94.5% to degrade methylene blue (MB) under visible light irradiation (λ > 420 nm). And its degradation rate constant is up to 0.0331 min−1, which is 3.9 and 4.4 times faster than SnS and Zn2SnO4, respectively. The formation of a Z-scheme heterojunction facilitates the separation and transfer of charges, which improves the degradation of MB. The Z-scheme charge transfer pathway of the SnS/Zn2SnO4 photocatalyst is verified by the shifted peaks of the X-ray photoelectron spectroscopy (XPS) spectrum, the relative position of the bandgap, work function as well as free radical trapping experiments. The photocatalytic mechanism for the degradation of MB by SnS/Zn2SnO4 is proposed.
1. Introduction
Various semiconductor materials, such as metal oxides (TiO2),1,2 bimetallic oxides (Zn2SnO4),3 sulfides (CdS),4 complex oxides (Bi2WO6)5 and non-metallic material (g-C3N4),6,7 have been studied as photocatalysts in the field of the degradation of organic pollutants,8 hydrogen production9 and nitrogen reduction.10 Organic pollutants, such as those in textile wastewater, have impacted water resources severely. It is imperative to purify the water of organic pollutants by photocatalytic degradation technology.11–13 Among them, Zn2SnO4 has high electrical conductivity, abundant active sites, and excellent optical properties, making it stand out among many semiconductor materials.Zn2SnO4 has promising applications in functional optoelectronic devices, gas-sensitive materials, photocatalytic oxidation of organic pollutants, and solar cells.14–17 However, the Zn2SnO4 needs to be excited under UV light because of its wide bandgap. And then, Yan et al. successfully prepared the p-BiOI/n-Zn2SnO4 heterojunction.18 They found that the optical absorption edges of p-BiOI/n-Zn2SnO4 shifted from 345 to 650 nm, and nearly 100% of methylene blue (MB) was degraded under visible light. Nonetheless, the complicated charge transfer pathway and high carrier recombination rate of the p–n heterojunction still limited its application in photocatalysis.
Inspired by natural photosynthesis, the construction of Z-scheme heterojunctions has attracted considerable attention in photocatalysis. Because they can efficiently transfer and separate photogenerated carriers while maintaining outstanding redox ability.19–21 The conventional Z-scheme photocatalysts are generally constructed using external carrier media.22–24 Ye et al. synthesized a Z-scheme Ag/AgBr/BiOBr photocatalyst with Ag as the electron medium. They found that the Ag/AgBr/BiOBr photocatalyst exhibited enhanced photocatalytic performance for RhB degradation.24 Nevertheless, these mediators may hinder the light absorption of the composites or lead to backward reactions.25–27 Therefore, developing a direct Z-scheme photocatalytic system is desired.
As one known, SnS shows a light absorption factor over a broad-spectrum range and has the advantages of non-toxicity and high chemical stability. However, pure SnS is easy to deactivate under visible light irradiation, with poor electron transfer ability and fast charge recombination rate. Therefore, it is commonly introduced into some photocatalyst systems (e.g., ZnO,28 Bi2WO6,29 TiO230) to expand the light absorption range and promote the separation of photogenerated carriers. Jayswal et al. inserted SnS nanoparticles on the ZnO nanorod surface to achieve the ZnO/SnS.28 It indicated that the absorption of sunlight by ZnO/SnS was enhanced, and the photocatalytic degradation efficiency increased from 0.0035 min−1 (ZnO) to 0.0212 min−1 (ZnO/SnS). Therefore, SnS could act as a photosensitizer to improve the solar absorption efficiency of semiconductors. SnS/Zn2SnO4 is currently used in sensor-related applications and has not been studied in photocatalysis.31,32
Herein, a direct Z-scheme SnS/Zn2SnO4 photocatalyst was successfully synthesized by a one-step hydrothermal route. The phase structure, photogenerated electron–hole pairs transfer and separation of SnS/Zn2SnO4 were investigated. The results demonstrated that the degradation rate constant of MB by SZS-6 reaches 0.0331 min−1 under visible light, corresponding to 94.5% degradation in 60 min. Based on the experimental results and bandgap structure analysis, the photocatalytic mechanism of SnS/Zn2SnO4 was researched.
2. Experimental
2.1. Materials
All chemicals were used in analytical grade in this experiment. The chemicals used were L-tryptophan (C11H12N2O2), SnCl4·5H2O, Zn(AC)2·2H2O, NaOH, HCl, methylene blue (MB), Rhodamine B (Rhb), Methyl Orange (MO), SnS, benzoquinone (BQ), isopropanol (IPA, 99.0%), ethylene diamine tetraacetic acid disodium (EDTA-2Na) and ethanol absolute, which were purchased commercially. Deionized (DI) water was used to prepare all solutions for the experiment.2.2. Preparation of SnS/Zn2SnO4 composite
L-Tryptophan (0.3 g) was dissolved in deionized water at 60 °C. Then SnCl4·5H2O (0.2214 g) and Zn(Ac)2·2H2O (0.263 g) were added to the above solution. A NaOH solution (0.058 g mL−1) was dropwise added to adjust the pH of the mixed solution to 10 during stirring. And the mixed solution was continued to stir for 30 min. Then, a certain amount of well-dispersed SnS was added to the solution and went on stirring for 30 minutes to obtain a precursor solution. The precursor solution was sealed in a 100 mL Teflon reactor. The hydrothermal reactor was carried out at 200 °C for 24 h. The precipitate obtained was washed three times with DI and ethanol absolute, then dried at 60 °C for 12 h. The final products were SnS/Zn2SnO4 composites, named SZS-x (x = 3, 6, 9 and 12%); in which x is the weight ratio of the SnS over Zn2SnO4. To facilitate comparison, the pure Zn2SnO4 was also prepared by the similar procedure mentioned above in the absence of SnS.2.3. Characterization
The crystalline structures of samples were performed by a powder X-ray diffraction (XRD; Bruker DAVINCI D8 ADVANCE). The surface morphology of the catalysts was revealed by a scanning electron microscope (SEM; Quanta 200, FEI, American). The microstructures of the samples were characterized by transmission electron microscope (TEM; Talos F200X, FEI Company, USA) and high-resolution TEM (HRTEM). The corresponding elemental mapping of the sample was obtained on the TEM with an energy-dispersive X-ray (EDX) analyser. The chemical state of the analysis of the elements was performed by an X-ray photoelectron spectroscopy (XPS; ESCALAB 250Xi, Thermo Fisher). The UV-vis absorption spectra were investigated by using ultraviolet-visible diffuse reflectance (DRS, Metash UV-8000). The recombination characteristics of photo-generated carriers of samples were collected by steady photoluminescence (PL) spectra on a spectrophotometer (Edinburgh FS5) under 365 nm excitation. The nitrogen adsorption–desorption isotherms of the samples were tested using a gas adsorption analyzer (Autosorb iQ2, Quantachrome sorptometer, Osaka, Japan). The specific surface areas and pore size distribution of the samples were obtained by the Brunauer–Emmett–Teller (BET) method and the Barrett–Joyner–Halenda (BJH) method, respectively.2.4. Photocatalytic activities testing
Herein, methylene blue (MB) was used as the target contaminant to evaluate the photocatalytic degradation potential of the Zn2SnO4, SnS and SZS-x. The evaluation of photocatalyst degradation performance requires a representative dye contaminant such as MB and a 300 W Xenon lamp (JP-GHX-Xe-300, Wuxi Jiuping, China, 3.82 W cm−2) fitted with a light filter (λ > 420 nm) as a visible light source. Photocatalyst degradation was performed using a sandwich beaker and recirculating water condensation system (DFY-50/30, Gongyi Yuhua, China) as a photocatalytic reactor at 25 °C and a pH of 6.8 unless otherwise specified. Photocatalyst (0.05 g) was dispersed in MB solution (50 mL, 10 mg L−1), and then this mixture solution was stirred in the dark and lasted 30 minutes to achieve adsorption–desorption equilibrium. The catalytic degradation reaction lasted for 60 minutes. Every 10 minutes 3 mL of the suspension was sucked up and centrifuged, and then the supernatant was taken for evaluating the content of MB at 664 nm by a UV-vis spectrophotometer. To explore the main active species of photocatalysis, EDTA-2Na, BQ and IPA were added into the reaction system of MB degradation to interfere with the MB degradation respectively. The procedures and analytical methods were the same for MB degradation except for sacrificial agents that were added before the photocatalytic reaction. The concentrations of EDTA-2Na, BQ and IPA were 0.5 mmol L−1, respectively.2.5. Photoelectrochemical measurement
The transient photocurrent response, electrochemical impedance spectra (EIS), Mott–Schottky study and cyclic voltammetry were carried out on a CHI660E electrochemical work-station (Chenhua, Shanghai, China), using 0.2 M Na2SO4 as the electrolyte and a standard three-electrode system, in which the catalysts were used as the working electrode, Pt slice as the counter electrode, and Ag/AgCl electrode as the reference electrode. To prepare the working electrode, 3 mg photocatalyst was dispersed in 200 μL absolute ethyl alcohol and 5 μL Nafion (5 wt%) solution under ultrasonic for 10 min. Then, the mixed solution was dropwise added to the surface of ITO and dried at 60 °C. A 300 W xenon lamp was used as a light source for the transient photocurrent response test.3. Results and discussion
3.1. Structure and morphology
 | ||
| Fig. 1 (a) XRD spectra, (b) XPS survey, (c) Zn 2p, (d) Sn 3d, (e) S2p and (f) O 1s spectra of samples. | ||
The average particle sizes of Zn2SnO4 and SZS-x are computed utilizing the Scherrer formula:33,34
D = Kλ/β![[thin space (1/6-em)]](https://www.rsc.org/images/entities/char_2009.gif) cosθ cosθ
| (1) |
The X-ray photoelectron spectroscopy (XPS) of Zn2SnO4, SnS and SZS-6 were obtained to study the chemical state of the elements (Fig. 1b–f). As shown in Fig. 1b, four elements (Zn, Sn, S and O) are detected in the XPS spectra of SZS-6. The binding energies (1044.0 and 1020.7 eV) of Zn 2p for SZS-6 are the same as that of Zn2SnO4, corresponding to Zn 2p1/2 and Zn 2p3/2, respectively. It demonstrates that the Zn in SZS-6 is Zn2+ (Fig. 1c).35 Comparing the Sn 3d and S 2p of peaks for the three samples (Fig. 1d and e), it can be found that there are Zn2SnO4 and SnS in the SZS-6.28,36 The O 1s spectra of Zn2SnO4 can be divided into three peaks. The binding energy at 530.1 eV and 531.3 eV belongs to the oxygen atom coordinated with a metal atom (Sn–O–Sn) and (Sn–O–Zn), respectively.37 The peak at 531.3 eV is attributed to oxygen in absorbed water, and the binding energy at 532.2 eV is attributed to the oxygen atoms on defect atoms.37 It is noteworthy that the peaks of Sn 3d and O 1s in SZS-6 are shifted to the higher binding energy compared to the pristine Zn2SnO4 (Fig. 1c and f), while the peaks of S 2p in SZS-6 shifted to the lower binding energy compared to pristine SnS, which illustrates the electrons flow from Zn2SnO4 to SnS.38 However, the conventional electron should flow from SnS to Zn2SnO4, the reason for this phenomenon is that SnS (−0.79 eV) has a more negative conduction band than Zn2SnO4 (−0.27 eV).35,39
According to the literature, this reverse flow of electrons from Zn2SnO4 to SnS only occurs in the presence of Z-scheme heterojunctions.38 The XPS results further support the coexistence of Zn2SnO4 and SnS, and the existence of Z-scheme heterojunctions between Zn2SnO4 and SnS can be inferred.
 | ||
| Fig. 2 (a) SEM images of Zn2SnO4, TEM images of (b) Zn2SnO4 and (c–e) SZS-6, (f–k) HRTEM image of SZS-6 and the corresponding mapping images. | ||
3.2. The optical properties
| (αhν)1/n = k(hν − Eg) | (2) |
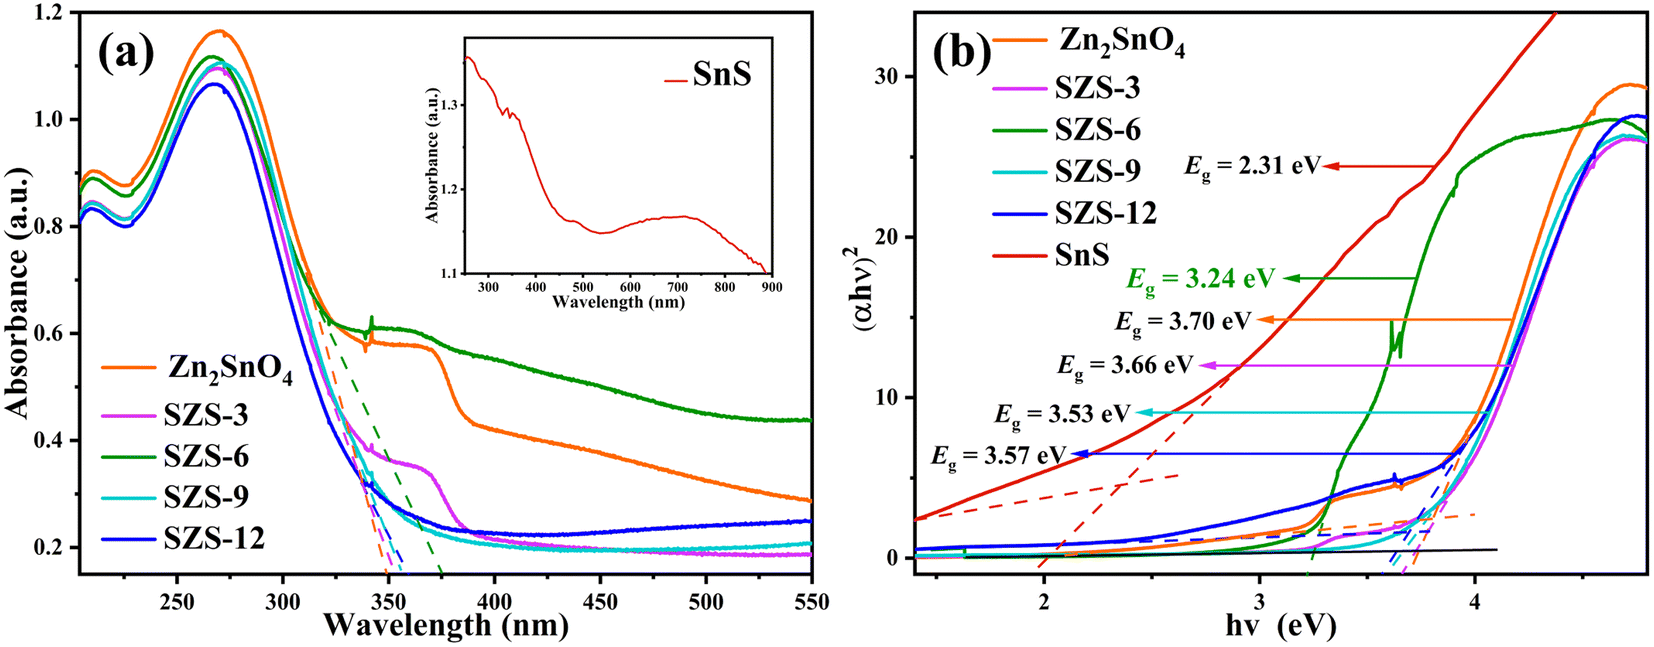 | ||
| Fig. 3 UV-vis DRS spectra of the samples (a) reflectance spectra and (b) Kubelka–Munk model. | ||
As shown in Fig. 3b, the bandgap of Zn2SnO4 and SnS are 3.70 and 2.31 eV, respectively. The bandgaps of SZS-x (x = 3, 6, 9 and 12%) are about 3.24–3.66 eV, which are narrower than that of pristine Zn2SnO4. The decrease in bandgap owes to the lattice dislocation at the interface of Zn2SnO4 and SnS, which forms a new intermediate energy level and reduces the bandgap energy.43 It also proves that the heterojunction is formed between Zn2SnO4 and SnS.
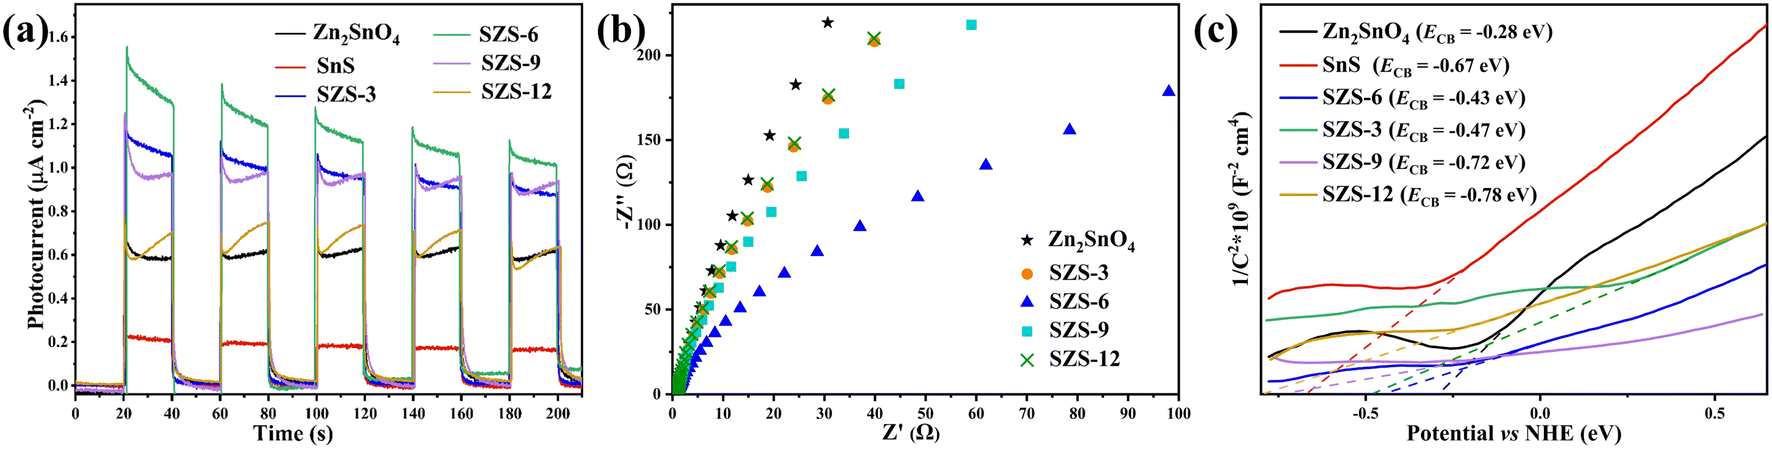 | ||
| Fig. 4 (a) Transient photocurrents, (b) EIS curves, and (c) Mott–Schottky plots of samples. | ||
 | ||
| Fig. 5 PL spectra of the Zn2SnO4, SZS-3, SZS-6, SZS-9 and SZS-12. | ||
In order to assess the energy efficiency factor in the photocatalytic process under study, the electrical energy per order (EE/O) and the average apparent quantum yield (φapp,av) have been calculated (Table S2†). Smaller values of the EE/O, less energy is required for decreasing the concentration of model pollutants in the photocatalytic system. The higher the average apparent quantum yield indicates that the more electrons are involved in the photocatalytic system, the more advantageous it is for photocatalytic reactions. The results of EE/O and φapp,av obtained also illustrates that the SZS-6 has the least energy consumption and the most electrons joining the photodegradation.
3.3. Photocatalytic activity tests
 | ||
| Fig. 6 (a) The effects of operational variables on the photocatalytic response, SZS-6 doses (for degrading 10 mg per L MB), (b) ionic strengths and (c) pH values (for degrading 10 mg L−1 of MB in the presence of 0.05 g of SZS-6). | ||
The effect of ionic strength on the catalytic activity of SZS-6 was studied using different concentrations of NaCl solutions. As shown in Fig. 6b, the increase of ionic strength is not conducive to the photodegradation of MB. This is because the MB is a negative dye, and Na+ can be adsorbed on the surface of MB by electrostatic attraction to reduce the contact MB with SZS-6. In addition, the additional ions also maybe act as charge traps, limiting the quantum yield of the photocatalyst.7,51
The effect of acidity and alkalinity on the activity of SZS-6 was also researched (Fig. 6c). The degradation rate of MB at different pH (5, 6.8, and 9) are 90.9, 94.5, and 97.3%, respectively. The result displays that the alkaline condition is favourable for MB degradation. Considering the high instrumental requirements of alkaline solutions, deionized water is used as the solvent for this experiment.52,53
Meanwhile, the result demonstrates that the temperature has little influence on the photocatalytic performance of SZS-6 under the range of 10–40 °C (Fig. S2†).
 | ||
| Fig. 7 (a) Photocatalytic degradation and (b) the kinetic curves of MB catalysed by the Zn2SnO4, SnS, SZS-x. (c) Cycling tests for the photocatalytic degradation of MB in the presence of SZS-6 and (d) XRD patterns of SZS-6 before and after photocatalysis. | ||
The photocatalytic activity of SZS-6 owes to the following reasons: (1) compounding with SnS redshifts the absorption edge of the SZS-6 bandgap, extending the absorption range for visible light; (2) the Z-scheme heterojunction formed in SZS-6 improves the separation efficiency of photogenerated carriers and photocatalytic activity.
Based on Fig. 7b and Table 2, it can be found that all degradation reactions follow the pseudo-first-order rate equation (ln(C0/Ct) = kt). In which, C0 and Ct are the concentrations of MB solution dark equilibrium absorption and after irradiation, respectively; k is the slope of the fitted line, namely as reaction rate constant.44 Table 2 shows that the rate constants of Zn2SnO4, SnS, SZS-3, SZS-6, SZS-9 and SZS-12 are 0.0076, 0.0085, 0.0189, 0.0331, 0.0167 and 0.0143 min−1, respectively. This illustrates that the degradation rate of SZS-6 is the quickest, which is 4.4 times higher than that of Zn2SnO4 and it means that the degradation rate of MB increases significantly under the act of the Z-scheme SnS/Zn2SnO4 photocatalyst.
| Sample | Bandgap (eV) | Degradation rate (%) | k (min−1) |
|---|---|---|---|
| Zn2SnO4 | 3.7 | 41.6 | 0.0076 |
| SnS | 2.31 | 41.9 | 0.0085 |
| SZS-3 | 3.66 | 77.2 | 0.0189 |
| SZS-6 | 3.24 | 94.5 | 0.0331 |
| SZS-9 | 3.53 | 70.6 | 0.0167 |
| SZS-12 | 3.57 | 65.3 | 0.0143 |
In addition, the stability and reusability of the SZS-6 were investigated (Fig. 7c). After the four-cycle tests under visible light, the result displays that the degradation efficiency of MB still holds at 85%. In addition, XRD characterization of SZS-6 was performed before and after the photocatalytic degradation (Fig. 7d). It can be observed that there is almost no significantly different in the XRD patterns of SZS-6 before and after the photocatalytic reaction. The result indicates that SZS-6 is stable during photocatalytic degradation.
The degradation performance of the SZS-6 photocatalyst is compared with other references (Table 3). The result indicates that the SZS-6 has improved photocatalytic degradation performance compared to previous studies.
| Photocatalyst | Pollutant | The initial concentration of pollutant (mg L−1) | Volume of pollutant (mL) | Photocatalyst dosage (g) | Degradation time (min) | Degradation (%) | Ref. |
|---|---|---|---|---|---|---|---|
| a TC stands for tetracyclines. | |||||||
| Co-doping Na+ CaTiO3:Eu3+ | MB | 5 | 100 | 0.2 | 300 | 92.8 | 33 |
| TiO2/Fe2O3 | Diazinon | 10 | 100 | 0.05 | 45 | 89.21 | 54 |
| ZnO/TiO2 | Diazinon | 20 | 1000 | 0.5 | 120 | 87.26 | 55 |
| Fe2O3/graphene/CuO | MB | 20 | 100 | 0.05 | 40 | 81.5 | 56 |
| SrFe12O19 | MB | 10 | 50 | 0.05 | 270 | 95 | 57 |
| Sb2O3/CBO | MB | 10 | 20 | 0.01 | 120 | 90.4 | 50 |
| Bi4O5Br2/g-C3N4 | TC | 10 | 100 | 0.1 | 60 | 94 | 51 |
| SZS-6 | MB | 10 | 50 | 0.05 | 60 | 94.5 | This work |
To further verify the degradation performance of SZS-6 to dyes, MO and RhB were used for degradation evaluation by SZS-6 (Fig. S2†). The results show that the degradation rates of RhB and MO are 64.8% and 85.5% in 60 min, respectively. The result illustrates that the SZS-6 catalytic degradation of anionic dyes (MO and MB) is stronger than cationic dye (RhB).
To further confirm that dye adsorption is not the dominant factor in promoting MB degradation, the N2 adsorption experiment has proceeded. As shown in Fig. 8, both the Zn2SnO4 and SZS-6 exhibit reversible type IV hysteresis isotherms with H3 hysteresis loops, illustrating their mesoporous structure. The calculated BET-specific surface area of SZS-6 is 4.44 m2 g−1, which is significantly lower than that of Zn2SnO4 (44.4 m2 g−1) (Table S1†). The insets in Fig. 8 present the Barrett–Joyner–Halenda (BJH) pore size distribution of the Zn2SnO4 and SZS-6. From Fig. 8a, it can be observed that the average pore diameter of Zn2SnO4 is about 7 nm, while that of SZS-6 is centered at 17 nm (Fig. 8b). Notably, the surface area of SZS-x decreased compared to Zn2SnO4, probably due to the stacking of Zn2SnO4 in SZS-x via SnS. The BET result shows that the SnS nanoparticles were successfully and uniformly compounded on Zn2SnO4.
 | ||
| Fig. 8 (a) N2 adsorption–desorption isotherms of Zn2SnO4 and (b) SZS-6, insets are the corresponding pore size distribution. | ||
To determine the effect of redox potential, cyclic voltammetry was used to test the redox potential of the samples (Fig. S4†). The result shows that the redox potential of samples gradually increases with increasing the content of SnS, indicating that SnS enhanced the redox activity of SZS-x.
 | ||
| Fig. 9 (a) Effect of different scavengers on the photocatalytic degradation of MB by SZS-6, electrostatic potentials diagrams of (b) SnS and (c) Zn2SnO4. | ||
Based on the characteristics of charge transfer from high Fermi energy to low Fermi energy during the formation of heterojunction (charges rearrangement process), the work function of SnS and Zn2SnO4 can be calculated using density functional theory (DFT) in Fig. 9b and c.21,60
The work functions of SnS and Zn2SnO4 are 3.50 eV and 6.34 eV, respectively. Based on Fig. 4 and 9, it is clear that SnS possesses higher CB and VB positions and a smaller work function than Zn2SnO4. After SnS and Zn2SnO4 are intimately contacted, the photogenerated e− in SnS migrate to Zn2SnO4. Therefore, the interfaces on SnS and Zn2SnO4 are positively and negatively charged, respectively, which leads to the formation of built-in electric fields.20 This built-in electric field can accelerate the transfer of the photogenerated e− and h+ and promotes the charge transfer from SnS to Zn2SnO4. In the meantime, the built-in electric field and extra potential barrier can significantly restrain other charge migration routes.56 Therefore, it can be determined that a Z-scheme pathway is formed in this system.
Based on the above analysis, a direct Z-scheme charge transfer mechanism is put forward (Fig. 10). Under visible light, Zn2SnO4 and SnS are excited synchronously and generate electron–hole pairs. Electrons (e−) at VB rapidly migrate to CB in the same semiconductor, while a corresponding number of holes (h+) appear in VB. The e− in the CB of Zn2SnO4 directly transfers to the VB of SnS and recombines with h+ of SnS.61 This induces that the VB of Zn2SnO4 has free h+ and the CB of SnS has free e−, thus making more active carriers participate in the photocatalytic process (eqn (3)). The h+ on the surface of Zn2SnO4 in SZS-6 oxidates organic dye into colourless intermediates (like aldehyde and acid), and then it is degraded by further oxidation (eqn (5)).62,63 In addition, the thermodynamic driving force of e− in the CB of SnS converts the adsorbed O2 into ˙O2− (Eθ(O2/˙O2−) = −0.33 eV vs. NHE) (eqn (4)), and the MB dye reacts with ˙O2−, and is degraded (eqn (6)). The reaction mechanism of the photocatalytic degradation for MB dye is as follows.64
| SZS-6 + hν → e− + h+ | (3) |
| e−(SnS) + O2 → ˙O2− | (4) |
| MB + h+ → degradation production | (5) |
| MB + ˙O2− → degradation production | (6) |
 | ||
| Fig. 10 The degradation mechanism of MB by SZS-x under visible-light irradiation. | ||
In a word, the Z-scheme heterojunction formed between Zn2SnO4 and SnS effectively promotes the separation efficiency of the photogenerated carriers to enhance the photocatalytic activity. For MB dye degradation, h+ is the main active site, while the ˙O2− group plays a supporting role.
4. Conclusion
In summary, a highly active Z-scheme SnS/Zn2SnO4 photocatalyst had been synthesized successfully. TEM analysis indicated that SnS nanoparticles were well dispersed on the surface of Zn2SnO4 polyhedra. HRTEM, XPS and UV-vis DRS proved that a Z-scheme heterojunction was successfully constructed between Zn2SnO4 and SnS. As expected, the SnS/Zn2SnO4 showed a much higher photocatalytic activity towards the degradation of MB under visible light. The best photodegradation rate constant of MB degradation for SZS-6 was as high as 0.0331 min−1, 3.9 and 4.4 times higher than that of SnS and Zn2SnO4, respectively. This enhancement mainly contributed to the formulation of Z-scheme heterojunction between Zn2SnO4 and SnS. The Z-scheme heterojunction was helpful for rapid transfer and separation of charge, enhancing its photocatalytic activity. In addition, h+ is the main active site of MB photo-degradation on SnS/Zn2SnO4 photocatalyst, and the O2− group plays a synergistic role. This work provides a novel insight into the sensible design and fabrication of effective Zn2SnO4-based Z-scheme heterojunction photocatalysts for applications in the remediation of the environment and energy conversion.Author contributions
Yingjing Wang: investigation, writing – original draft, data collecting, experiment design. Fen Xu: writing – review & editing, resources. Lixian Sun: group leader and funding acquisition. Yaying Li: supervision, methodology. Lumin Liao: figure analysis. Yanxun Guan: data collecting. Jianhao Lao: investigation. Yukai Yang: writing review. Tianhao Zhou: data collecting. Yu Wang: formal analysis. Bin Li: data collecting, Kexiang Zhang: TEM image collecting, Yongjin Zou: supervision.Conflicts of interest
There are no conflicts to declare.Acknowledgements
This work was supported by the National Natural Science Foundation of China (51971068, U20A20237, 51871065 and 52271205), the Scientific Research and Technology Development Program of Guangxi (AA19182014, AD17195073, AA17202030-1, AB21220027, 2021AB17045), Science Research and Technology Development Project of Guilin (20210216-1, 20210102-4), Guangxi Bagui Scholar Foundation, Lijiang River Scholar Foundation, Guangxi Collaborative Innovation Centre of Structure and Property for New Energy and Materials, Chinesisch-Deutsche Kooperationsgruppe (GZ1528), Guangxi key research and development program (2021AB17045), Science Research and Technology Development Project of Guilin (20210216-1) and Innovation Project of GUET Graduate Education (2022YCXS201).References
- A. Fujishima, X. Zhang and D. Tryk, Surf. Sci. Rep., 2008, 63, 515–582 CrossRef CAS.
- G. F. Liao, X. Y. Tao and B. Z. Fang, Matter, 2022, 5, 377–379 CrossRef CAS.
- L. Sun, S. Li, Y. Su, D. He and Z. Zhang, Appl. Surf. Sci., 2019, 463, 474–480 CrossRef CAS.
- N. Z. Bao, L. M. Shen, T. Takata and K. Domen, Chem. Mater., 2008, 20, 110–117 CrossRef CAS.
- L. S. Zhang, W. Z. Wang, Z. G. Chen, L. Zhou, H. L. Xu and W. Zhu, J. Mater. Chem., 2007, 17, 2526–2532 RSC.
- Y. Y. Li, F. Xu, L. X. Sun, X. G. Xue, Y. J. Wang, L. M. Liao, Y. X. Guan, B. Li, K. X. Zhang, Y. J. Zou and H. Z. Zhang, New J. Chem., 2022, 46, 8794–8804 RSC.
- F. T. Yi, J. Liu, G. P. Liang, X. Xiao and H. F. Wang, J. Alloys Compd., 2022, 905, 164064 CrossRef CAS.
- H. Sun and S. J. Park, J. Environ. Sci., 2022, 118, 57–66 CrossRef PubMed.
- G. F. Liao, C. X. Li and B. Z. Fang, Matter, 2022, 5, 1635–1637 CrossRef CAS.
- M. Q. Li, H. Huang, J. X. Low, C. Gao, R. Long and Y. J. Xiong, Small Methods, 2018, 3, 1800388 CrossRef.
- C. K. Govindappa, V. T. Venkatarangaiah and S. B. A. Hamid, Nano-Micro Lett., 2013, 5, 101–110 CrossRef CAS.
- S. Y. Lee and S. J. Park, J. Ind. Eng. Chem., 2013, 19, 1761–1769 CrossRef CAS.
- F. T. Yi, J. Q. Ma, C. W. Lin, H. N. Zhang, Y. X. Qian, H. X. Jin and K. F. Zhang, Chem. Eng. J., 2022, 427, 132028 CrossRef CAS.
- L. Du, H. P. Zhang, M. M. Zhu and M. Z. Zhang, Inorg. Chem. Front., 2019, 6, 2311–2317 RSC.
- L. Q. Sun, X. Han, Z. Jiang, T. T. Ye, R. Li, X. S. Zhao and X. G. Han, Nanoscale, 2016, 8, 12858–12862 RSC.
- X. L. Bai, N. Pan, X. P. Wang and H. Q. Wang, Chin. J. Chem. Phys., 2008, 21, 81–86 CrossRef CAS.
- Q. Q. Zhao, D. X. Ju, X. F. Song, X. L. Deng, M. Ding, X. J. Xu and H. B. Zeng, Sens. Actuators, B, 2016, 229, 627–634 CrossRef CAS.
- T. Yan, H. Y. Liu, M. Sun, X. D. Wang, M. M. Li, Q. Yan, W. G. Xu and B. Du, RSC Adv., 2015, 5, 10688–10696 RSC.
- G. F. Liao, C. X. Li, X. Z. Li and B. Z. Fang, Cell Rep. Phys. Sci., 2021, 2, 100355 CrossRef CAS.
- G. F. Liao, C. X. Li, S. Y. Liu, B. Z. Fang and H. M. Yang, Phys. Rep., 2022, 983, 1–41 CrossRef CAS.
- S. Xia, G. Zhang, Z. Gao, Y. Meng, B. Xie, H. Lu and Z. Ni, J. Colloid Interface Sci., 2021, 604, 798–809 CrossRef CAS PubMed.
- P. Zhou, J. Yu and M. Jaroniec, Adv. Mater., 2014, 26, 4920–4935 CrossRef CAS PubMed.
- C. Kim, K. M. Cho, A. Al-Saggaf, I. Gereige and H.-T. Jung, ACS Catal., 2018, 8, 4170–4177 CrossRef CAS.
- L. Q. Ye, J. Y. Liu, C. Q. Gong, L. H. Tian, T. Y. Peng and L. Zan, ACS Catal., 2012, 2, 1677–1683 CrossRef CAS.
- K. Maeda, ACS Catal., 2013, 3, 1486–1503 CrossRef CAS.
- H. W. Guo, S. P. Wan, Y. N. Wang, W. H. Ma, Q. Zhong and J. Ding, Chem. Eng. J., 2021, 412, 128646 CrossRef CAS.
- D. L. Huang, S. Chen, G. M. Zeng, X. M. Gong, C. Y. Zhou, M. Cheng, W. J. Xue, X. L. Yan and J. Li, Coord. Chem. Rev., 2019, 385, 44–80 CrossRef CAS.
- S. Jayswal and R. S. Moirangthem, New J. Chem., 2018, 42, 13689–13701 RSC.
- Z. Li, X. Meng and Z. Zhang, J. Colloid Interface Sci., 2019, 537, 345–357 CrossRef CAS PubMed.
- Y. Jiang, Z. Yang, P. Zhang, H. Jin and Y. Ding, RSC Adv., 2018, 8, 13408–13416 RSC.
- L. Li, L. Zheng and G. Shen, Adv. Funct. Mater., 2018, 28, 1705389 CrossRef.
- D. Zhang, X. Zong, Z. Wu and Y. Zhang, ACS Appl. Mater. Interfaces, 2018, 10, 32631–32639 CrossRef CAS PubMed.
- M. Chen, Q. Xiong, Z. Liu, K. H. Qiu and X. Xiao, Ceram. Int., 2020, 46, 12111–12119 CrossRef CAS.
- S. M. Peymani-Motlagh, A. Sobhani-Nasab, M. Rostami, H. Sobati, M. Eghbali-Arani, M. Fasihi-Ramandi, M. R. Ganjali and M. Rahimi-Nasrabadi, J. Mater. Sci.: Mater. Electron., 2019, 30, 6902–6909 CrossRef CAS.
- L. Wang, H. Zhai, G. Jin, X. Li, C. Dong, H. Zhang, B. Yang, H. Xie and H. Sun, Phys. Chem. Chem. Phys., 2017, 19, 16576–16585 RSC.
- M. L. Gu, Y. H. Li, M. Zhang, X. M. Zhang, Y. Shen, Y. Q. Liu and F. Dong, Nano Energy, 2021, 80, 105415 CrossRef CAS.
- K. Wang, D. Liu, P. Deng, L. Liu, S. Lu, Z. Sun, Y. Ma, Y. Wang, M. Li and B. Y. Xia, Nano Energy, 2019, 64, 103954 CrossRef CAS.
- T. Ling, D. Y. Yan, Y. Jiao, H. Wang, Y. Zheng, X. Zheng, J. Mao, X. W. Du, Z. Hu, M. Jaroniec and S. Z. Qiao, Nat. Commun., 2016, 7, 12876 CrossRef CAS PubMed.
- C. Y. Wu, C. J. Lee, Y. H. Yu, H. W. Tsao, Y. H. Su, C. C. Kaun, J. S. Chen and J. J. Wu, ACS Appl. Mater. Interfaces, 2021, 13, 4984–4992 CrossRef CAS PubMed.
- M. Fakhrzad, A. H. Navidpour, M. Tahari and S. Abbasi, Mater. Res. Express, 2019, 6, 095037 CrossRef CAS.
- E. Keles, M. Yildirim, T. Öztürk and O. A. Yildirim, Mater. Sci. Semicond. Process., 2020, 110, 104959 CrossRef CAS.
- Y. X. Wang, Y. Q. Yang, L. M. Xi, X. D. Zhang, M. H. Jia, H. M. Xu and H. G. Wu, Mater. Lett., 2016, 180, 55–58 CrossRef CAS.
- Y. M. Liu, Y. F. Cao, H. Lv, S. Li and H. Zhang, Mater. Lett., 2017, 188, 99–102 CrossRef CAS.
- J. Liu, J. Ke, Y. Li, B. J. Liu, L. D. Wang, H. N. Xiao and S. B. Wang, Appl. Catal., B, 2018, 236, 396–403 CrossRef CAS.
- R. Tang, S. Zhou, L. Zhang and L. Yin, Adv. Funct. Mater., 2018, 28, 1706154 CrossRef.
- B. Chen, W. Fan, B. Mao, H. Shen and W. Shi, Dalton Trans., 2017, 46, 16050–16057 RSC.
- Z. Sun, W. Fang, L. Zhao and H. Wang, Appl. Surf. Sci., 2020, 504, 144347 CrossRef CAS.
- X. J. Zou, Y. Y. Dong, C. Y. Yuan, H. Ge, J. Ke and Y. B. Cui, J. Taiwan Inst. Chem. Eng., 2019, 96, 390–399 CrossRef CAS.
- R. Wu, H. Song, N. Luo and G. Ji, J. Colloid Interface Sci., 2018, 524, 350–359 CrossRef CAS PubMed.
- M. Azimifar, M. Ghorbani and M. Peyravi, J. Mol. Struct., 2022, 1270, 133957 CrossRef CAS.
- F. T. Yi, J. Q. Ma, C. W. Lin, L. Y. Wang, H. N. Zhang, Y. X. Qian and K. F. Zhang, J. Alloys Compd., 2020, 821, 153557 CrossRef CAS.
- M. Moztahida and D. S. Lee, J. Hazard. Mater., 2020, 400, 123314 CrossRef CAS PubMed.
- P. A. Ajibade, T. B. Mbuyazi and A. E. Oluwalana, J. Inorg. Organomet. Polym. Mater., 2021, 31, 2197–2208 CrossRef CAS.
- S. R. Mirmasoomi, M. Mehdipour Ghazi and M. Galedari, Sep. Purif. Technol., 2017, 175, 418–427 CrossRef CAS.
- A. Jonidi-Jafari, M. Shirzad-Siboni, J.-K. Yang, M. Naimi-Joubani and M. Farrokhi, J. Taiwan Inst. Chem. Eng., 2015, 50, 100–107 CrossRef CAS.
- P. Nuengmatcha, P. Porrawatkul, S. Chanthai, P. Sricharoen and N. Limchoowong, J. Environ. Chem. Eng., 2019, 7, 103438 CrossRef CAS.
- D. D. Mishra and G. Tan, J. Phys. Chem. Solids, 2018, 123, 157–161 CrossRef CAS.
- K. B. Bhojanaa, A. Soundarya Mary, K. S. Shalini Devi, N. Pavithra and A. Pandikumar, Sol. RRL, 2021, 6, 2100792 CrossRef.
- D. Ursu, R. Banică, M. Vajda, C. B. Baneasa and M. Miclau, J. Alloys Compd., 2022, 902, 163890 CrossRef CAS.
- G. H. Zhang, Y. Meng, B. Xie, Z. M. Ni, H. F. Lu and S. J. Xia, Appl. Catal., B, 2021, 296, 120379 CrossRef CAS.
- K. Gelderman, L. Lee and S. Donne, J. Chem. Educ., 2007, 84, 685–688 CrossRef CAS.
- A. Takai and P. V. Kamat, ACS Nano, 2011, 5, 7369–7376 CrossRef CAS PubMed.
- T. K. Jia, F. Fu, J. Li, Z. Deng, F. Long, D. S. Yu, Q. Cui and W. M. Wang, Appl. Surf. Sci., 2020, 499, 143941 CrossRef CAS.
- A. Zhu, Q. Zhao, X. Li and Y. Shi, ACS Appl. Mater. Interfaces, 2014, 6, 671–679 CrossRef CAS PubMed.
Footnote |
| † Electronic supplementary information (ESI) available. See DOI: https://doi.org/10.1039/d2ra05519h |
| This journal is © The Royal Society of Chemistry 2022 |