DOI:
10.1039/D2RA05220B
(Paper)
RSC Adv., 2022,
12, 28441-28450
Factors affecting sericin hydrolysis and application of sericin hydrolysate in sericin films
Received
20th August 2022
, Accepted 30th September 2022
First published on 5th October 2022
Abstract
Sericin is a natural protein and a by-product obtained from silk processing. To enhance the antioxidant properties of sericin, sericin hydrolysis was studied. The solvent effects (distilled water, citric acid and hydrochloric acid) and hydrolysis methods (heat treatment (water bath) and mild ultrasonic treatment at 20%, 40% or 60% amplitude) were investigated on the properties of sericin hydrolysate (SH). Furthermore, solvent effects (distilled water and 15% ethanol) were examined for the properties of the sericin films incorporated with selected SH. The SH samples from acid hydrolysis and the ultrasonic method had a darkened visual appearance. However, the degree of hydrolysis and antioxidant activity of SH increased with ultrasonic-assisted acid hydrolysis. The molecular weight (MW) of sericin was notably reduced. As expected, hydrochloric acid hydrolysis resulted in a lower MW for the SH than from citric acid. Thus, SH from hydrochloric acid and 20% amplitude in the ultrasonic method were selected to produce a sericin film. As revealed, using distilled water as a general solvent provided films with lower solubility and water vapor permeability but higher tensile strength. Furthermore, the addition of SH enhanced the antioxidant properties of its hydrolysate as a novel protein packaging film material for various applications.
1. Introduction
Sericin is a natural protein derived from the silkworm (Bombyx mori) and contributes about 25–30% of the cocoon weight. In the textile industry, about 50![[thin space (1/6-em)]](https://www.rsc.org/images/entities/char_2009.gif) 000 t of sericin is removed during silk processing and discharged with industrial wastewater.1 The recovery and reuse of sericin not only reduces environmental problems but also provides a high commercial value return. Nowadays, sericin is used in food and medical materials due to its various bioactivities, such as antioxidant activity,2 tyrosinase inhibition activity3 and anti-inflammatory activity.4 Sericin hydrolysate (SH) presents higher antioxidant activity than sericin and acts as an alternative additive for the cosmetic and food industries.5,6 Thus, it is interesting to apply SH in the food industry and packaging.
000 t of sericin is removed during silk processing and discharged with industrial wastewater.1 The recovery and reuse of sericin not only reduces environmental problems but also provides a high commercial value return. Nowadays, sericin is used in food and medical materials due to its various bioactivities, such as antioxidant activity,2 tyrosinase inhibition activity3 and anti-inflammatory activity.4 Sericin hydrolysate (SH) presents higher antioxidant activity than sericin and acts as an alternative additive for the cosmetic and food industries.5,6 Thus, it is interesting to apply SH in the food industry and packaging.
Generally, sericin is hydrolyzed using enzymatic hydrolysis. For example, trypsin was used to hydrolyze sericin.5 However, enzymes are very expensive as well as being difficult to control and predict the reaction product due to the structural complexity of protein resulting in limited enzyme–protein interaction.7,8 Ovissipour et al.9 reported that the limitation of the enzyme activity by formation of reaction products affected a reduction of the hydrolysis rate. Thus, various methods have been studied to improve protein hydrolysis, such as chemical (acid and alkaline) hydrolysis, microwave-assisted acid hydrolysis, ultrasonic-assisted hydrolysis and ultrasonic-assisted acid hydrolysis.10–13 Acid hydrolysis of protein is widely used to cleave peptide bonds to produce peptides and free amino acids, as it is a simple and less expensive method.14 Furthermore, ultrasonication is a mild and novel technology widely used to hydrolyze proteins. Therefore, their combination in ultrasonic-assisted acid hydrolysis should increase the efficiency of hydrolyzing proteins and improve the functional properties of the proteins. As reported, the ultrasonication improved the foaming, emulsifying and antioxidant properties of whey protein isolate.15 Furthermore, ultrasonic-assisted acid hydrolysis enhanced effective unfolding and dissociation of soybean protein isolate (SPI).12 Nonetheless, this technique increased water and oil absorption capacity of elephant foot yam starch.16 However, currently, little is known about the ultrasonic-assisted acid hydrolysis of SH. Therefore, this work focused on the comparison of SH using a mild treatment of ultrasonication and heat treatment using a water bath and selected the SH with desirable properties to enhance the properties of sericin film.
Sericin has been widely used in film applications. However, the properties of sericin film depend on the sample preparation. For example, sericin film prepared from water decreased the water content but increased the crystallinity index. However, sericin film prepared from formic acid and ethanol solution did not affect the water content and crystallinity index.17 It is known that ethanol induces β-sheet formation and increases the crystallinity index of sericin.17,18 In addition, 15% ethanol was optimal to create the gelation of sericin because it produced a higher crystallinity index and gel strength with a lower gelation time.19 Thus, it is of interest to study the effects of solvents (distilled water and 15% ethanol) on the properties of sericin film. Furthermore, the protein hydrolysate might enhance the antioxidant activity of the film as an active food packaging material. The addition of shrimp and crab protein hydrolysates into chitosan/fish gelatin composite films increased surface wettability and antioxidant and antibacterial activities.20 To the best of our knowledge, there has been no report on the sericin film incorporated with SH. Therefore, the aim of this work was to study the factors (3 solvent types and 4 different hydrolysis methods) affecting SH. Moreover, the effect of film forming solvents (distilled water and 15% ethanol) and the addition of SH on the properties of sericin film was evaluated. The outcomes from this study would be beneficial to the utilization of sericin as an active film for food or other applications.
2. Experimental section
2.1 Sample and chemicals
The sericin powders were provided by Ruenmai-Baimon Part Ltd (Surin, Thailand). Glycerol was purchased from Ajax Finechem Pty Ltd (Sydney, NSW, Australia). Gallic acid (≥98%), (±)-6-hydroxy-2,5,7,8-tetramethyl-chromane-2-carboxylic acid (Trolox, 97%) and 2,2′-diphenyl-1-picrylhydrazyl radical (DPPH˙) were purchased from Sigma-Aldrich (St. Louis, MO, USA). Folin–Ciocalteu reagent was procured from Merck KGaA (Darmstadt, Germany). All chemical reagents in this study were analytical grade.
2.2 Preparation of sericin hydrolysates
The sericin powders were hydrolyzed using distilled water (SH-DW), citric acid (SH-CA) (1 M) or hydrochloric acid (SH-HA) (1 M) at a solid-to-liquid ratio of 1:20 (w/v) using a water bath at 70 °C for 40 min with a modified method from Babu et al.21 or an ultrasonication (VCX 750, Sonics & Materials, Inc., Newtown, CT, USA) method at 750 W and 20 kHz according to the method from Kim et al.22 The ultrasonic treatment involved pulsing on-time for 20 s and off-time for 20 s and the sample solution was controlled to not exceed 60 °C. The standard tip (13 mm diameter) of the ultrasound probe was immersed into the solution at 20%, 40% or 60% amplitude for 40 min. The hydrolyzed solutions were frozen and dried to obtain SH powders using a freeze dryer (Scanvac Coolsafe 100–4 Pro, Lynge, Denmark).
2.3 Characterization of sericin and sericin hydrolysates
2.3.1 Moisture content. The moisture content (MC) levels of the sericin and SH powders were determined according to AOAC.23
2.3.2 Color. The color values of the sericin and SH powders were measured based on the CIE system (L*, a* and b*) using a spectrophotometer (Spectro-guide sphere gloss, model CD-6834, BYK-Gardner GmbH; Geretsried, Germany).
2.3.3 Degree of hydrolysis. The degree of hydrolysis (DH) for each SH powder was determined according to Hoyle and Merritt24 with a slight modification. The sample (0.4 g) was dissolved in 10 mL of distilled water and shaken in a water bath for 30 min. The solution (10 mL) was mixed with 10 mL of 10% trichloroacetic acid (TCA). The mixtures were centrifuged at 5000×g (25 °C) for 10 min to obtain the supernatant. Then, 10% TCA soluble nitrogen of the supernatants and total nitrogen in the sample were determined using the Kjeldahl method. DH was calculated as follows:
2.3.4 Total phenolic content. The total phenolic content (TPC) levels of the sericin and SH powders were determined using the Folin–Ciocalteu method, following the method of Meerasri and Sothornvit25 with a slight modification. Sericin powder (0.1 g) was dissolved in 10 mL of distilled water and homogenized at 7000 rpm for 30 s. Then, the sericin extract solution (0.4 mL) was mixed with 2 mL of 10% Folin–Ciocalteu reagent and kept at room temperature (RT, 25 °C) for 5 min before adding 1.6 mL of 7.5% Na2CO3. The absorbance was measured at 765 nm using a spectrophotometer (V-770 UV/VIS/NIR, Jasco Corporation, Tokyo, Japan) after incubation in the dark at RT for 1 h. A calibration curve of gallic acid was used and results were expressed as grams of gallic acid equivalent (GAE) per gram of dry sample.
2.3.5 Antioxidant activity. The antioxidant activities of the sericin and SH powders were evaluated using DPPH assay, according to the method of Meerasri and Sothornvit25 with a slight modification. A 0.1 g sample of sericin powder was dissolved in 30 mL of distilled water and homogenized at 7000 rpm for 30 s. Then, the sericin extract solution (2 mL) was mixed with 0.25 mM DPPH solution (4 mL). The solution was allowed to stand for 1 h in the dark at RT and then the absorbance was measured at 515 nm using the spectrophotometer. The calibration curve of Trolox was used and results were expressed as milligrams of Trolox per gram of dry sample.
2.3.6 Molecular weight distribution. Sodium dodecyl sulphate–polyacrylamide gel electrophoresis (SDS-PAGE) analysis was performed in a vertical SDS-PAGE system (Bio-Rad Laboratories, Inc., Philadelphia, PA, USA) according to the method of Samsalee and Sothornvit.26 Samples (each 20 μL) of the sericin or SH powders solution (0.4% w/v) were diluted at 1:1 in sample buffer (Laemmli sample buffer, β-mercaptoethanol) and heated at 90 °C for 10 min prior to the gel running. The gels (4–20% precast polyacrylamide gel, Mini-Protein® TGXTM Precast Gels) were placed in the electrophoresis cell. The electrode buffer (25 mM Tris–HCl, 0.192 M glycine and 0.1% SDS) was added into the chamber. A 7 μL sample of Precision Plus Protein All Blue as a standard marker (15–250 kDa; Bio-Rad, Philadelphia, USA) was used in the first lane and 10 μL of sample was loaded in each lane. The electrophoresis was run at 120 V for 40 min. Coomassie Brilliant Blue R-250 (0.15%) was used to stain and fix the protein bands in gel using 30% (v/v) methanol and 10% (v/v) acetic acid.
2.4 Sericin film preparation
Sericin film solution (2 wt%) was prepared by dissolving sericin powders in distilled water (SF-DW) or ethanol (15% v/v; SF-E). The solution was stirred at 70 °C for 50 min, cooled and later added with 50% (w/w of sericin powders) of glycerol with a slight modification from Yun et al.27 The solution was completely mixed using magnetic stirring, poured into Petri dishes (15 cm diameter) and then dried in a hot-air oven at 50 °C for 10 h. The total solid of each film was controlled at 2 g per dish. The film samples were peeled from the Petri dishes and kept at 25 ± 3 °C and 50 ± 5% relative humidity (RH) for further analyses.
A sericin-to-SH film solution ratio of 1:1 (w/w) was prepared by dissolving sericin powder and SH in distilled water (SF-SH-DW). The film preparation was done as described previously, except 30% glycerol used for film formation.
2.5 Properties of sericin films
2.5.1 Moisture content. The MC of sericin film was determined according to AOAC.23 The sericin films were weighed and dried in the hot-air oven at 105 °C for 24 h until a constant weight was reached.
2.5.2 Color. The color of the sericin films was evaluated using the spectrophotometer. The color values (L*, a* and b*) were reported. A white standard (L* = 88.25, a* = 1.44, b* = 6.58) was used as a background for color calibration.
2.5.3 Water vapor permeability. The water vapor permeability (WVP) of the sericin films was determined using the gravimetric method, according to ASTM.28 A cup was filled with 6 mL distilled water and the film was fixed on the mouth of cup and then placed into a chamber at 27 ± 2 °C and 50 ± 2% RH. The weight of cup sample was recorded at different times up to 10 h. The WVP (g mm kPa−1 h−1 m−2) was determined using the following equation:
where WVTR is the water vapor transmission rate (g h−1 m−2), d is the film thickness (mm) and PA1, PA2 are the partial pressures of water vapor inside and outside the cup (kPa), respectively.
2.5.4 Solubility. The film samples were cut into pieces (2 cm × 2 cm) and dried in the hot-air oven at 105 °C for 24 h. The initial dry weight was measured. Samples were put in 10 mL of distilled water and shaken in the water bath for 24 h. The residual films were dried in the hot-air oven at 105 °C for 24 h until the weight was constant, which was recorded as the final dry weight. The solubility of films was determined using the equation:
2.5.5 Mechanical properties. The mechanical properties of the sericin films (tensile strength, elastic modulus and elongation) were evaluated using a universal testing machine (5569, Instron, Norwood, MA, USA) with a 50 N load cell. The film samples were cut in a dumbbell shape (width 8 mm and length 50 mm). The film samples were kept at 25 ± 3 °C and 50 ± 5% RH for 48 h before testing. The initial grip separation and cross-head speed were set at 50 mm and 50 mm min−1, respectively.
2.5.6 Total phenolic content. Each film (0.1 g) was mixed with 10 mL of distilled water and then homogenized at 7000 rpm for 30 s to obtain the film extract for TPC and antioxidant activity. The TPC of the film extract was determined using the Folin–Ciocalteu method, as mentioned previously. The results were expressed as grams of GAE per gram of dry sample.
2.5.7 Antioxidant activity. The antioxidant activity of the film extract was evaluated using DPPH assay, as mentioned previously. The results were expressed as milligrams of Trolox per gram of dry sample.
2.6 Statistical analysis
A completely randomized design was used to conduct the experiment. All experimental data were analyzed using one-way analysis of variance in the SPSS statistical software package (SPSS 18.0 for Windows, SPSS Inc., Chicago, IL, USA) and expressed as a mean ± standard deviation. Significant differences between mean values were calculated using Duncan's test at a significance level of 0.05.
3. Results and discussion
3.1 Characterization of sericin and sericin hydrolysate
3.1.1 Moisture content. The MC of sericin and SH was influenced by the type of solvent and the hydrolysis method, as shown in Table 1. The sericin had the lowest MC of 0.39%. SH-CA using either the water bath or ultrasonication at different amplitudes produced a higher MC compared to those from SH-HA and SH-DW. This might have been due to the formation of ester bonds between the reactive hydroxyls of sericin and the carboxylic acids of CA, enhancing the cross-links between the molecules, consequently resulting in water being trapped inside the matrix.29 Likewise, there were higher MC values of the samples treated with CA than for samples treated with HA in the rice starch hydrolysis process.29 In addition, sweet potato starch treated with CA had a higher water absorption index (WAI) than samples treated with HA.21 For the hydrolysis method, SH using ultrasonication had a lower MC than from using the water bath. This might have been due to the acoustic waves providing high shear to the smaller size resulting in the decrease in water retention and finally the lower MC of the SH.30,31
Table 1 Moisture content (MC) and color of sericin and sericin hydrolysate obtained using different solvents with water bath or ultrasonication at different amplitudesa
| Sample |
MC (%) |
Color |
| Method |
Solvent |
Amplitude (%) |
L* |
a* |
b* |
| Mean values (±SD) followed by different letters in same column indicate significant (p < 0.05) differences. DW = distilled water; CA = citric acid; HA = hydrochloric acid. |
| Sericin |
|
|
0.39l ± 0.01 |
55.13h ± 0.10 |
1.67f ± 0.01 |
13.62e ± 0.00 |
| Sericin hydrolysate |
|
|
|
|
|
|
| Water bath |
DW |
|
5.55e ± 0.09 |
57.34g ± 0.55 |
1.01h ± 0.08 |
12.88f ± 0.25 |
| CA |
|
21.97a ± 0.01 |
57.95f ± 0.00 |
2.09d ± 0.04 |
15.06c ± 0.04 |
| HA |
|
4.29f ± 0.06 |
64.53c ± 0.01 |
0.55j ± 0.03 |
11.80h ± 0.06 |
| Ultrasonication |
DW |
20 |
2.45h ± 0.05 |
62.81d ± 0.09 |
0.25l ± 0.08 |
9.21i ± 0.01 |
| 40 |
3.25g ± 0.03 |
60.81e ± 0.00 |
0.07m ± 0.04 |
8.03j ± 0.01 |
| 60 |
1.89j ± 0.07 |
60.91e ± 0.15 |
0.39h ± 0.00 |
7.79k ± 0.19 |
| CA |
20 |
19.27b ± 0.12 |
68.75a ± 0.01 |
1.79e ± 0.12 |
16.70a ± 0.06 |
| 40 |
17.84c ± 0.84 |
65.19b ± 0.02 |
1.48g ± 0.01 |
16.58a ± 0.00 |
| 60 |
15.60d ± 0.31 |
53.23i ± 0.03 |
0.80i ± 0.01 |
12.11g ± 0.03 |
| HA |
20 |
1.23k ± 0.02 |
40.32j ± 0.01 |
6.38a ± 0.04 |
16.09b ± 0.05 |
| 40 |
3.56g ± 0.30 |
35.69l ± 0.01 |
3.90k ± 0.01 |
14.66d ± 0.04 |
| 60 |
1.72i ± 0.01 |
37.99k ± 0.01 |
4.74b ± 0.04 |
14.75d ± 0.10 |
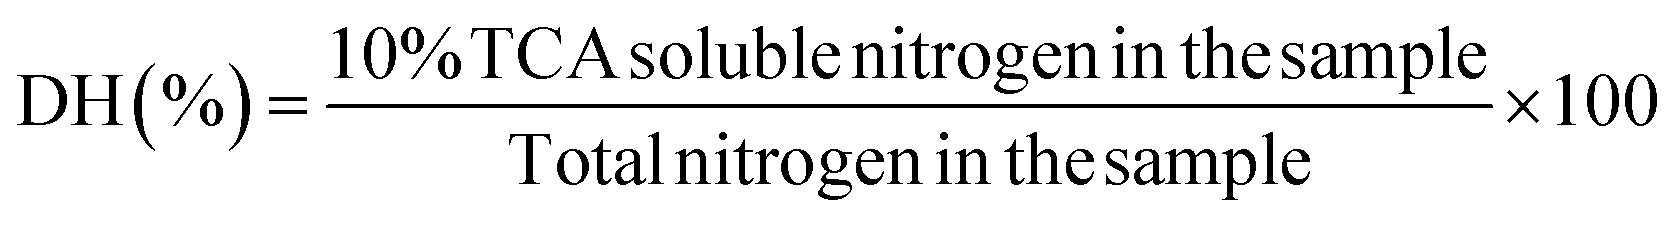
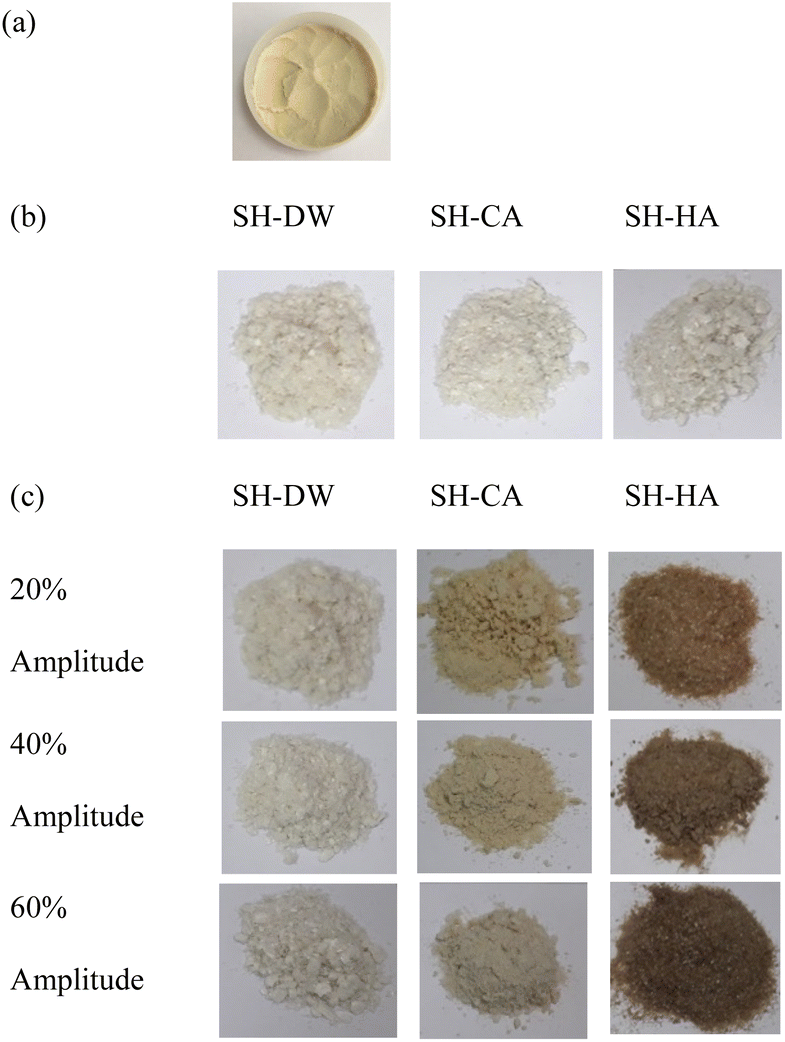
3.1.2 Color. There was a significant reduction in the lightness of SH obtained from ultrasonic-assisted acid hydrolysis compared to SH using DW and sericin (Table 1). In particular, SH using ultrasonic-assisted HA hydrolysis had lower L* and higher a* and b* values than SH obtained from CA. This indicated a color tendency toward greenness and yellowness (Fig. 1). This might have been because the strong acid (HA) combined with ultrasonic hydrolysis was more powerful in breaking down the protein molecules of sericin. Similarly, Rodsamran and Sothornvit32 reported that lime peel pectin obtained from conventional extraction with HA had lower L* and higher a* and b* values than those obtained from CA. Fadimu et al.11 and Zhou et al.33 reported a decrease in the L* and the increase in the b* values in lupin protein and egg white protein hydrolysates pretreated using ultrasound. Ultrasonic cavitation might increase the surface hydrophobicity of the protein and decrease the sulfhydryl group content. As a result, the exposed area of molecules of embedded riboflavin (coloring agent) inside proteins was increased. Sit et al.34 found that dry taro starch powder treated using different ultrasonic treatment conditions significantly decreased the L* value and increased the a* and b* values compared to the untreated sample.
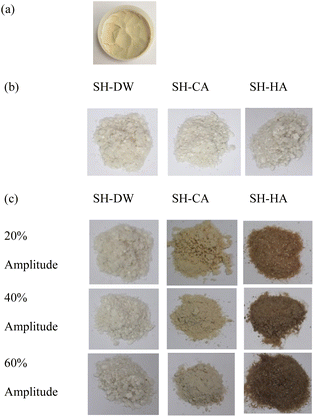 |
| | Fig. 1 Visual appearance of (a) sericin and sericin hydrolysate (SH) powder obtained using distilled water (SH-DW), citric acid (SH-CA) and hydrochloric acid (SH-HA) using (b) water bath or (c) ultrasonication at different amplitudes. | |
3.1.3 Degree of hydrolysis. The DH of SH with different solvents using the water bath or ultrasonication at different amplitudes of 20%, 40% or 60% are shown in Table 2. For acid hydrolysis, SH hydrolyzed by HA had the highest DH value, followed by CA and DW, respectively. These results showed that the strength of the acid affected the DH values. Similarly, the results of HA hydrolysis of Persian sturgeon visceral protein presented higher DH values than from sodium hydroxide hydrolysis13 and HA (8 M) hydrolysis had a higher DH value of fish protein hydrolysates than those at 4 M and 6 M.35 In addition, SH obtained from an ultrasonic method (33.54–68.60%) had lower DH values than from the water bath method (71.36–81.11%). It was possible that the temperature affected the change in the DH of SH because the ultrasonic method (60 °C) had a lower temperature than the water bath method (70 °C). Similarly, the DH of hydrolyzed collagen from salmon scale ossein using a thermal treatment (55 °C) in a water bath was higher than for pretreatment using ultrasonication (5–8 °C) alone, while hydrolyzed collagen pretreated using ultrasonication and followed by thermal treatment had the highest DH value.36 The DH of protein hydrolysates from Persian sturgeon viscera increased with increasing hydrolysis temperature.9 Interestingly, different amplitudes also affected DH values. The DH values of SH treated using ultrasonication increased with increasing amplitude levels from 20% to 40% and decreased when it was increased up to 60%. This might have been due to the aggregation of polymers between hydrophobic and hydrophobic interactions at higher amplitudes, resulting in lower DH values.37 Similarly, duck albumen hydrolysates pretreated thermally, followed by ultrasonication at 60% amplitude had the highest DH.37 Surprisingly, the DH values in the current research were higher than those from enzymatic hydrolysis of SH (10.04–22.23%) reported by Wu et al.,38 suggesting that the formation of reaction products at high degrees of hydrolysis limited the enzyme–protein interaction.13 Thus, this could be considered as an advantage of using acid hydrolysis assisted with a water bath or ultrasonication compared to using enzymatic hydrolysis.
Table 2 Degree of hydrolysis (DH), total phenolic content (TPC) and antioxidant activity (DPPH) of sericin and sericin hydrolysate obtained using different solvents with water bath or ultrasonication at different amplitudesa
| Sample |
DH (%) |
TPC (g GAE per g of dry sample) |
DPPH (mg Trolox per g of dry sample) |
| Method |
Solvent |
Amplitude (%) |
| Mean values (±SD) followed by different letters in same column indicate significant (p < 0.05) differences. GAE = gallic acid equivalents; DW = distilled water; CA = citric acid; HA = hydrochloric acid. |
| Sericin |
|
|
— |
0.39a ± 0.00 |
5.95g ± 0.09 |
| Sericin hydrolysate |
|
|
|
|
|
| Water bath |
DW |
|
71.36b ± 0.08 |
0.29e ± 0.00 |
5.31h ± 0.00 |
| CA |
|
78.49a ± 0.01 |
0.18h ± 0.00 |
9.33e ± 0.00 |
| HA |
|
81.11a ± 0.49 |
0.23g ± 0.01 |
8.62f ± 0.01 |
| Ultrasonication |
DW |
20 |
44.80ef ± 0.25 |
0.35b ± 0.00 |
6.07g ± 0.33 |
| 40 |
50.96d ± 0.08 |
0.32d ± 0.00 |
4.10i ± 0.04 |
| 60 |
34.19g ± 0.64 |
0.33c ± 0.00 |
3.01j ± 0.35 |
| CA |
20 |
33.54g ± 0.15 |
0.11j ± 0.00 |
10.85d ± 0.11 |
| 40 |
48.57de ± 1.50 |
0.16i ± 0.00 |
9.26e ± 0.00 |
| 60 |
43.06f ± 6.74 |
0.18h ± 0.00 |
10.83d ± 0.37 |
| HA |
20 |
55.65c ± 0.72 |
0.29e ± 0.00 |
14.56c ± 0.05 |
| 40 |
68.60b ± 0.06 |
0.26f ± 0.01 |
15.31b ± 0.00 |
| 60 |
56.03c ± 0.41 |
0.32cd ± 0.00 |
17.31a ± 0.15 |
3.1.4 Total phenolic content. The TPC of the sericin and SH obtained using the different methods are shown in Table 2. After hydrolysis, the TPC of SH significantly decreased compared to that of sericin. In general, acid hydrolysis is used to cleave the ester bond of the sample, which acts as other specific phenolic compounds.39 In the current study, the use of acid hydrolysis clearly affected the reduction in the TPC of the SH due to the high temperature of hydrolysis. The TPC is temperature-sensitive and degrades easily. This corresponded with the losses in cinnamic acid derivatives, p-coumaric, caffeic and ferulic acids of wheat bran under the high temperature of acid hydrolysis conditions.39
3.1.5 Antioxidant activity. The effects of the acid and hydrolysis method on the DPPH of SH is shown in Table 2. The DPPH value of sericin was 5.95 mg Trolox per g of dry sample. In comparison, ultrasonic hydrolysis produced a higher DPPH of SH than the water bath hydrolysis method. This implied that the ultrasonic method could significantly improve the antioxidant activities of SH. The increase in the DPPH value of SH was due to the acoustic cavitation of ultrasonication disrupting the protein molecules to small peptides or amino acids, which acted as hydrogen donors and converted free radicals to be more stable products.31,40 Zhang et al.41 also reported that the smaller MW of the peptides could produce a higher DPPH value. Solvents influenced the antioxidant activity of SH. As shown, a strong acid had a higher DPPH of SH than a weak acid. Sani et al.42 reported that acid hydrolysis (HCl) of germinated grown rice had a higher DPPH value than basic hydrolysis (NaOH) and the non-hydrolyzed sample.
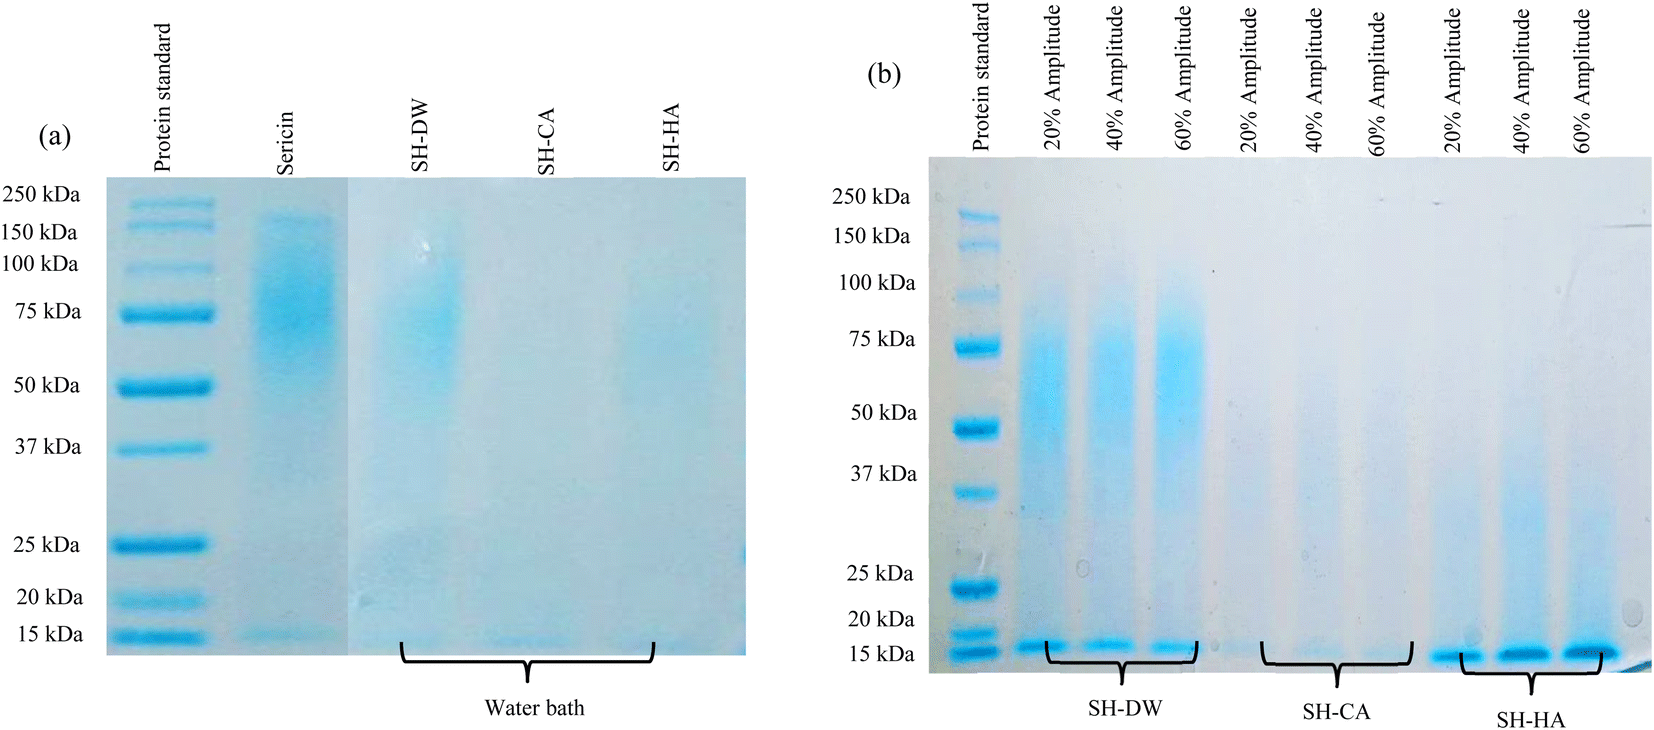
3.1.6 Molecular weight distribution. The MW distributions of SH obtained using different solvents with a water bath or ultrasonication at different amplitudes are presented in Fig. 2. The results showed high density protein bands of SH-DW using the water bath in the range 50–150 kDa, which did not differ from sericin (Fig. 2(a)). SH-CA and SH-HA using the water bath showed continuous protein bands in the range 50–100 kDa. The decrease in the MW of SH using acid hydrolysis was due to the break down between the protein molecules. Xie et al.43 reported that resistant waxy maize dextrin hydrolyzed using sulfuric acid (3.16 M) resulted in a smaller size of crystallized particles than in samples without hydrolysis. In addition, He et al.44 suggested that the use of an acid–alkali treatment at low pH affected the degradation of protein and reduced the allergenicity of silkworm pupa protein extract. Under hydrolysis methods, the MW of SH decreased using ultrasonic-assisted hydrolysis compared to SH using the water bath for the same solvent, as shown in Fig. 2(b). SH-DW using ultrasonic-assisted hydrolysis showed continuous protein bands in the range 50–75 kDa and high-density protein bands at 15 kDa, whereas SH-CA showed protein bands in the range 37–50 kDa and SH-HA showed continuous protein bands in the range 20–37 kDa and high density protein bands at 15 kDa. These results indicated that SH obtained from ultrasonic-assisted hydrolysis had lower MW values than from using the water bath. It was possible that the effect of cavitation during the ultrasonication resulted in the small peptides or amino acids.31,40 Zhang et al.41 reported that the effects of the high temperature, pressure and shear forces of ultrasonic treatment caused a break in the cross-linkage between protein molecules. They found that soy protein isolate (SPI) hydrolysates pretreated using ultrasonic assistance had a lower MW than the control (SPI without ultrasonication). However, the different amplitudes did not affect the MW of SH. The results showed that the MW of SH-HA using ultrasonic-assisted hydrolysis were similar to the SH produced by protease from Bacillus halodurans SE5 or Alcalase and SH hydrolysed by trypsin. Furthermore, sericin extracted using Bacillus halodurans SE5 or Alcalase and hydrolysed using trypsin had MW values of 50 kDa, <15 kDa and <10 kDa, respectively,45,46 whereas SH-HA using ultrasonic-assisted hydrolysis in the current study had protein bands in the range 20–37 kDa and at 15 kDa, indicating that the hydrolysis process with HA using ultrasonic assistance was as effective as enzymatic hydrolysis. In addition, this hydrolysis was cheaper than using enzymatic hydrolysis.
 |
| | Fig. 2 SDS-PAGE profiles of protein standard marker and protein of sericin and sericin hydrolysate (SH) obtained using distilled water (SH-DW), citric acid (SH-CA) and hydrochloric acid (SH-HA) using (a) water bath or (b) ultrasonication at different amplitude. | |
The correlation between the factors of hydrolysis and properties of SH is shown in Table 3. It was found that the solvents were significantly correlated with the MC, color (L*, a*, b*) and DPPH values, while the hydrolysis method and the amplitude were correlated with only the DH value. Thus, the solvent was the main factor in selecting the SH. The results showed that SH-HA had lower MC and higher DPPH values compared to the SH from other solvents. Furthermore, ultrasonic hydrolysis using 20% amplitude produced a DH value that did not differ from 60%. Therefore, SH-HA using ultrasonic hydrolysis at 20% amplitude was chosen to incorporate into the sericin film. It was expected that SH-HA with a higher DPPH value may enhance the film antioxidant properties of the active sericin film.
Table 3 Correlations for the effect of methods, solvents and amplitudes on moisture content (MC), color (L*, a*, b*), degree of hydrolysis (DH), total phenolic content (TPC) and antioxidant activity (DPPH)
| Factor |
|
MC |
L* |
a* |
b* |
DH |
TPC |
DPPH |
| Correlation is significant at 0.01 level (2-tailed). |
| Methods |
Pearson correlation |
0.353 |
−0.239 |
0.221 |
−0.052 |
−0.796a |
0.144 |
0.239 |
| Sig. (2-tailed) |
0.091 |
0.261 |
0.300 |
0.810 |
0.000 |
0.502 |
0.261 |
| Solvents |
Pearson correlation |
0.746a |
−0.597a |
0.734a |
0.640a |
0.394 |
−0.256 |
0.878a |
| Sig. (2-tailed) |
0.000 |
0.002 |
0.000 |
0.001 |
0.057 |
0.226 |
0.000 |
| Amplitudes |
Pearson correlation |
0.288 |
−0.321 |
0.075 |
−0.217 |
−0.620a |
0.186 |
0.179 |
| Sig. (2-tailed) |
0.172 |
0.126 |
0.727 |
0.308 |
0.001 |
0.385 |
0.401 |
3.2 Effect of sericin hydrolysate in sericin film properties
3.2.1 Moisture content. The MC of the sericin films is presented in Table 4. The type of film forming the solvent significantly affected the MC of the film. The sericin film prepared from the DW solution (SF-DW) had a higher MC than from 15% ethanol (SF-E). This result may have been due to the polarity of the solvents affecting the affinity of the hydrophobicity or hydrophilicity of the sericin films. Sericin protein contains many polar amino acids (serine, aspartic acid and glycine), especially a majority of strong hydrophilicity polar hydroxyl amino acids that can be considered as a hydrophilic protein.47 Thus, the higher polarity of water over ethanol provided a higher MC of the SF-DW than for SF-E. In contrast, the addition of SH reduced the MC of the film. The SH might possibly interact with water molecules resulting in lower MC of SF-SH-DW film. This phenomenon was similar to the decrease in moisture content of fish tofu with the addition of shrimp hydrolysate in the recipe.48
Table 4 Properties of sericin films using distilled water (SF-DW) or 15% ethanol (SF-E) and sericin hydrolysate incorporation (SF-SH-DW)a
| Film property |
Film formulation |
| SF-DW |
SF-E |
SF-SH-DW |
| Mean values (±SD) followed by different letters in same column indicate significant (p < 0.05) differences. WVP = water vapor pressure. |
| Moisture content (%) |
52.90a ± 0.12 |
42.41b ± 0.04 |
27.21c ± 0.78 |
| Color |
L* |
83.23b ± 0.08 |
83.69a ± 0.17 |
78.41c ± 0.01 |
| a* |
−0.95b ± 0.01 |
−1.05b ± 0.04 |
−0.47a ± 0.02 |
| b* |
15.36b ± 1.02 |
13.98b ± 0.59 |
26.09a ± 0.09 |
| WVP (g mm kPa−1 h−1 m−2) |
3.31c ± 0.01 |
3.81b ± 0.04 |
6.43a ± 0.14 |
| Solubility (%) |
47.82c ± 0.03 |
61.13b ± 0.06 |
89.93a ± 6.48 |
| Tensile strength (MPa) |
18.13a ± 1.15 |
14.05b ± 1.77 |
5.73c ± 0.37 |
| Elongation (%) |
14.23a ± 0.06 |
6.22b ± 0.01 |
6.49b ± 0.81 |
| Elastic modulus (MPa) |
334.87a ± 14.64 |
430.37a ± 65.13 |
159.36b ± 4.09 |
3.2.2 Color. There were no differences in the color parameters of SF-DW and SF-E, except for L* (Table 4). As expected, the addition of SH affected the film color of SF-SH-DW; L* significantly decreased, while a* and b* increased compared to SF-DW, with a slight color tendency toward greenness and yellowness in SF-SH-DW due to the yellowness of the SH powder (Fig. 1).
3.2.3 Water vapor permeability. Table 4 shows the WVP values of SF-DW, SF-E and SF-SH-DW. Compared with SF-DW, SF-E had a significant greater WVP perhaps because of the affinity of the hydrophobic or hydrophilic interaction between the sericin and solvents affecting the rearrangement of the film structure during film drying. The results obtained were in agreement with those reported by Zhang et al.49 that the WVP of zein/chitosan films produced from 80% ethanol (5.00 kg m Pa−1 s−1 m−2) was lower than that produced from 95% ethanol (5.56 kg m Pa−1 s−1 m−2) due to the polarity of the solutions. Another hypothesis is that the easier evaporation of the ethanol in SF-E resulted in the voids in the protein film matrix driving the water vapor diffusion better than in SF-DW. The addition of SH increased the WVP of the film due to the smaller molecular size of SH leading to an increase in water affinity. In addition, SH might act as an alternative plasticizer making the film more flexible and creating free volume for water vapor diffusion.50 The WVP of gelatin51 and alginate52 films were significantly increased with the addition of protein hydrolysates.
3.2.4 Solubility. The solubility of SF-E was significantly higher than that of SF-DW (Table 4). This might be attributed to the reduced compactness of the film structure of SF-E due to the easier evaporation of ethanol during film drying. Thus, water was easily inserted into the film structure, resulting in higher film solubility. Furthermore, the incorporation of SH increased the solubility of the film. This may have been due to the hydrophilic nature increasing the water affinity of SH and the weak interactions between short chain peptides and the protein matrix.53 In addition, SH also contained a high amount of the hydrophilic amino acids,38 causing higher solubility of SF-SH-DW than for the other films. Similarly, Da Rocha et al.54 reported a higher solubility of agar-based films with the incorporation of Argentine croaker protein hydrolysates (PH) from fish than for the control film (without PH).
3.2.5 Mechanical properties. Different solvents influenced the tensile strength (TS), elongation (E) and elastic modulus (EM) values of the sericin films (Table 4). The values for TS and E of SF-DW were higher than those for SF-E due to the polarity of the solvents. The strong interactions within the film network resulted in increased TS in the sericin film. However, the incorporation of SH led to a significant decrease in TS, E and EM in the film compared to SF-DW. This might have been due to the small particle size of SH that could be easily inserted in the sericin network and weakened the structure of the sericin film, leading to fewer intermolecular interactions and increased free volume between the polymer chains, as confirmed by the WVP results.55 Similarly, the addition of fish protein, purafect or savinase hydrolysates into the gelatin films led to a decrease in TS values due to the weaker chain-to-chain interaction by hydrogen bonding.51,55
3.2.6 Total phenolic content. The results showed significant differences in the TPC values between DW and the ethanol (15%) solvents in the sericin films (Fig. 3). It was found that the SF-E (0.26 g GAE per g of dry sample) had a significantly lower TPC value than SF-DW (0.29 g GAE per g of dry sample). The concentration of ethanol and the properties of the solvent (density, dielectric constant and dynamic viscosity) affected the change in solubility of polyphenols.56,57 Thus, the amount of obtained TPC depended on the optimum use of solvents and polar or nonpolar phenolic acids during extraction.56 Butkhup et al.2 reported that silk sericin extracted from the Nangnoi, Chokumnoui 1, Chokumnoui 2 and Eri strains using water had higher phenolics than using 70% ethanol extraction. It might be possible that the preparation of the film solution influenced the TPC. A film solution prepared using DW may have a greater amount of TPC from sericin and be later dissolved into film solution than that prepared with 15% ethanol. Comparatively, the ethanol concentration affected the TPC of black currants by increasing the ethanol concentration from 39% to 60% and then decreasing it with an increased ethanol concentration from 60% to 95%.56 These results were in agreement with the observation that a higher concentration of TPC extracted from olive (Olea europaea) leaf was obtained using 40% and 60% ethanol.57 However, the incorporation of SH into the sericin film had the highest TPC values (0.31 g GAE per g of dry sample). It was possible that SH contained the primary structure antioxidant amino acids (such as histidine, proline and phenylalanine) which are also involved in the biosynthesis of polyphenols and alkaloids.5,58,59 Furthermore, SH also contains phenols5 resulting in a higher TPC for SF-SH-DW. Similarly, cottonseed protein hydrolysate (PH) enriched films had higher TPC values at higher PH concentrations.52
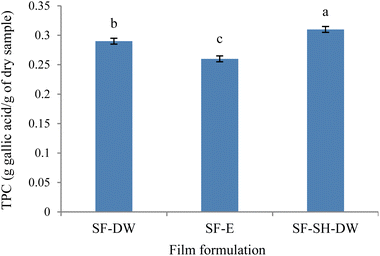 |
| | Fig. 3 Total phenolic content (TPC) of sericin films (SF) using distilled water (SF-DW) or 15% ethanol (SF-E) and sericin hydrolysate incorporation (SF-SH-DW), where error bars = standard deviation. | |
3.2.7 Antioxidant activity. The SF-DW had a DPPH value of 10.05 mg Trolox per g of dry sample, which was 30.45% higher than that of the SF-E (Fig. 4). This might relate to the many polar amino acids (such as serine, threonine and proline) of sericin that were greatly dissolved in the solvent at a high water content, and the composition of amino acids (such as hydroxyl groups of serine and threonine) associated with the increasing DPPH values.60 In addition, the DPPH value was a significantly higher antioxidant in the sericin films enriched with SH due to the high amounts of amino acids (serine, aspartic acid, glycine, threonine and glutamic acid) of SH which was related to antioxidant activity.38 Particularly, SH contained more glutamic acid (5.04%) than sericin (2.54% ref. 5 and 38). This might be due to the increase in formation of small peptides during hydrolysis.61 This amino acid can act as free radical scavengers or hydrogen donors,20 resulting in a higher DPPH of SF-SH-DW. Therefore, the incorporation of protein hydrolysates into films increased the antioxidant capacity of film. As reported, chitosan and gelatin film enriched with shrimp and crab shells protein hydrolysates (SPH and CPH) at different concentrations (1.5–6%), showed DPPH values of 75.37–86.23% and 71.46–78.30% for SPH and CPH, respectively, compared with 49.20% DPPH of chitosan and gelatin film without SPH and CPH.20
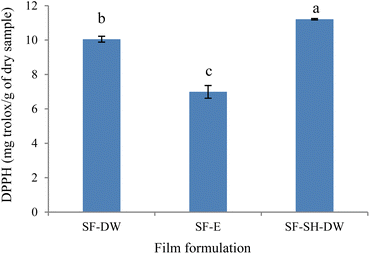 |
| | Fig. 4 Antioxidant activity (DPPH) of sericin films (SF) using distilled water (SF-DW) or 15% ethanol (SF-E) and sericin hydrolysate incorporation (SF-SH-DW), where error bars = standard deviation. | |
4. Conclusions
Acid solvent was used to hydrolyze sericin, resulting in a lower MW, with strong acid hydrolysis producing a significant MW reduction. The acid hydrolysis affected the color parameters (lower lightness and higher redness and yellowness) of SH. As confirmed, the use of acid solvent led to higher antioxidant activity of SH. Thus, SH from a strong acid with 20% amplitude of ultrasonic-assisted hydrolysis was selected to produce an active sericin film, due to its higher antioxidant activity and lower MW. The solubility, WVP and mechanical properties of the sericin films were influenced by using different solvents and the addition of SH. Sericin film produced from DW showed lower solubility and WVP values but higher tensile strength and elongation than films produced from 15% ethanol and film from DW with SH. Nevertheless, the addition of SH into the sericin films enhanced their total phenolic content and antioxidant properties. Consequently, sericin film incorporated with sericin hydrolysate might be a novel alternative functional active film material for use in pharmaceutical medical and food packaging applications.
Author contributions
Jitrawadee Meerasri: methodology, data curation, writing – original draft preparation. Rungsima Chollakup: supervision, conceptualization, resources, methodology. Rungsinee Sothornvit: supervision, conceptualization, methodology, writing – reviewing and editing.
Conflicts of interest
The authors have no conflicts of interest to declare.
Acknowledgements
This research was supported by the Kasetsart University Research and Development Institute (KURDI), Bangkok, Thailand (FF(KU)28.65).
References
- L. Lamboni, M. Gauthier, G. Yang and Q. Wang, Biotechnol. Adv., 2015, 33(8), 1855–1867 CrossRef CAS.
- L. Butkhup, M. Jeenphakdee, S. Jorjong, S. Samappito, W. Samappito and J. Butimal, Food Sci. Biotechnol., 2012, 21(2), 389–398 CrossRef CAS.
- P. Aramwit, S. Damrongsakkul, S. Kanokpanont and T. Srichana, Biotechnol. Appl. Biochem., 2010, 55(2), 91–98 CrossRef CAS PubMed.
- A. Omar, A. Arken, A. Wali, Y. Gao, H. A. Aisa and A. Yili, Process Biochem., 2022, 117, 101–109 CrossRef CAS.
- A. Wubulikasimu, A. Omar, Y. Gao, N. Mukhamedov, A. Arken, A. Wali, Sh. Ya. Mirzaakhmedov and A. Yili, Chem. Nat. Compd., 2021, 57(2), 346–349 CrossRef CAS.
- K. Yakul, T. Kaewsalud, C. Techapun, P. Seesuriyachan, K. Jantanasakulwong, M. Watanabe, S. Takenaka and T. Chaiyaso, J. Chem. Technol. Biotechnol., 2021, 96(4), 953–962 CrossRef CAS.
- A. Marciniak, S. Suwal, N. Naderi, Y. Pouliot and A. Doyen, Trends Food Sci. Technol., 2018, 80, 187–198 CrossRef CAS.
- C. C. Udenigwe and R. E. Aluko, J. Food Sci., 2012l, 77(1), R11–R24 Search PubMed.
- M. Ovissipour, A. Abedian, A. Motamedzadegan, B. Rasco, R. Safari and H. Shahiri, Food Chem., 2009, 115(1), 238–242 CrossRef CAS.
- C. Colleary, N. C. Little and T. P. Cleland, Rapid Commun. Mass Spectrom., 2019, 34(2), e8568 Search PubMed.
- G. J. Fadimu, H. Gill, A. Farahnaky and T. Truong, Food Bioprocess Technol., 2021, 14(11), 2004–2019 CrossRef CAS.
- L. Huang, X. Ding, C. Dai and H. Ma, Food Chem., 2017, 232, 727–732 CrossRef CAS PubMed.
- M. Ovissipour, R. Safari, A. Motamedzadegan and B. Shabanpour, Food Bioprocess Technol., 2012, 5(2), 460–465 CrossRef CAS.
- S. K. Ulug, F. Jahandideh and J. Wu, Trends Food Sci. Technol., 2021, 108, 27–39 CrossRef CAS.
- Y. Meng, Z. Liang, C. Zhang, S. Hao, H. Han, P. Du, A. Li, H. Shao, C. Li and L. Liu, LWT--Food Sci. Technol., 2021, 152, 112272 CrossRef CAS.
- R. Singh and V. S. Sharanagat, Int. J. Biol. Macromol., 2020, 164, 1061–1069 CrossRef CAS.
- Y. N. Jo and I. C. Um, Int. J. Biol. Macromol., 2015, 78, 287–295 CrossRef CAS.
- P. Aramwit, T. Siritientong and T. Srichana, Waste Manage. Res., 2012, 30(3), 217–224 CrossRef CAS PubMed.
- M. J. Jang and I. C. Um, Eur. Polym. J., 2017, 93, 761–774 CrossRef CAS.
- S. Hajji, H. Kchaou, I. Bkhairia, R. B. S. B. Salem, S. Boufi, F. Debeaufort and M. Nasri, Food Hydrocolloids, 2021, 116, 106639 CrossRef CAS.
- A. S. Babu, R. Parimalavalli, K. Jagannadham and J. S. Rao, J. Food Sci. Technol., 2015, 52(9), 5745–5753 CrossRef CAS PubMed.
- H. K. Kim, Y. H. Kim, Y. E. Kim, S. K. Jung, N. H. Lee and K. M. Song, Food Bioprod. Process., 2018, 108, 12–17 CrossRef CAS.
- Association of Official Analytical Chemists (AOAC), Method 934.01: Loss on drying (moisture) at 95–100 °C for feeds, in: Official methods of analysis of AOAC International, ed. W. Horwitz, Association of Official Analytical Chemists Inc., Gaithersburg, MD, 17th edn, 2000, pp. 1 Search PubMed.
- N. T. Hoyle and J. H. Merritt, J. Food Sci., 1994, 59(1), 76–79 CrossRef CAS.
- J. Meerasri and R. Sothornvit, Int. J. Biol. Macromol., 2020, 147, 1285–1293 CrossRef CAS PubMed.
- N. Samsalee and R. Sothornvit, Int. J. Food Sci. Technol., 2017, 52(4), 964–971 CrossRef CAS.
- H. Yun, M. K. Kim, H. W. Kwak, J. Y. Lee and M. H. Kim, Int. J. Biol. Macromol., 2016, 82, 945–951 CrossRef CAS.
- American Society of Testing and Materials (ASTM) International, Standard test method for water vapor transmission of materials (E96-95), ASTM International, West Conshohocken, PA, 1995 Search PubMed.
- P. C. Martins, L. C. Gutkoski and V. G. Martins, Int. J. Biol. Macromol., 2018, 120, 959–965 CrossRef CAS.
- A. Dey and N. Sit, Int. J. Biol. Macromol., 2017, 95, 314–320 CrossRef CAS PubMed.
- S. Shabana, R. Prasansha, I. Kalinina, I. Potoroko, U. Bagale and S. H. Shirish, Ultrason. Sonochem., 2019, 51, 444–450 CrossRef CAS PubMed.
- P. Rodsamran and R. Sothornvit, Food Chem., 2019, 278, 364–372 CrossRef CAS PubMed.
- B. Zhou, M. Zhang, Z. X. Fang and Y. Liu, Food Bioprod. Process., 2015, 96, 306–313 CrossRef CAS.
- N. Sit, S. Misra and S. C. Deka, Food Bioprocess Technol., 2014, 7(7), 1950–1958 CrossRef CAS.
- N. Wisuthiphaet, S. Kongruang and C. Chamcheun, J. Med. Biol. Eng., 2015, 4(6), 466–470 CAS.
- T. Sae-leaw and S. Benjakul, Int. J. Food Sci. Technol., 2018, 53(12), 2786–2795 CrossRef CAS.
- T. H. Quan and S. Benjakul, Int. J. Food Sci. Technol., 2019, 54(11), 3015–3023 CrossRef CAS.
- J. H. Wu, Z. Wang and S. Y. Xu, Process Biochem., 2008, 43(5), 480–487 CrossRef CAS.
- K. H. Kim, R. Tsao, R. Yang and S. W. Cui, Food Chem., 2006, 95(3), 466–473 CrossRef CAS.
- Y. Zou, W. Wang, Q. Li, Y. Chen, D. Zheng, Y. Zou, M. Zhang, T. Zhao, G. Mao, W. Feng, X. Wu and L. Yang, Process Biochem., 2016, 51(3), 431–443 CrossRef CAS.
- W. Zhang, L. Huang, W. Chen, J. Wang and S. Wang, Ultrason. Sonochem., 2021, 73, 105546 CrossRef CAS PubMed.
- I. M. Sani, S. Iqbal, K. W. Chan and M. Ismail, Molecules, 2012, 17(6), 7584–7594 CrossRef CAS PubMed.
- A. J. Xie, D. J. Lee and S. T. Lim, Food Hydrocolloids, 2021, 121, 106942 CrossRef CAS.
- W. He, K. He, F. Sun, L. Mu, S. Liao, Q. Li, J. Yi, Z. Liu and X. Wu, Food Chem., 2021, 343, 128461 CrossRef CAS PubMed.
- K. Yakul, S. Takenaka, K. Nakamura, C. Techapun, N. Leksawasdi, P. Seesuriyachan, M. Watanabe and T. Chaiyaso, Process Biochem., 2019, 78, 63–70 CrossRef CAS.
- A. Omar, Y. Gao, A. Wubulikasimu, A. Arken, H. A. Aisa and A. Yili, RSC Adv., 2021, 11(41), 25431–25440 RSC.
- Y. Luo and T. Wang, Pharmaceutical and cosmetic applications of protein by-products, in: Protein byproducts, ed. G. S. Dhillon, Academic Press. ISBN 9780128023914, 2016, pp. 147–160 Search PubMed.
- S. Ketnawa, S. Benjakul, O. Martínez-Alvarez and S. Rawdkuen, Fish. Sci., 2016, 82(2), 379–389 CrossRef CAS.
- L. Zhang, Z. Liu, X. Han, Y. Sun and X. Wang, Int. J. Biol. Macromol., 2019, 134, 807–814 CrossRef CAS.
- R. Sothornvit and J. M. Krochta, J. Food Sci., 2000, 65(4), 700–703 CrossRef CAS.
- A. H. Rostami, A. Motamedzadegan, S. E. Hosseini, M. Rezaei and A. Kamali, J. Aquat. Food Prod. Technol., 2017, 26(4), 457–467 CrossRef.
- J. G. de Oliveira Filho, J. M. Rodrigues, A. C. F. Valadares, A. B. de Almeida, T. M. de Lima, K. P. Takeuchi, C. C. F. Alves, H. A. de Figueiredo Sousa, E. R. da Silva, F. H. Dyszy and M. B. Egea, Food Hydrocolloids, 2019, 92, 267–275 CrossRef.
- S. Nuanmano, T. Prodpran and S. Benjakul, Food Hydrocolloids, 2015, 47, 61–68 CrossRef CAS.
- M. Da Rocha, A. Alemán, V. P. Romani, M. E. López-Caballero, M. C. Gómez-Guillén, P. Montero and C. Prentice, Food Hydrocolloids, 2018, 81, 351–363 CrossRef CAS.
- H. Kchaou, M. Jridi, N. Benbettaieb, F. Debeaufort and M. Nasri, Food Packag. Shelf Life, 2020, 24, 100477 CrossRef.
- J. E. Cacace and G. Mazza, J. Food Sci., 2003, 68(1), 240–248 CrossRef CAS.
- S. Mylonaki, E. Kiassos, D. P. Makris and P. Kefalas, Anal. Bioanal. Chem., 2008, 392(5), 977–985 CrossRef CAS PubMed.
- W. Bi, C. He, Y. Ma, J. Shen, L. H. Zhang, Y. Peng and P. Xiao, Acta Pharm. Sin. B, 2016, 6(2), 170–181 CrossRef PubMed.
- T. B. Zou, T. P. He, H. B. Li, H. W. Tang and E. Q. Xia, Molecules, 2016, 21(1), 72 CrossRef PubMed.
- K. Jena, J. P. Pandey, R. Kumari, A. K. Sinha, V. P. Gupta and G. P. Singh, Int. J. Biol. Macromol., 2018, 114, 1102–1108 CrossRef CAS PubMed.
- K. Alahmad, W. Xia, Q. Jiang and Y. Xu, Foods, 2022, 11(9), 1320 CrossRef CAS PubMed.
|
| This journal is © The Royal Society of Chemistry 2022 |
Click here to see how this site uses Cookies. View our privacy policy here. 
 Open Access Article
 This Open Access Article is licensed under a Creative Commons Attribution-Non Commercial 3.0 Unported Licence
 *a
*a