 Open Access Article
Integrating network pharmacology and an experimental validation strategy elucidates the protective effect and mechanism of callicarpa nudiflora against neuroinflammation†
Guodong Yang a,
Yufu Liua,
Yonglin Liua,
Yu Maa,
Yiguang Lib and
Jie Chen*a
aSchool of Pharmacy, Jiangxi University of Chinese Medicine, Nanchang 330004, China. E-mail: 19960246@jxutcm.edu.cn
bScientific Research Center, Jiangzhong Pharmaceutical Co. Ltd, Nanchang 330004, China
First published on 31st October 2022
Abstract
Abnormal activation of microglia promotes neuroinflammation (NI) in Alzheimer's disease (AD). Callicarpa nudiflora Hook et Arn. (CN) is a traditional Chinese herb with a wide range of clinical applications and definite anti-inflammatory effects. However, the anti-inflammatory action and mechanism of NI are not known. The purpose of this research was to survey whether CN could inhibit lipopolysaccharide (LPS)-induced inflammatory activation in BV-2 microglia. This study used a network pharmacology and pharmacophore model-based approach to explore the molecular mechanism of CN anti-NI by combining molecular docking and experimental validation. First, we screened the key active components and targets of CN anti-NI by network pharmacology. Then, the common structural features of these functional molecules in the treatment of neuroinflammation were predicted by 3D-QSAR pharmacodynamic modeling. Finally, the molecular mechanism of the active ingredient 5-hydroxy-3,7,4′-trimethoxyflavone (THF) against neuroinflammation was validated by molecular docking and in vitro experiments. In conclusion, this study established the structure–activity relationships of the active components of CN anti-NI and provided new insights into the pharmacological mechanisms of CN anti-NI at an integrative level.
1. Introduction
Alzheimer's disease (AD) is a progressive neurodegenerative disease that is the main cause of the progression of dementia.1 As the disease progresses, AD patients experience a variety of symptoms, beginning with impaired speech and memory, leading to a vegetative state and eventual death.2 Currently, about 50 million people worldwide suffer from dementia,3 most of whom are affected by AD.4 And the number of people with dementia in various stages is still increasing rapidly, making it a major public health problem around the world and a huge social and economic burden for patients and their families.5 AD is mainly characterized by senile macules or Aβ spots resulting from abnormal changes in amyloid precursor protein (APP) and neurofibrillary tangles (NFTs) with hyperphosphorylated tau (P-tau).6,7 Now, these two hypotheses have been in-depth studies and are thought to be important targets for the treatment of AD. Ever, up until now, clinical trials modulating both pathological proteins by direct amyloid or tau immunotherapy have shown disappointing results. Abundant nitric oxide in the brain triggers oxidative damage to neurons and contributes to the activation of apoptosis.8 Hence, effective inhibition of neuroinflammation represents a critical strategy for the treatment of AD. Neuroinflammation is an immune response activated by microglia and astrocytes in the CNS, which leads to the emission of pro-inflammatory cytokines and chemokines.9 Microglia have a role in the CNS response with neuromodulatory, neurotrophic and neuroimmune roles. When the CNS is injured, microglia are activated and translocate to the site of injury, unleashing a host of pro-inflammatory, anti-inflammatory, and neurotoxic responses.10–12 Thus, suppressing microglia activation may be an effective strategy to combat neuroinflammation. Lipopolysaccharide (LPS), an inflammation-inducing endotoxin, is frequently utilized to boost microglia and build a useful in vitro model to research the mechanism of neuronal injury.13 Over recent years, several reports on LPS-activated microglia modeling neuroinflammation have been published.14,15 Nevertheless, the in vivo effectiveness of anti-neuroinflammatory and micro-glia-targeting drugs remains undefined.16 It is therefore imperative to search for a new drug with few or no side affects.17Traditional Chinese medicine (TCM) has a multi-target and multi-component history of preventative and curative treatment of different disorders for thousands of years18 and performed an outstanding effect. TCM is often considered to be an easily accessible, inexpensive, and less harmful manner of therapeutics. Traditional Chinese herbal medicine can be an effective alternative treatment tactic for a wide range of multifactorial and complex chronic diseases, of which AD is one.19 For this reason, the search for herbal remedies for NI has become a hot spot in modern pharmacological research. CN is a member of the Verbenaceae family, widely scattered in South China.20 CN has tremendous anti-inflammatory properties. Crude extracts and extracted fractions of CN have been reported to be found to have good anti-inflammatory activity.20,21 In addition, Sun et al. found that nine previously undescribed Seco-labdane diterpenoids isolated from the leaves of CN exhibited significant inhibition of nitric oxide (NO) production in LPS-induced mouse microglial BV2 cells.22 Although studies have documented the biological activity of CN as an anti-inflammatory agent, reports on the molecular mechanisms of the anti-inflammatory effects of CN remain scarce due to the complexity of its chemical composition. However, efforts are necessary to elucidate the molecular mechanisms by which CN regulates microglia activation in the context of AD.
Network pharmacology is a research approach developed based on systems biology and multifaceted pharmacology.23 It shows a high degree of congruence with the holistic dynamic approach and multi-component, multi-target, and multi-pathway interactions of TCM in the treatment of disorders.24 The network pharmacology approach can be an effective way to identify the critical role of herbal medicine in the treatment of diseases.25 This approach reflects the complex and diverse relationships among drugs, targets, diseases, and signaling pathways in the form of a network, thereby demonstrating the workings of various active ingredients, helping us to better understand the effects of drugs and facilitating the development of new drugs. Pharmacophore modeling is a widely applicable and effective method for the discovery of new active compounds. It is based on the common characteristics of molecules and is studied by using mathematical and statistical methods and reveals a series of ligand molecules that are shared by chemical characteristics, and based on the structure of these standard features than composite pharmacophore model of automatic generation, thus further compounds to search the database to find possible precursor molecules and explore the structure–activity relationships of a series of molecules with similar activity but different structures.26 In a nutshell, molecular docking can predict the affinity of the ligand by calculating the interaction between the ligand and the protein, illustrating the mechanism of interaction between the two at the molecular level.27
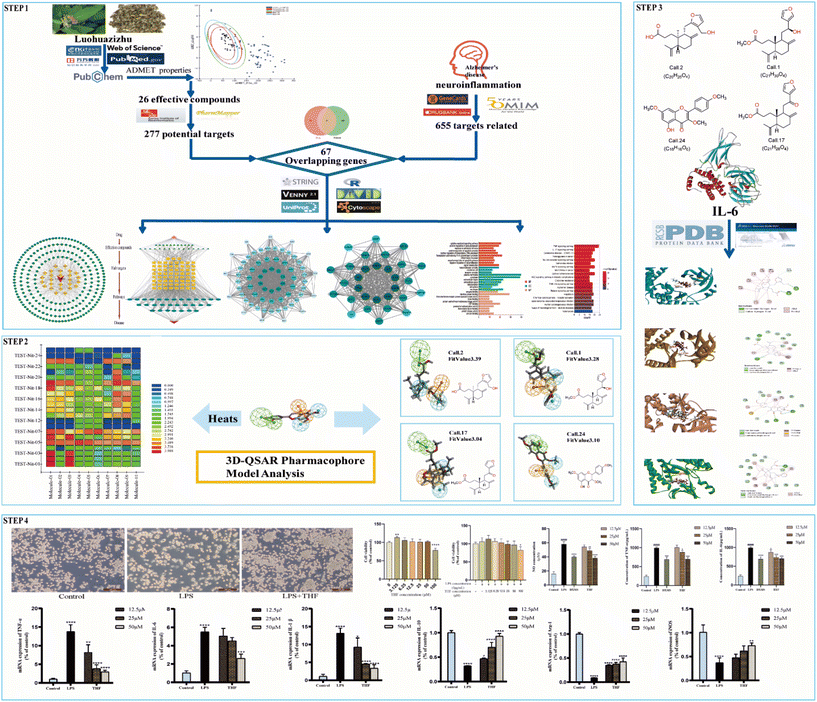
The purpose of this effort was to identify the molecular mechanism of action of the anti-neuritis activity of CN. We used network pharmacology to analyze the compound–target interactions and relevant signaling pathways of CN. And then, a 3D-QSAR pharmacophore model based on molecular co-features was built using the HipHop method to anticipate the common structural characterization of the active components in CN against NI. Finally, molecular docking showed that these compounds docked tightly with the predicted target proteins. We further established a NI model of LPS-induced BV2 microglia to evaluate the anti-NI effect of CN, which provides a basis for the rational use and in-depth development of new drugs. This workflow is shown in Fig. 1.
2. Materials and methods
2.1. Network pharmacology
Known disease targets were located and filtered by the keywords “neuroinflammation” by using GeneCardsdatabase (https://www.genecards.org/),33 OMIM database (https://omim.org/),34 and DrugBank database (https://www.drugbank.ca/).35 Afterward, all results were then consolidated and intersecting targets were excluded.
2.2. Construction of the 3D-QSAR pharmacophore model
2.3. Molecular docking
2.4. Experimental verification in vitro
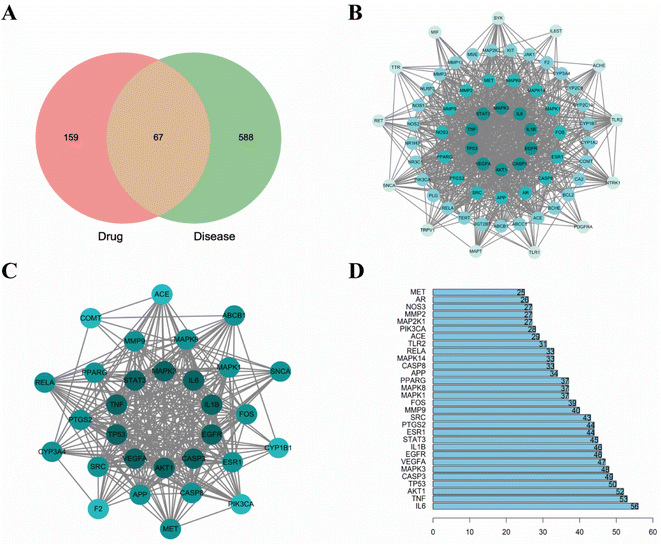
| No. | Gene | No. | Gene | No. | Gene | No. | Gene | No. | Gene |
|---|---|---|---|---|---|---|---|---|---|
| 1 | UGT2B7 | 15 | ACE | 29 | IL6 | 43 | EGFR | 57 | MAP2K1 |
| 2 | AR | 16 | F2 | 30 | PTGS2 | 44 | TRPV1 | 58 | SNCA |
| 3 | NR1H3 | 17 | NOS3 | 31 | STAT3 | 45 | ACHE | 59 | CASP8 |
| 4 | MME | 18 | NOS2 | 32 | CYP1B1 | 46 | BCL2 | 60 | FOS |
| 5 | ESR1 | 19 | KIT | 33 | PLG | 47 | RET | 61 | MET |
| 6 | NR3C1 | 20 | CA2 | 34 | ABCC1 | 48 | SKY | 62 | TLR2 |
| 7 | TP53 | 21 | NOS1 | 35 | AKT1 | 49 | MAPT | 63 | NLRP3 |
| 8 | IL1B | 22 | IL6ST | 36 | VEGFA | 50 | SRC | 64 | MAPK1 |
| 9 | MIF | 23 | PPARG | 37 | CASP3 | 51 | CYP2C19 | 65 | MAPK14 |
| 10 | MMP3 | 24 | JAK1 | 38 | TTR | 52 | CYP3A4 | 66 | MAPK3 |
| 11 | MMP13 | 25 | TLR1 | 39 | ABCB1 | 53 | CYP2C9 | 67 | NTRK1 |
| 12 | MMP9 | 26 | COMT | 40 | PIK3CA | 54 | CYP1A2 | ||
| 13 | MMP2 | 27 | APP | 41 | RELA | 55 | BCHE | ||
| 14 | MAPK8 | 28 | TNF | 42 | TERT | 56 | PDGFRA |
3. Results
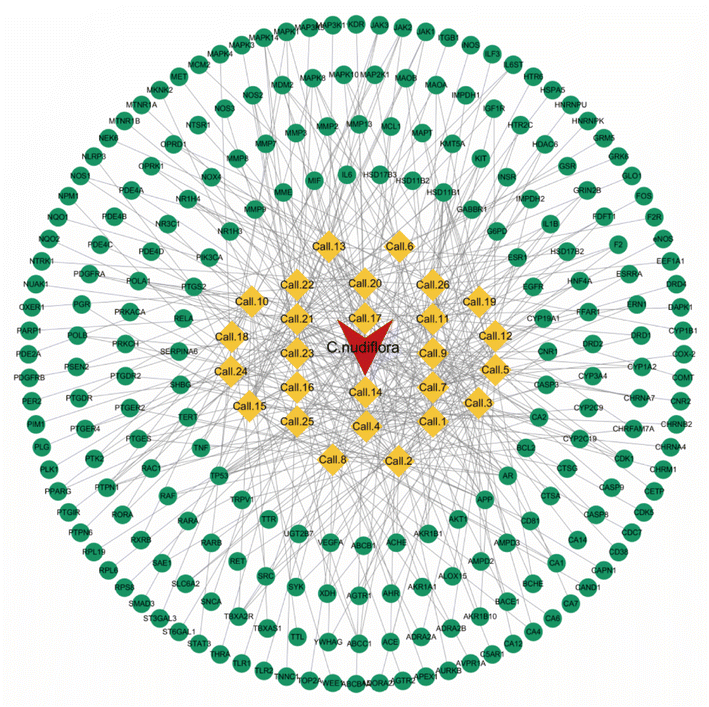
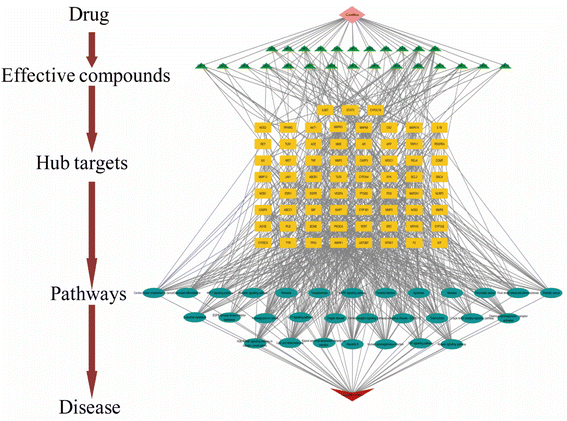
3.1. Network pharmacology analysis
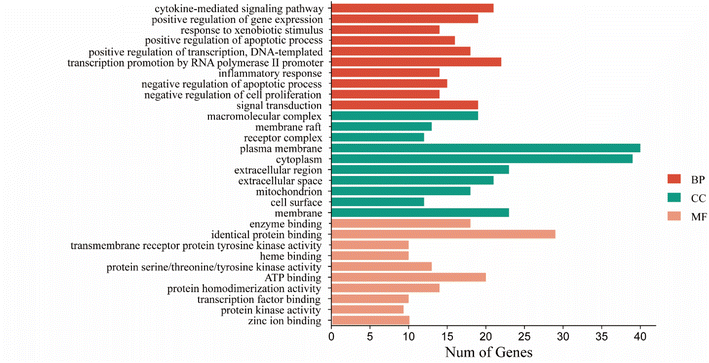 | ||
| Fig. 4 CN annotation of GO functions for NI. The bar chart shows the top 10 GO enrichment items for BP, CC, and MF. | ||
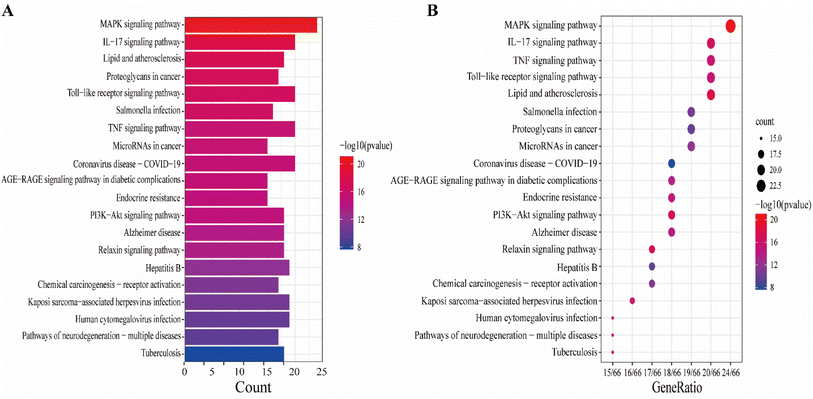
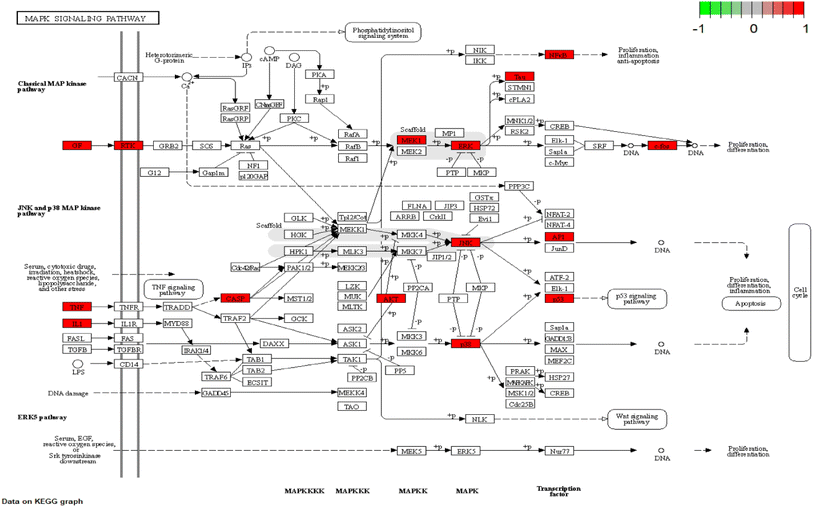
The KEGG pathway enrichment analysis yielded as many as 161 pathways, and the top 20 pathways were displayed for graphical visualization. The data were ranked per their p-values and then converted into histograms and bubble plots for presentation, respectively (Fig. 5A and B). The results showed that the common signaling pathways were mainly focused on the MAPK signaling pathway (hsa04010), IL-17 signaling pathway (hsa04657), lipid and atherosclerotic signaling pathway (hsa05417), Toll-like receptor signaling pathway (hsa04620), and TNF signaling pathway (hsa04668). This suggests that the active components of CN may exert anti-NI effects by participating in various bioregulatory processes.
3.2. 3D-QSAR pharmacophore model analysis
Although the network pharmacology screening successfully anticipated important active components of CN for the treatment of NI and the core anti-NI target of CN, interleukin-6. However, to further elucidate the common structural features of the key active ingredients predicted by network pharmacology in the treatment of neuroinflammatory disorders. In this section, a pharmacophore model based on common molecular features was constructed to further explore the structural commonality of active compounds in CN anti-NI, using the key target interleukin-6 as the active study target. It provides a basis for elucidating the material basis of CN anti-NI, expanding the scope of Chinese medicine research, and enriching the theory of Chinese medicine.| Pharmacophore | Feature | Rank | Direct Hit | Partial Hit | Max Hit |
|---|---|---|---|---|---|
| 01 | HHHA | 109.898 | 11111111111110 | 00000000000001 | 4 |
| 02 | HHHA | 109.617 | 11111111111110 | 00000000000001 | 4 |
| 03 | HHHA | 107.512 | 11111111111110 | 00000000000001 | 4 |
| 04 | RHHA | 107.175 | 11111111111110 | 00000000000001 | 4 |
| 05 | RHHA | 104.751 | 11111111111110 | 00000000000001 | 4 |
| 06 | RHHA | 104.386 | 11111111111110 | 00000000000001 | 4 |
| 07 | HHHA | 103.734 | 11111111111110 | 00000000000001 | 4 |
| 08 | HHHA | 103.709 | 11111111111110 | 00000000000001 | 4 |
| 09 | HHHA | 103.257 | 11111111111110 | 00000000000001 | 4 |
| 10 | RHHA | 102.531 | 11111111111110 | 00000000000001 | 4 |
| Gene | 5′ to 3′ | |
|---|---|---|
| TNF-a | Forward | ATGGCCTCCCTCTCATCAGT |
| Reverse | TTTGCTACGACGTGGGCTAC | |
| IL-6 | Forward | CTCCCAACAGACCTGTCTATAC |
| Reverse | CCATTGCACAACTCTTTTCTCA | |
| IL-10 | Forward | ACATACTGCTAACCGATCCTT |
| Reverse | GCTCCACTGCCTTGCTCTT | |
| Arg-1 | Forward | ATGCTCACACTGACATCAACAC |
| Reverse | CTTCCATCACCTTGCCAATCC | |
| IL-4 | Forward | GCTAGTTGTCATCCTGCTCTTC |
| Reverse | GGTGTTCTTCGTTGCTGTGA | |
| iNOS | Forward | ACTACTGCTGGTGGTGACAA |
| Reverse | CCTGAAGGTGTGGTTGAGTTC | |
| β-actin | Forward | AAGTGTGACGTTGACATCCG |
| Reverse | TCTGCATCCTGTCAGCAATG |
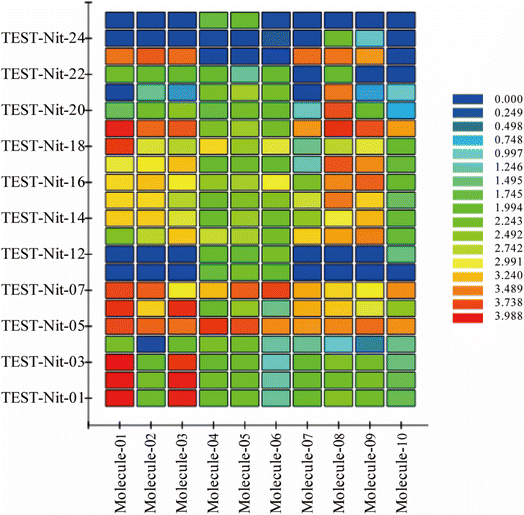
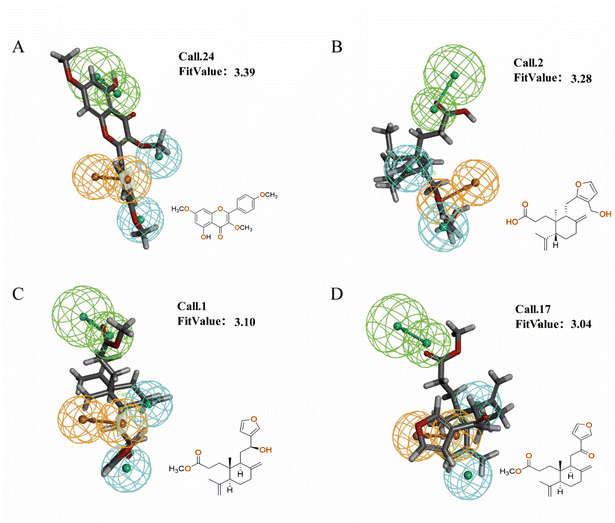
To validate the validity of the pharmacophore model constructed by HipHop, we need to verify whether the pharmacophore has a good ability to distinguish between active and inactive molecules by using the training set of known compounds with activity. Fig. 9 shows the heat map of the ten 3D-QSAR pharmacophore models used to predict the training set compounds. ESI Table 3† shows the corresponding fits. The closer the fit value is to 4, the better the compound fits the model; the closer the fit value is to 0, the lower the compound fits the model. As shown in Fig. 9, the FitValue values of the compounds with higher activity in “Pharmacophore 01” were higher than those with lower activity in “Pharmacophore 01”. This result indicates that “Pharmacophore 01” is the best 3D-QSAR pharmacophore model to predict the activity of CN compounds. The pharmacophore model may be the decisive therapeutic pharmacophore for CN anti-NI.
In summary, network pharmacology was used to successfully screen for highly active compounds for CN anti-NI. Then, a HipHop approach was used to construct a pharmacophore model predicting the common molecular structure-based features possessed by CN active molecules in the treatment of neuroinflammation. Finally, the validity of the 3D-QSAR pharmacophore was verified by a training set of compounds with known activity, and the possible decisive therapeutic effect of “pharmacophore 01” was postulated. Therefore, we will validate it by molecular docking and in vitro experiments to further explore the molecular mechanism of CN anti-NI.
3.3. Molecular docking results
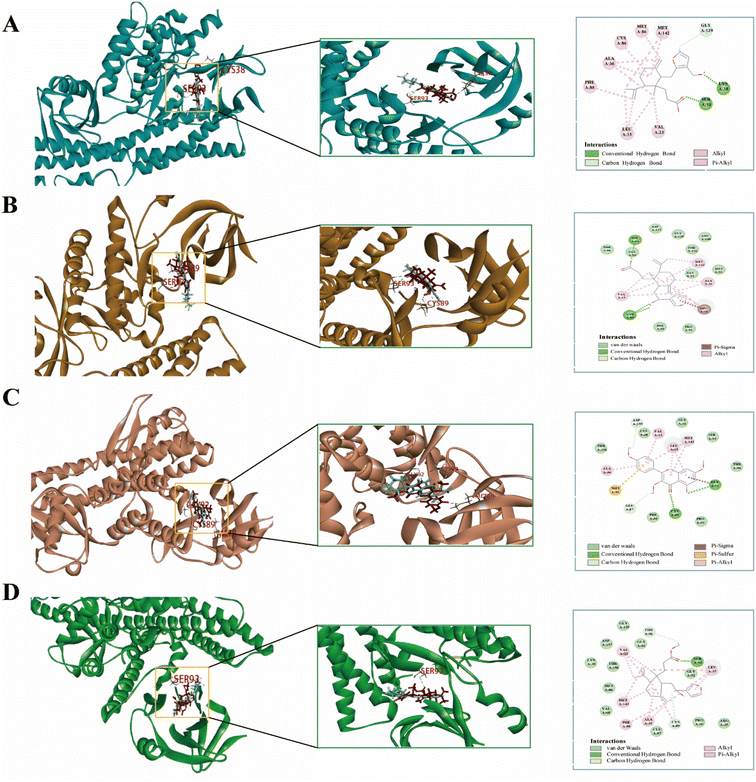
In molecular docking, the ligand is bound to one or more amino acid residues through hydrogen bonds in the active pocket, participating in the process of conformational change and energy complementation.42 The binding site, binding fraction, and RMSD value can visualize the interaction and stability of the docking model. Here, we constructed protein receptors based on IL-6, the core target of PPI. Based on the 3D-QSAR pharmacophore model, four highly active compounds were screened from CN for molecular docking. Before performing molecular docking of CN components, we first verified the reliability of the molecular docking process. Since the crystal structure of the IL-6 (6CQ5) target protein contains the original ligand of F8S. We extracted the ligand molecules from the complex and then docked them into the binding pocket of the complex using LibDock. The root-mean-square deviation (RMSD) of the docked ligand from the ligand conformation in the original crystal structure was calculated to be 1.41428, which is less than 2. 0, indicating that this docking process has good accuracy for this target. Subsequently, we used ent 3,4-seco-16-hydroxy-12,15-epoxy-4(18),8(17),12,14-labdatetraen-3-oic acid, nudiflflopenes C, 5-hydroxy-3,7,4′-trimethoxyflavone, nudiflflopenes M four active ingredients as ligands and key target proteins as receptors for molecular docking. The docking results are shown in ESI Table 4.† The docking results showed that the docking scores of the four active compounds to the core target IL-6 were greater than 90, indicating relatively stable binding between the ligand and the receptor (Fig. 11).Fig. 11 shows the binding pattern of the IL-6 target protein to its corresponding original ligand and the four CN active compounds mentioned above. A high similarity was observed between the active compounds and the original ligands of the proteins, which occupy almost the same active site. The binding pattern of ent 3,4-seco-16-hydroxy-12,15-epoxy-4(18),8(17),12,14-labdatetraen-3-oic acid at the IL-6 active site is shown in Fig. 11A in three- and two-dimensional modes, respectively. Two amino acid residues formed hydrogen bond interactions with ent3,4-seco-16-hydroxy-12,15-epoxy-4(18),8(17),12,14-labdatetraen-3-oic acid, and the phenolic hydroxyl group on this compound was attached to Ser93 and Lys38 residues via two hydrogen bonds, respectively. Fig. 11B shows the mode of binding of nudiflflopenes C to the IL-6 active site. The molecule is located in the binding capsule surrounded by residues Gys89 and Ser93. The binding pattern between 5-hydroxy-3,7,4′-trimethoxyflavone and IL-6 is shown in Fig. 8C. The residues of Cys89 and Gly92 form stable hydrogen bond interactions with the carbonyl group in 5-hydroxy-3,7,4′-trimethoxyflavone and the hydroxyl group on the benzene ring, respectively. Fig. 11D shows the binding pattern between nudiflflopenes M and IL-6, forming a hydrogen bond to the carbonyl group with the Ser93 residue in IL-6.
Taken together, these docking results provide evidence that the active compound of CN can bind stably to the active pocket of the receptor protein, forming a stable binding conformation.
3.4. Experimental verification in vitro
4. Discussion
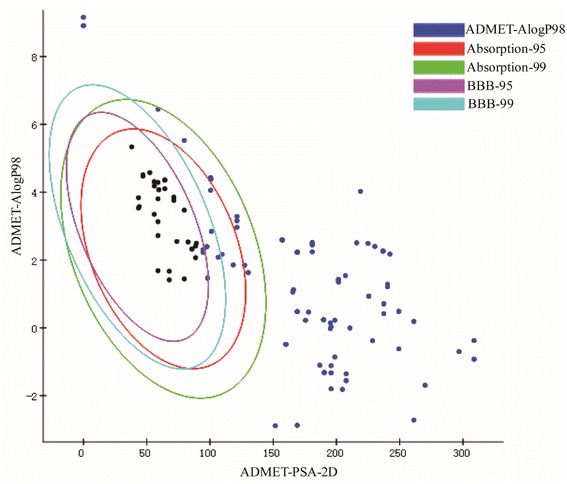
Neuroinflammation is a reaction involving all cells in the Central Nervous System (CNS), contains neurons, glial cells, etc., and specifically refers to inflammation occurring in brain tissue. When pathogens invade brain tissue, they activate various genes and proteins to produce proinflammatory factors and cytotoxic factors, for example, inducible Nitric Oxide Synthase (iNOS), interleukin-1β (IL-1β), interleukin-6 (IL-6), tumor necrosis factor-α (TNF-α), cyclooxygenase-1 (Cox-1) and cyclooxygenase-2 (COX-2).43–46 When these cytokines are overproduced, the toxicity expands, causing nerve cell damage and death, leading to long-term neurodegeneration. In recent decades, there have been many studies on neuroinflammation and some results have been achieved. But no better drugs or measures have been developed. In recent years, the potential neuroprotective effects of the main active components of herbal extracts in various neurological disorders have been extensively investigated.47,48 Numerous studies have shown that CN is one of the herbal medicines with anti-inflammatory, neuroprotective, antithrombotic, analgesic, and antioxidant activities.49,50 In this study, we screened the key active ingredients and targets of CN anti-NI by network pharmacology. Through literature search and ADMET screening, 26 compounds were confirmed to have good blood–brain barrier permeability and intestinal absorption, which further provided a basis for the theoretical drug-like ability of the drugs. Then, the optimal 3D-QSAR pharmacophore model for predicting key active ingredients was developed, four highly active compounds were successfully screened, and the standard structural features shared by the active molecules in the treatment of neuroinflammation were further analyzed. Finally, we established a model of LPS-induced neuroinflammation in BV2 microglia to further explore the potential mechanism of action of CN anti-NI.Combined with network pharmacology analysis, we revealed that CN acts on multiple targets through multiple signaling pathways, mainly IL-6, TNF, AKT1, and TP53, which may play a key role in the occurrence and development of neuroinflammation. Promoting inflammatory cytokines, the likes of IL-1β, TNF-α, and IL-6, have multiple functions in neurodegeneration and protection. It has been previously demonstrated that IL-6 and TNF-α are overexpressed in activated microglia and lead to neurodegeneration.51 Each of these acute phase response proteins is contributing to the progression as well as to the resolution of both acute and chronic inflammation.52 IL-6 is a polymorphic cytokine produced mainly by microglia and astrocytes in various brain regions. It protects the function of the central nervous system by promoting the survival and regeneration of neurons. Besides IL-6 secretion, astrocytes positively regulate microglia at multiple levels during inflammatory damage and recovery.53 AKT, also known as PKB (protein kinase B), is a serine/threonine kinase that comes in three subtypes. Different AKT subtypes have different effects on nerve cell inflammation, and AKT1 is the most widely expressed subtype in the brain.54 Studies have shown that Akt1 deficiency promotes the classical activation of macrophages and enhances phagocytosis.55 P53 has long been considered a key transcription factor.56 TP53 induced glycolysis and apoptosis regulator (TIGAR) is an important p53 target, it has a critical role in the balancing between glycolysis and redox.57 TIGAR is broadly located in neurons and has a critical role in the CNS. These discoveries are consistent with our results that IL-6, TNF, AKT1, and TPT3 are extremely vital and may be engaged in the CN anti-NI process.
To explain the functions and related pathways of 277 protein targets, further, GO enrichment analysis and KEGG pathway enrichment analysis were performed. The GO results showed that the target genes were mainly concentrated in membrane microregions and biological functions such as protein tyrosine kinase activity and monooxygenase activity. KEGG data showed that the MAPK signaling pathway is the most abundant number of genes among NI-related signaling pathways and is the most critical signaling pathway in NI treatment. IL-6, as a key node in the MAPK signaling pathway, is involved in the process of NI occurrence and development. MAPK signaling pathway is an important cell signaling pathway that plays an important role in mediating various processes such as cell proliferation, apoptosis, necrosis, and inflammation. MAPK signaling pathway consists of extracellular signal-regulated protein kinase (ERK), Jun-N-terminal Kinase (JNK), and P38. MAPK is considered to be an important signaling pathway in the inflammatory process mimicked by LPS. It has been shown that the p38MAPK protein is a key target of this signaling pathway.58 It has been shown that the p38MAPK receptor initiates the release of inflammatory cytokines (IL-6, TNF-α and NO), so inhibition of P38MAPK phosphorylation inhibits the release of inflammatory cytokines and other cytotoxic factors from microglia and reduces neuroinflammation.59 These findings are consistent with our view that the MAPK signaling pathway is the most important CN–NI signaling pathway and may be involved in the anti-NI mechanism of CN.
In addition, the best pharmacophore model for CN anti-NI could be found from the 3D-QSAR pharmacophore model results, which consisted of an aromatic ring group, two hydrophobic groups, and a hydrogen bond acceptor group. Meanwhile, the flavonoid component 5-hydroxy-3,7,4′-trimethoxyflavone (THF) was screened for its good anti-inflammatory activity. Therefore, we further analyzed the relationship between the two from the perspective of the structure–activity relationship. Studies have shown that the hydrophobic groups of flavonoids play an important role in the anti-inflammatory properties. In these compounds, hydrophobic substituents, such as amyl, alkyl chains, and oxygen-containing heterocyclic parts, usually enhance the anti-inflammatory activity of flavonoids.60 O-methylation is commonly used in the synthesis of plant and microbial secondary metabolites, by which the methyl group replaces the hydroxyl group of the receptor compound to increase the hydrophobicity of the latter molecule thereby enhancing the activity.61,62 Tewtrakul et al. investigated the inhibitory activity of compounds isolated from the rhizomes of Kaempferia parviflora Wall on nitric oxide (NO) production. The results showed that 5-hydroxy-3,7,3′,4′-tetramethoxy flavonoid expressed the highest NO inhibitory activity with an IC50 of 16.1 mM, followed by 5-hydroxy-7,4′-dimethoxyflavin (IC50 = 24.5 mM) and 5-hydroxy-3,1,7′-trimethoxy flavonoids (IC50 = 30.6 mM), while the other compounds exhibited moderate to weak inhibitory activity. In addition, the anti-inflammatory activity exhibited by flavonoids is partly related to their inherent antioxidant capacity.63 The scavenging ability of flavonoids is due to the presence of a double bond between carbon 2 and carbon 3 in the C ring of the flavonoid backbone. The C-ring 2 and 3 double bonds in the parent nucleus structure of natural flavonoids may be important in inhibiting microglia activation, and the strength of their inhibitory effect depends on the type of substitution of the molecule. Methylation of 3-hydroxyl groups also exhibits a higher inhibitory effect on NO production, e.g., rhamnolins < lzalpinin, ombuine < ayanin.64 These studies further support our prediction by the 3D-QSAR pharmacophore model.
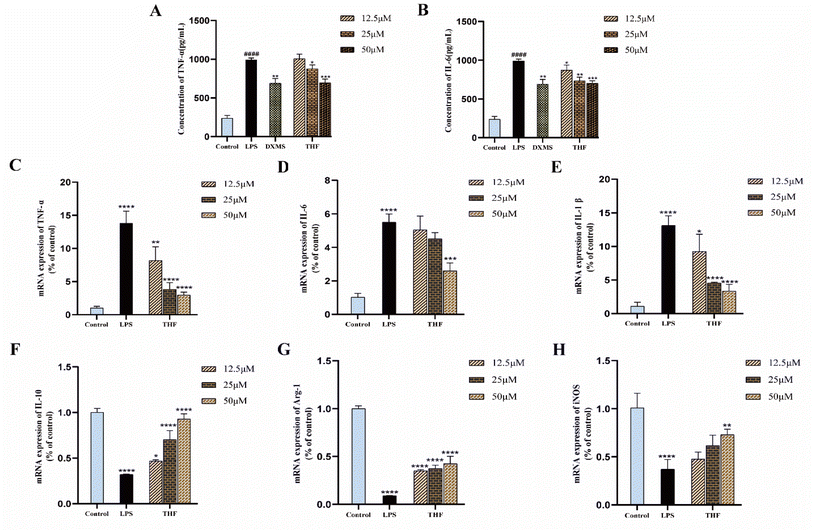
Based on the 3D-QSAR results, we performed molecular docking to further validate the predicted results. The docking results showed that ent 3,4-seco-16-hydroxy-12,15-epoxy-4(18),8(17),12,14-labdatetraen-3-oic acid, nudiflflopenes C, 5-hydroxy-3,7,4′-trimethoxyflavone and nudiflflopenes M bound well to IL-6, respectively, with 5-hydroxy-3,7,4′-trimethoxyflavone having the highest docking score with IL-6, indicating the most stable binding. Based on the results of the above analysis, we constructed a model of LPS-induced neuroinflammation in BV2 microglia for in vitro experimental evaluation. Experimental validation showed that THF, an important active component of CN, effectively inhibited the inflammatory response of BV2 microglia, suppressed the expression of TNF-α and IL-6 mRNA, and shifted the phenotype of LPS-stimulated BV2 cells from M1 to M2 polarization, thereby treating neuroinflammation. However, the present study has several limitations according to the corresponding guidelines.65 First, we constructed pharmacological models based on common characteristics of the molecules to find possible lead molecules. However, screening for compounds with clear activity values remains our endeavor. Therefore, the study about searching more pharmacophore features by 26 active ligand small molecules is still imperfect and needs to be further developed. However, in future studies, we will construct a receptor structure-based pharmacological model (SBP) to maximize the use of known receptor structures and drug receptor information to effectively overcome the de-criticalization of existing drug design tools and accelerate the prediction and development of new drugs faster.
5. Conclusions
In conclusion, this study provides a systematic and intuitive overview of the possible molecular mechanisms and signaling pathways of how CN exerts its anti-NI effects. Meanwhile, a 3D-QSAR pharmacophore model based on molecular common features was constructed to predict 5-hydroxy-3,7,4′-trimethoxyflavone (THF) as a good candidate for the treatment of NI. Consistent with the prediction results, the experimental results also demonstrated that the prediction based on the network pharmacology approach and pharmacophore model was accurate and credible, and the relationship between them was further analyzed from the perspective of the structure–activity relationship.Author contributions
Conceptualization and methodology, G. Y. and Y. L.; software and visualization, J. C. and Y. L.; validation, data curation, and formal analysis, G. Y. and Y. M.; investigation, Y. L., and Y. M.; writing—original draft preparation, G. Y. and Y. L.; supervision, project administration, and writing—review and editing, J. C. All authors have read and agreed to the published version of the manuscript.Conflicts of interest
The authors declare no conflict of interest.Acknowledgements
This study was conducted with the support of a research grant from Jiangzhong Pharmaceutical Co. Ltd.References
- P. Liu, Y.-Y. Wang, Y. Sun and G.-P. Peng, Clin. Interventions Aging, 2022, 17, 665–674 CrossRef.
- Alzheimer's Association, Alzheimer's Dement., 2019, 15, 321–387 CrossRef.
- G. Pottiez, L. Yang, T. Stewart, N. Song, P. Aro, D. R. Galasko, J. F. Quinn, E. R. Peskind, M. Shi and J. Zhang, J. Proteome Res., 2017, 16, 1228–1238 CrossRef CAS.
- B. R. Wang, Z. Ou, X. H. Gu, C. S. Wei, J. Xu and J. Q. Shi, Int. J. Geriatr. Psychiatr., 2017, 32, e173–e179 CrossRef PubMed.
- L. Rizzi, I. Rossetand and M. Roriz-Cruz, Biomed Res. Int., 2014, 2014, 908915 Search PubMed.
- A. Videnovic, A. S. Lazar, R. A. Barker and S. Overeem, Nat. Rev. Neurol., 2014, 10, 683–693 CrossRef.
- L. M. Ittner and J. Götz, Nat. Rev. Neurosci., 2011, 12, 67–72 CrossRef PubMed.
- T. Wei, C. Chen, J. Hou, W. Xin and A. Mori, Biochim. Biophys. Acta, Mol. Cell Res., 2000, 1498, 72–79 CrossRef CAS.
- R.-R. Ji, A. Nackley, Y. Huh, N. Terrando and W. Maixner, Anesthesiology, 2018, 129, 343–366 CrossRef PubMed.
- J. K. Olson and S. D. Miller, J. Immunol., 2004, 173, 3916–3924 CrossRef CAS.
- M. L. Block and J.-S. Hong, Prog. Neurobiol., 2005, 76, 77–98 CrossRef CAS.
- R. J. Horvath, N. Nutile-McMenemy, M. S. Alkaitis and J. A. Deleo, J. Neurochem., 2008, 107, 557–569 CrossRef CAS PubMed.
- H. Y. Park, G.-Y. Kim and Y. H. Choi, Int. J. Mol. Med., 2012, 30, 204–210 CAS.
- K. W. Lee, S. Y. Jung, S. M. Choi and E. J. Yang, BMC Complementary Altern. Med., 2012, 12, 196 CrossRef CAS.
- J. Xu, C. Yuan, G. Wang, J. Luo, H. Ma, L. Xu, Y. Mu, Y. Li, N. P. Seeram, X. Huang and L. Li, J. Agric. Food Chem., 2018, 66, 3571–3580 Search PubMed.
- W. Y. Fu, X. Wang and N. Y. Ip, ACS Chem. Neurosci., 2019, 10, 872–879 CrossRef CAS PubMed.
- X. Jin, M. Liu, D. Zhang, X. Zhong, K. Du, P. Qian, W. Yao, H. Gao and M. Wei, CNS Neurosci. Ther., 2019, 25, 575–590 CrossRef CAS.
- S. Tabassum, H. R. Khalid, W. U. Haq, S. Aslam, A. Alharbi, M. Alshammari, M. S. Riaz Rajoka, M. Khurshid and U. A. Ashfaq, Processes, 2022, 10, 298 CrossRef CAS.
- L. Li, L. Zhang and C. Yang, Curr. Top. Med. Chem., 2016, 16, 537–548 CrossRef CAS PubMed.
- L. Dong, X. P. Zhang, M. S. Liu, Y. M. Li, J. H. Wang and Y. Wang, J. Asian Nat. Prod. Res., 2013, 15, 30–34 CrossRef CAS PubMed.
- Y. M. Li, Y. F. Yang, X. D. Kang, X. F. Li, Y. Z. Wu, J. P. Xiao, Y. Ye, J. Q. Yang, Y. Yang and H. Liu, Front. Pharmacol., 2022, 12, 806808 CrossRef PubMed.
- X. Sun, F. Liu, X. Yang, J. Wang, B. Dong, C. Xie, D.-Q. Jin, J. Zhang, D. Lee, Y. Ohizumi, J. Xu and Y. Guo, Phytochemistry, 2018, 149, 31–41 CrossRef CAS PubMed.
- Z. Zhai, X. Tao, M. M. Alami, S. Shu and X. Wang, Curr. Issues Mol. Biol., 2021, 43, 65–78 CrossRef PubMed.
- Z. Ding, F. Xu, Q. Sun, B. Li, N. Liang, J. Chen and S. Yu, J. Evidence-Based Complementary Altern. Med., 2021, 2126967 Search PubMed.
- Y. Qian, X. Sun, X. Wang, X. Yang, M. Fan, J. Zhong, Z. Pei and J. Guo, J. Diabetes Res., 2021, 5477941 CAS.
- S. Y. Yang, Drug Discovery Today, 2010, 15, 444–450 CrossRef CAS PubMed.
- L. Pinzi and G. Rastelli, Int. J. Mol. Sci., 2019, 20, 4331 CrossRef CAS PubMed.
- S. Kim, P. A. Thiessen, E. E. Bolton, J. Chen, G. Fu, A. Gindulyte, L. Han, J. He, S. He, B. A. Shoemaker, J. Wang, B. Yu, J. Zhang and S. H. Bryant, Nucleic Acids Res., 2016, 44, D1202–D1213 CrossRef CAS PubMed.
- D. A. Evans, Angew. Chem., Int. Ed. Engl., 2014, 53, 11140–11145 CrossRef CAS PubMed.
- X. Wang, Y. Shen, S. Wang, S. Li, W. Zhang, X. Liu, L. Lai, J. Pei and H. Li, Nucleic Acids Res., 2017, 45, W356–W360 CrossRef CAS PubMed.
- C. The UniProt, Nucleic Acids Res., 2021, 49, D480–D489 CrossRef PubMed.
- D. Gfeller, A. Grosdidier, M. Wirth, A. Daina, O. Michielin and V. Zoete, Nucleic Acids Res., 2014, 42, W32–W38 CrossRef CAS.
- M. Rebhan, V. Chalifa-Caspi, J. Prilusky and D. Lancet, Trends Genet., 1997, 13, 163 CrossRef CAS.
- J. S. Amberger, C. A. Bocchini, F. Schiettecatte, A. F. Scott and A. Hamosh, Nucleic Acids Res., 2015, 43, D789–D798 CrossRef.
- D. S. Wishart, Y. D. Feunang, A. C. Guo, E. J. Lo, A. Marcu, J. R. Grant, T. Sajed, D. Johnson, C. Li, Z. Sayeeda, N. Assempour, I. Iynkkaran, Y. Liu, A. Maciejewski, N. Gale, A. Wilson, L. Chin, R. Cummings, D. Le, A. Pon, C. Knox and M. Wilson, Nucleic Acids Res., 2018, 46, D1074–d1082 CrossRef CAS PubMed.
- L. Sun, S. Dong, Y. Ge, J. P. Fonseca, Z. T. Robinson, K. S. Mysore and P. Mehta, Front. Genet., 2019, 10, 421 CrossRef CAS PubMed.
- D. Szklarczyk, A. L. Gable, D. Lyon, A. Junge, S. Wyder, J. Huerta-Cepas, M. Simonovic, N. T. Doncheva, J. H. Morris, P. Bork, L. J. Jensen and C. V. Mering, Nucleic Acids Res., 2019, 47, D607–d613 CrossRef CAS.
- Y. Tang, M. Li, J. Wang, Y. Pan and F.-X. Wu, Biosystems, 2015, 127, 67–72 CrossRef CAS PubMed.
- M. Kohl, S. Wiese and B. Warscheid, Methods Mol. Biol., 2011, 696, 291–303 CrossRef CAS.
- S. Kaur, Y. Bansal, R. Kumar and G. Bansal, Bioorg. Med. Chem., 2020, 28, 115327 CrossRef CAS.
- M. Kim, G. Kim, M. Kang, D. Ko, Y. Nam, C. S. Moon, H. M. Kang, J. S. Shin, O. Werz, K. T. Lee and J. Y. Lee, Bioorg. Med. Chem. Lett., 2021, 41, 127992 CrossRef CAS.
- S. Feng, T. Wang, L.-m. Fan, X.-x. An, X.-n. Ding, M.-j. Wang, X.-f. Zhai, Y.-j. Cao, J. He and Y. Li, RSC Adv., 2022, 12, 2181–2195 RSC.
- H. S. Kwon and H. Koh, Transl. Neurodegener., 2020, 9, 42 CrossRef.
- S. E. Park, K. Sapkota, S. Kim, H. Kim and S. J. Kim, Br. J. Pharmacol., 2011, 164, 1008–1025 CrossRef CAS PubMed.
- C. S. Subhramanyam, C. Wang, Q. Hu and S. T. Dheen, Semin. Cell Dev. Biol., 2019, 94, 112–120 CrossRef CAS PubMed.
- X. Wei, K. S. Cho, E. F. Thee, M. J. Jager and D. F. Chen, J. Neurosci. Res., 2019, 97, 70–76 CrossRef CAS.
- O. A. Olajide and S. D. Sarker, Inflammopharmacology, 2020, 28, 1439–1455 CrossRef.
- J. Zhang, Y. Zheng, Y. Luo, Y. Du, X. Zhang and J. Fu, Mol. Immunol., 2019, 116, 29–37 CrossRef CAS PubMed.
- K. A. Koo, S. H. Kim, T. H. Oh and Y. C. Kim, Life Sci., 2006, 79, 709–716 CrossRef CAS.
- Y. Tu, L. Sun, M. Guo and W. Chen, J. Ethnopharmacol., 2013, 146, 465–481 CrossRef CAS PubMed.
- M. Guo, J. Jin, D. Zhao, Z. Rong, L.-Q. Cao, A.-H. Li, X.-Y. Sun, L.-Y. Jia, Y.-D. Wang, L. Huang, Y.-H. Li, Z.-J. He, L. Li, R.-K. Ma, Y.-F. Lv, K.-K. Shao and H.-L. Cao, Front. Oncol., 2022, 12, 866154 CrossRef PubMed.
- M. N. Catorce and G. Gevorkian, Curr. Neuropharmacol., 2016, 14, 155–164 CrossRef CAS.
- L. Sun, Y. Li, X. Jia, Q. Wang, Y. Li, M. Hu, L. Tian, J. Yang, W. Xing, W. Zhang, J. Wang, H. Xu, L. Wang, D. Zhang and H. Ren, Oncotarget, 2017, 8, 40065–40078 CrossRef.
- H.-X. Xiao, B. Song, Q. Li, Y.-M. Shao, Y.-B. Zhang, X.-L. Chang and Z.-J. Zhou, Toxicol. Lett., 2022, 355, 116–126 CrossRef CAS PubMed.
- A. Arranz, C. Doxaki, E. Vergadi, Y. Martinez de la Torre, K. Vaporidi, E. D. Lagoudaki, E. Ieronymaki, A. Androulidaki, M. Venihaki, A. N. Margioris, E. N. Stathopoulos, P. N. Tsichlis and C. Tsatsanis, Proc. Natl. Acad. Sci. U. S. A., 2012, 109, 9517–9522 CrossRef CAS PubMed.
- W. Hu, S. Chen, R. F. Thorne and M. Wu, Adv. Exp. Med. Biol., 2019, 1206, 127–149 CrossRef CAS.
- S.-s. Huang, Y.-c. Sheng, Y.-y. Jiang, N. Liu, M.-m. Lin, J.-c. Wu, Z.-q. Liang, Z.-h. Qin and Y. Wang, Neurochem. Int., 2022, 152, 105244 CrossRef CAS.
- H.-J. Shim, S.-w. Park, J.-W. Lee, H.-J. Park, S.-H. Baek, E.-K. Kim and S.-W. Yu, Am. J. Chin. Med., 2016, 44, 119–132 CrossRef PubMed.
- C.-S. Yoon, D.-C. Kim, D.-S. Lee, K.-S. Kim, W.-m. Ko, J.-H. Sohn, J.-H. Yim, Y.-C. Kim and H.-c. Oh, Int. Immunopharmacol., 2014, 23, 568–574 CrossRef CAS.
- L. Chen, H. Teng, Z. Xie, H. Cao, W. S. Cheang, K. Skalicka-Woniak, M. I. Georgiev and J. Xiao, Crit. Rev. Food Sci. Nutr., 2018, 58, 513–527 CrossRef CAS.
- B. G. Kim, B. R. Jung, Y. Lee, H. G. Hur, Y. Lim and J. H. Ahn, J. Agric. Food Chem., 2006, 54, 823–828 CrossRef CAS PubMed.
- S. H. Kim, C. D. Jun, K. Suk, B. J. Choi, H. Lim, S. Park, S. H. Lee, H. Y. Shin, D. K. Kim and T. Y. Shin, Toxicol. Sci., 2006, 91, 123–131 CrossRef CAS.
- S. Tewtrakul, S. Subhadhirasakul, C. Karalai, C. Ponglimanont and S. Cheenpracha, Food Chem., 2009, 115, 534–538 CrossRef CAS.
- M. A. Soobrattee, V. S. Neergheen, A. Luximon-Ramma, O. I. Aruoma and T. Bahorun, Mutat. Res., 2005, 579, 200–213 CrossRef CAS PubMed.
- S. Li, World J. Tradit. Chin. Med., 2021, 7, 165–166 Search PubMed.
Footnote |
| † Electronic supplementary information (ESI) available. See DOI: https://doi.org/10.1039/d2ra05143e |
| This journal is © The Royal Society of Chemistry 2022 |

