
 Open Access Article
 This Open Access Article is licensed under a Creative Commons Attribution-Non Commercial 3.0 Unported Licence
Manipulation of Rashba splitting and thermoelectric performance of MTe (M = Ge, Sn, Pb) via Te off-centering distortion†
Tianyu Wangab,
Kaixiang Huab,
Xinlei Duanab,
Jingyi Zhangc,
Jia-Yue Yang *ab and
Linhua Liu*ab
*ab and
Linhua Liu*ab
aSchool of Energy and Power Engineering, Shandong University, Jinan, Shandong 250061, China. E-mail: jy_yang@sdu.edu.cn; liulinhua@sdu.edu.cn
bOptics & Thermal Radiation Research Center, Institute of Frontier and Interdisciplinary, Shandong University, Qingdao, 266237, China
cScience and Technology on Advanced Functional Composites Laboratory, Aerospace Research Institute of Materials and Processing Technology, Beijing 100076, China
First published on 20th September 2022
Abstract
The Rashba effect is an essential phenomenon in asymmetrical ferroelectric materials with local dipole fields. Rashba spin splitting due to spin–orbit coupling in the asymmetrical 2D ferroelectricity MTe (M = Ge, Sn, Pb) has provided a promising arena for achieving an ultra-high power factor to improve their thermoelectric performance. Herein, we show that the hidden Rashba effect may exist in centrosymmetric rock-salt MTe because of the emerging macroscopic electric dipoles caused by the local Te off-centering distortion. Using first-principles calculations, we prove that Te off-centering causes a change in the atomic reciprocal displacement and induces a ferroelectric Rashba effect in rock-salt MTe. Further analyses of the energy evaluation, lattice vibration and chemical orbital confirm that the atomic off-centering behavior manipulates Rashba spin splitting and stereochemical irregularities of the s2 lone electron pair of the cation, leading to the formation of strong anharmonic bonds in the original high-symmetry crystalline solids. The changes of the phonon dispersion and electronic structure also affect the electron–phonon scattering and scattering mechanism of MTe, which then manipulates the electrical transport properties. This work unravels the underlying physics on how the local Te off-centering distortion manipulates Rashba spin splitting and improves the thermoelectric performance of MTe.
1. Introduction
Thermoelectric (TE) materials allow for direct conversion between heat and electricity, thus being considered as a promising clean-energy technology.1,2 The dimensionless figure of merit (ZT) determining the TE performance has been defined as ZT = S2σT/(kel + klat),3 where S, σ, T, kel and klat denote the Seebeck coefficient, electrical conductivity, absolute temperature, and thermal transport contributions from the electrons and phonons, respectively.Lead telluride (PbTe) has been well-known among high-performance thermoelectric materials for its exceptional thermoelectric performance in the intermediate temperature range of 600–900 K.4–6 However, its poisonous lead-containing nature has prompted research into non-toxic counterparts. Classified as a Pb-free chalcogenide, GeTe and SnTe have been widely studied as promising mid-temperature thermoelectric candidates.7 Among the IV–VI semiconductor chalcogenides, GeTe, SnTe and PbTe possess the same rock salt structure (with the space group of Fm3m) and similar electronic band structure (valence band maximum (VBM) at the L point and VB2 at the Σ point).8–10 The intrinsic MTe (M = Ge, Sn, Pb) crystal normally has an improper high carrier concentration, leading to a rather low ZT. General strategies to improve ZT include either improving S2σ or decreasing klat. To obtain a high S2σ and ensure a low klat, numerous studies including the band structure,7,11,12 resonant state doping,13,14 intrinsic anharmonicity,15 point-defects,16,17 stacking faults,18 and nanoprecipitates19,20 are generally applied to modulate the transport of carriers and phonons.21,22
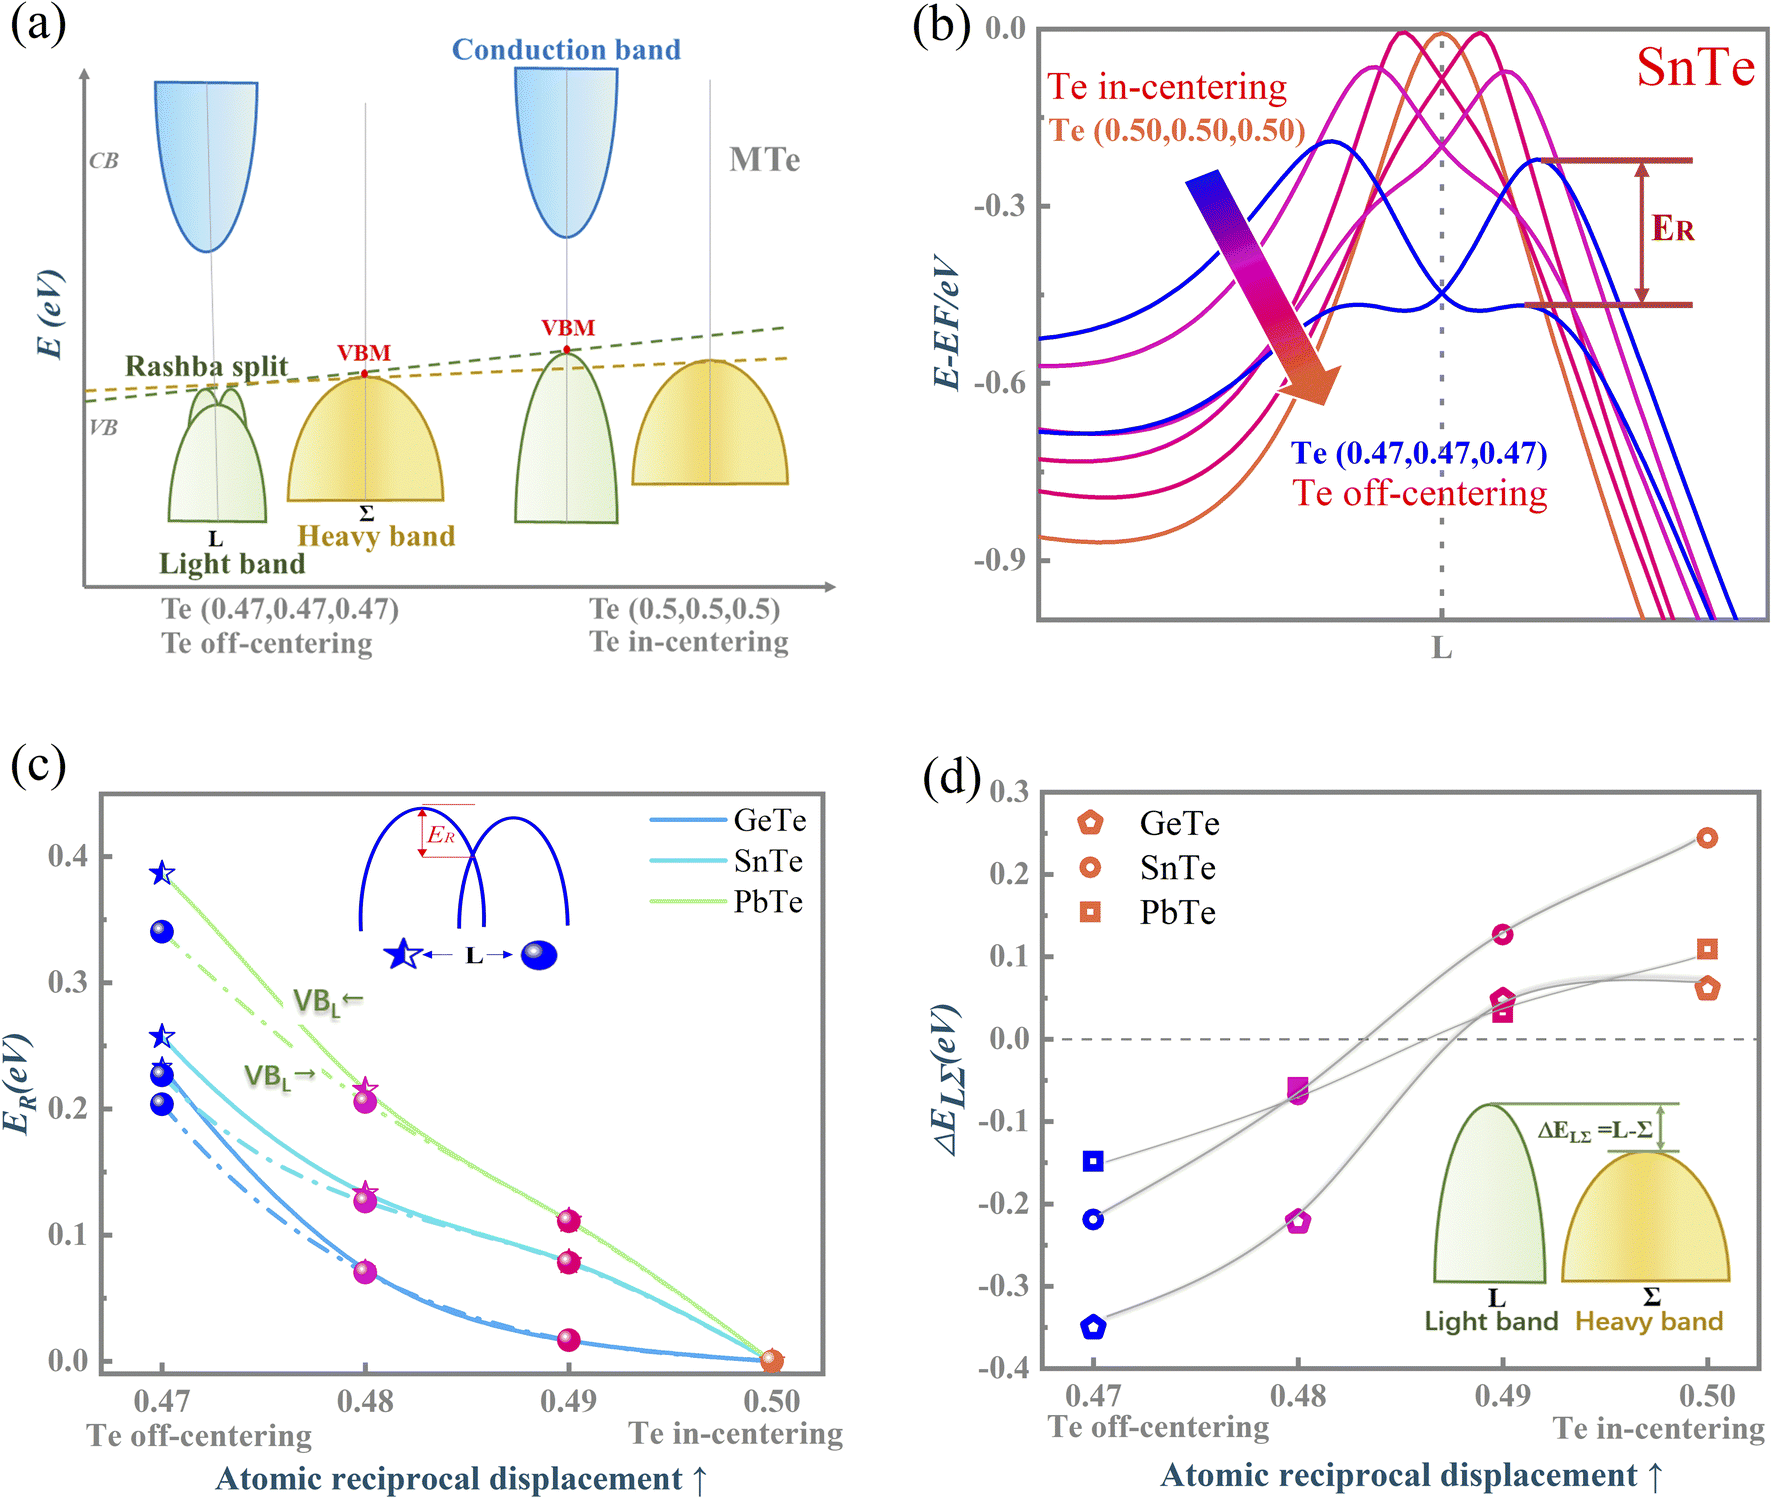
MTe comprises heavy metal elements exhibiting intrinsically significant spin–orbital coupling (SOC). In asymmetrical 2D ferroelectricity MTe, spin–orbit interaction reduces spin degeneracy and the Rashba effect emerges, leading to the initial single band edge split into two band extrema with momentum offset and energy shift.23 The Rashba effect has demonstrated the capacity to significantly manipulate the thermoelectric performance. Rashba spin splitting can introduce an apparent constant electronic density of states (DOS) located around the Fermi level. This leads to a high Seebeck coefficient, yields lower recombination rates and longer carrier lifetimes, induces soft resonant bonding, and reinforces anharmonicity, thus reducing klat.24 Most importantly, Rashba spin splitting can manipulate the band gap and energy inversion between the light L-band and heavy Σ-band through modifying the electronic states near the band gap.25
Yet, with the centrosymmetric rock salt structure, bulk MTe cannot exhibit a ferroelectric Rashba effect due to the loss of macroscopic electric dipoles.26 However, the chemical element doping can cause a predisposition to antisymmetric distortions in a cubically coordinated ion in the centrosymmetric MTe rock-salt chalcogenides, making it practical to utilize the Rashba band spin splitting in MTe.27 By doping Sn in centrosymmetric GeTe, Hong et al. found that Sn-doping can break the inversion system, causing the Rashba spin splitting to occur at L point in the Brillouin zone, and consequently yield an ultra-high power factor.24 Meanwhile, the increasing atomic off-centering distortion with temperature has been evidenced in the radial-distribution function (RDF) and pair-distribution function (PDF) of PbTe and SnTe. These local atomic off-centering distortions enable the local electric dipole in the global centrosymmetric structure, making rock-salt PbTe and SnTe as potential Rashba effect materials.24 Therefore, for rock salt MTe, innovative theories are urgently needed to explain the physical mechanism of the Rashba effect caused by the local antisymmetric distortion, so as to enhance the thermoelectric performance through the manipulation of Rashba splitting.
Herein, we built a Te off-centering model to predict the Rashba effect in the centrosymmetric MTe structure and explored how the Te off-centering behavior affects the thermoelectric properties from first-principles. We showed that the reciprocal displacement between M and Te sites caused by atomic off-centering is the root cause of the Rashba effect. Furthermore, from the perspective of the atomic orbital mechanism, we examined how the Te off-centering behavior influences the electronic and phonon structures through affecting the lone pair electrons' activity, thereby enhancing the thermoelectric performance of rock-salt MTe.
2. Computational methodology
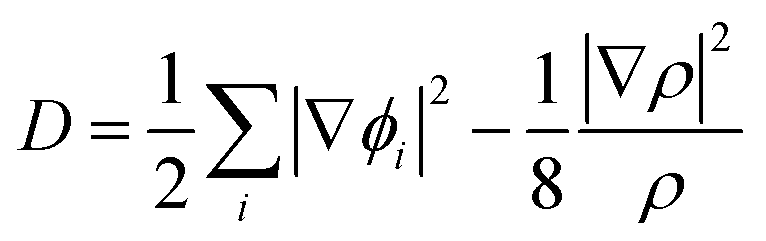
We adopted the primitive cell of MTe including one M and Te atom.28,29 Then, a Te-off centering distortion model was built to simulate the change of reciprocal displacement between the M and Te sites. As shown in Fig. 1(c), the original site of the central Te atom along the 〈111〉 direction30 was displaced from (0.470, 0.470, 0.470) to (0.5, 0.5, 0.5).31,32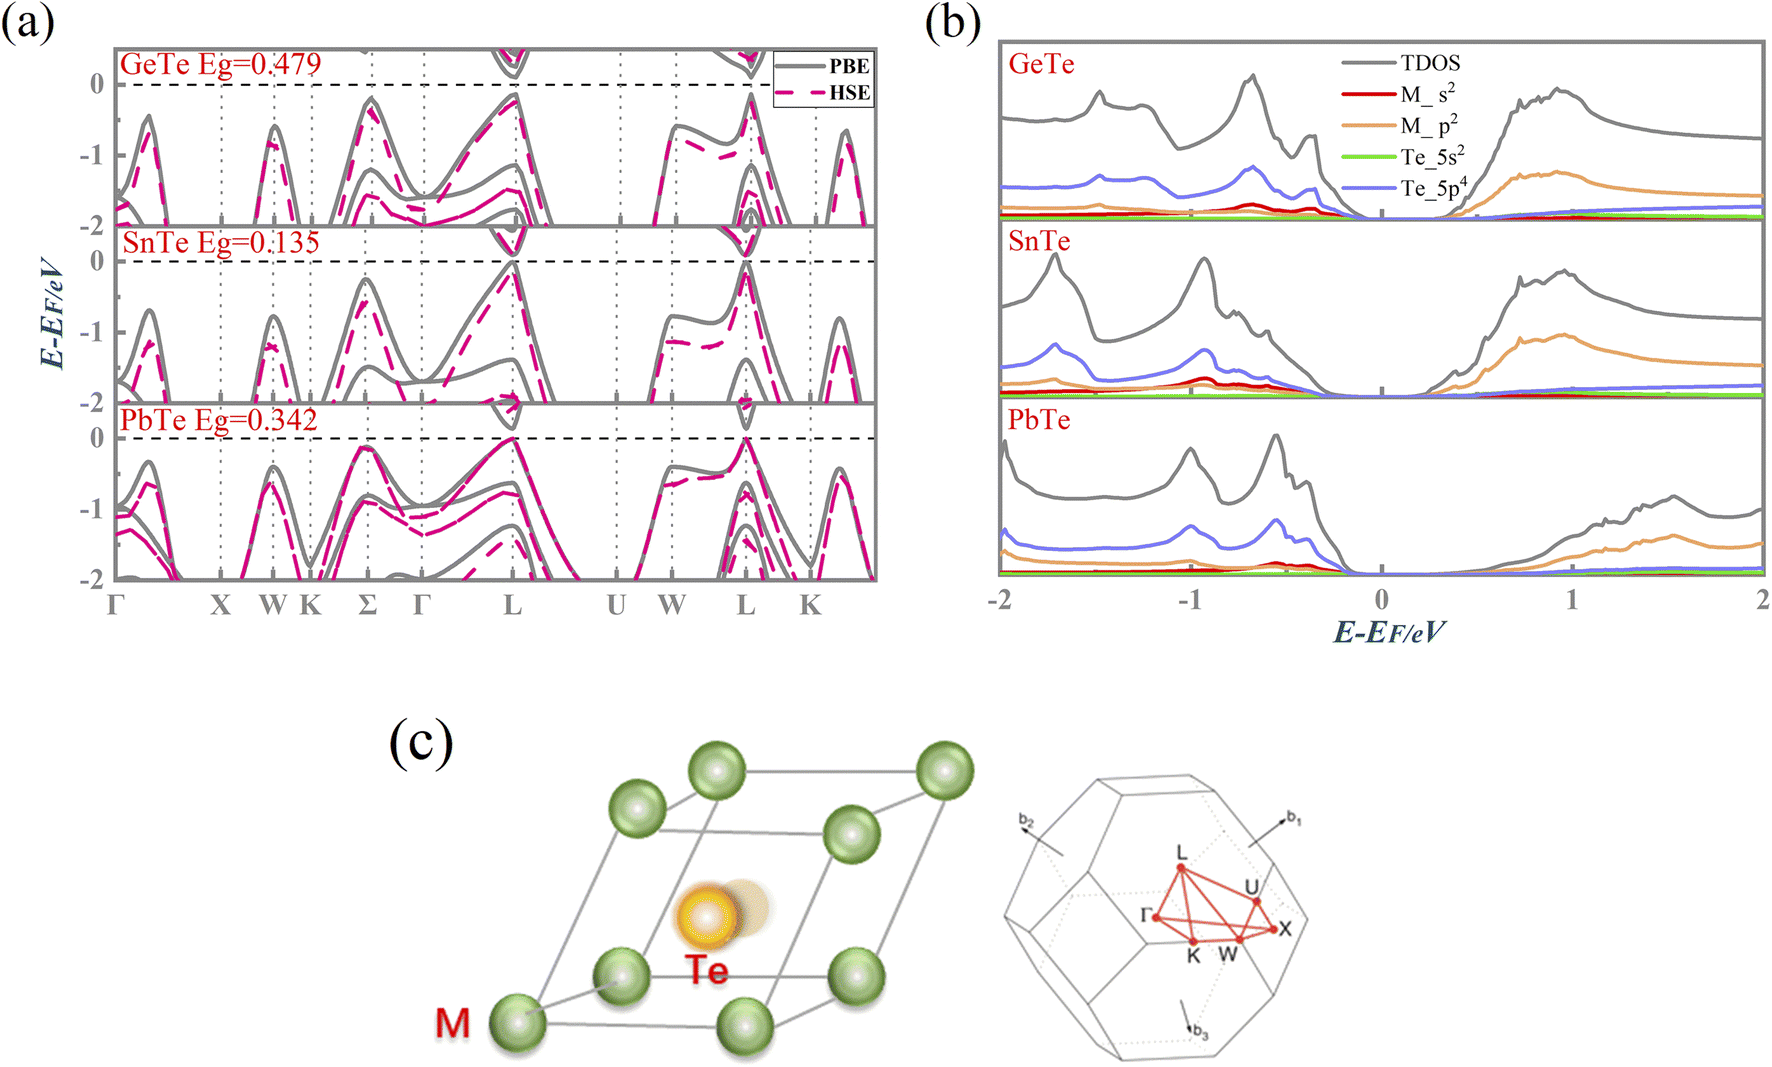 | ||
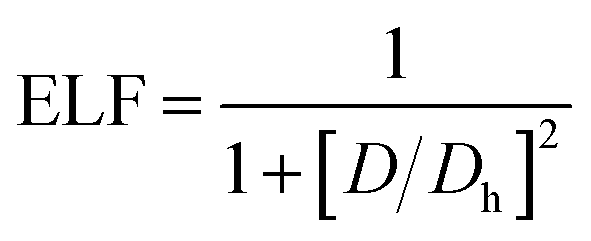
| Fig. 1 (a) The calculated electronic band structure with PBE and HSE exchange–correlation functional including SOC, (b) the calculated density of states (DOS) and partial density of states (PDOS), and (c) the Te off-centering distortion model and first Brillouin zone for pristine MTe. | ||
2.1. First-principles calculations
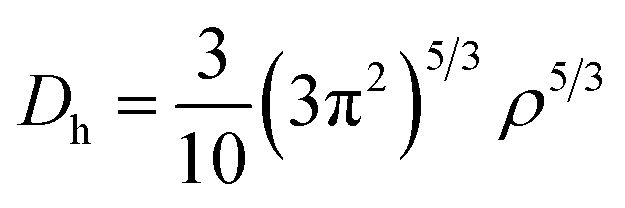
The electronic structure calculations were performed using the Vienna ab initio simulation package (VASP)33 by the GGA, choosing the PBE34 form for the exchange–correlation functional. The spin–orbit coupling (SOC) was taken into account for the electronic structure calculations. We employed hybrid HSE06 functional calculations to overcome the band gap underestimation problem using a grid of 12 × 12 × 12 k points.35 The atomic positions and lattice parameters were fully relaxed until the residual stress and the maximum forces acting on each atom were less than 0.001 kbar and 10−8 eV Å−1, respectively. The cutoff energy Ecutoff was set as 520 eV, and the k-points grids from 20 × 20 × 20 to 30 × 30 × 30 were used for the electronic properties calculation.The analysis of crystal orbital Hamilton population (COHP) was also completed.36 We calculated the electron localization function (ELF) of MTe to explore the free-electron behavior. ELF can discriminate between the free-electron behavior and regions of space where electrons are strongly confined, such as covalent bonds or lone pairs. ELF was equivalently defined by Savin and coworkers37 in terms of the excess of local kinetic energy density (D) according to the Pauli principle.
 | (1) |
 | (2) |
 | (3) |
The Weizsacker functional represents the kinetic energy of electrons with bosonic-like behavior, such as in covalent bonds, and is the second component on the right-hand side of D. Dh is the kinetic energy density of a homogeneous electron gas at a density equal to the local density (ρ), and ϕi is the Kohn–Sham orbital.
2.2. Electrical transport properties
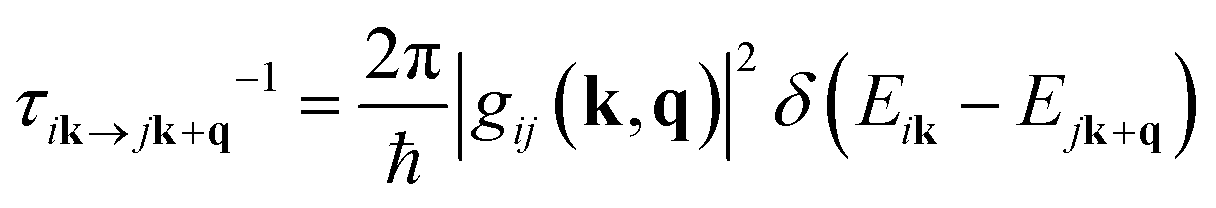
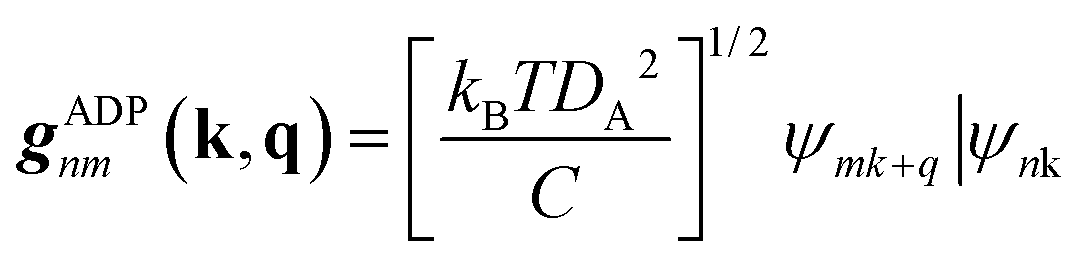
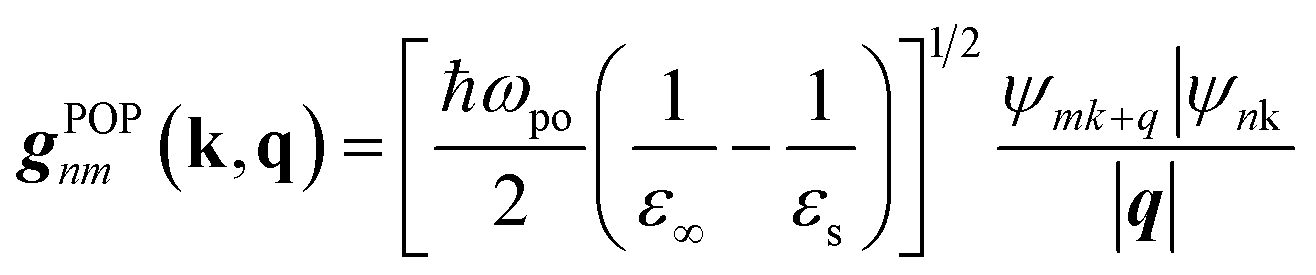
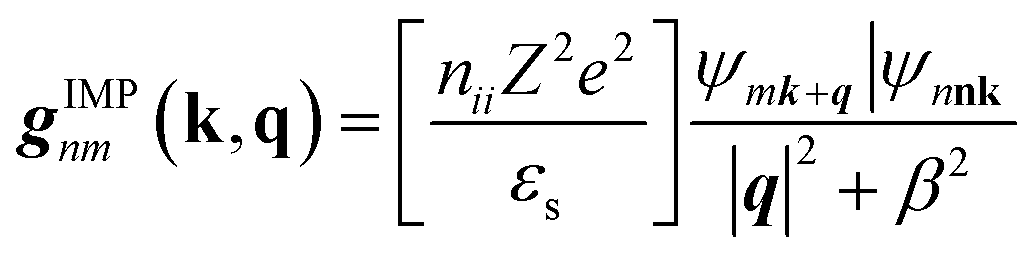
The AMSET code38 was chosen using the Fermi's golden rule and momentum relaxation time approximation theory (MRTA) to compute the carrier lifetime, where the elastic scattering rate can be expressed by:39
 | (4) |
 | (5) |
| gij(k, q) = jk + q|lgij|ik | (6) |
 | (7) |
 | (8) |
 | (9) |
Once the carrier lifetimes were acquired, we used BolzTraP2 (ref. 40) to interpolate the electron on coarse meshes of 16 × 16 × 16 initially through solving the semiclassical Boltzmann transport equation (BTE). It was then interpolated to fine meshes of 50 × 60 × 60 through Fourier interpolation in the first Brillouin zone, and the TE properties were calculated (electrical conductivity σ, electrical mobility m, Seebeck coefficient S, and carrier thermal conductivity κe). AMSET has been shown to produce consistent results with the state-of-art EPW code for a wide range of chalcogenides.38 It can predict electronic transport properties with an accuracy higher than constant relaxation time approximation (CRTA), and can calculate more complex materials using less computational cost than density functional perturbation theory (DFPT).41
2.3. Thermal transport properties
To study the temperature effect on MTe, we chose the normal mode decomposition method using the DynaPhoPy code to calculate anharmonic phonon dispersion.42 The crystal anharmonicity as a function of temperature was analyzed using molecular dynamics (MD) simulations. The power spectrum of the mass-weighted velocity derived from MD was fitted to model-spectral-function shapes to determine the quasiparticle phonon frequencies and linewidths. The conventional cell of MTe, including 8 M atoms and 8 Te atoms, was adopted for phonon calculations. We chose the finite-displacement approach with a small displacement of 0.01 Å and a 3 × 3 × 3 supercell containing 432 atoms to perform harmonic and anharmonic calculations. The energy cutoff was chosen as 500 eV and the Monkhorst–Pack k-point grid was set as 12 × 12 × 12.3. Results and discussions
3.1. Effect of Te-off centering distortion on electronic properties
Fig. 1(a) presents the electronic band structure of MTe, and the HSE06 hybrid functional reproduces experimental band gap value. It was observed that the valence bands of PbTe and GeTe are flatter than that of SnTe. This indicates the larger effective mass (m*) of the hole carriers in PbTe and GeTe, which is favorable to enhancing the Seebeck coefficient and against electrical conductivity. Fig. 1(b) shows the density of states (DOS) and partial density of states (PDOS) of MTe. According to Wilson and Moto's theory,43 the physical quantity Seebeck coefficient is closely related to the slope of DOS. Therefore, the steep DOS below the Fermi level in PbTe and GeTe caused by the high Te_5p orbital contribution also enhances the Seebeck coefficient. We observe that the Te_5p orbital contribution of PbTe and GeTe is much higher than that of SnTe. That is because the heavy Σ band is governed by the Te_5p orbital in PbTe and GeTe, whereas SnTe's energy offset ΔELΣ(L–Σ) between the light band and L valence band is too large to adopt the electronic contribution from the Σ band. On the other hand, the narrow band gap of SnTe can effectively enhance the electrical conductivity, but it can also generate a significant bipolar effect.Symmetry breaking due to Te off-centering distortion makes the original centrosymmetric rock salt structure of MTe exhibit macroscopic electric dipoles, i.e., ferroelectricity. The change of the atomic reciprocal displacement modifies the internal electric field, inducing a local dipole in the global centrosymmetric structure and accounting for spin-dependent shifts of the energy dispersions, which emerge as the Rashba effect. To explore the cause of the Rashba effect in centrosymmetric MTe and its strength with Te off-centering, we shift the position of the Te atom from (0.5 − δ, 0.5 − δ, 0.5 − δ) with δ ranging from 0 to 0.03. Fig. 2(a), S1(a) and (b)† show that, with the Te off-centering distortion, the energy level of the L-band decreases sharply, and the valence band maximum (VBM) switches from the light L-band to the heavy Σ-band. The band gap type changes from direct to indirect, and simultaneously induces an apparent Rashba band splitting. The strength of the Rashba splitting (Rashba energy ER) is tuned by the Te off-centering distortion. With the enlarged Te off-centering, the closer local electric dipole moments induce more intense positive external electric field points from M to Te (as shown in Fig. 2(b)), leading to a stronger Rashba spin splitting.44
 | ||
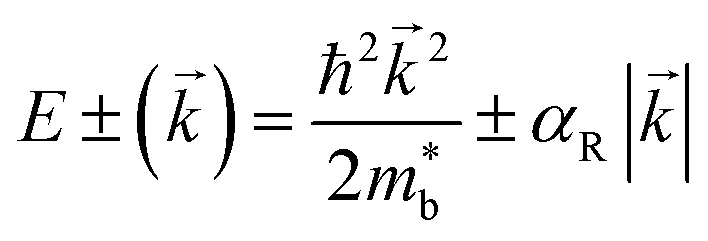
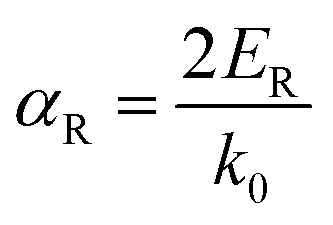
| Fig. 2 (a) The changes of light L-band and heavy Σ-band, and the observance of Rashba spin splitting due to the Te off-centering distortion; (b) the amplifying valence bands (VBs) at the L point of SnTe to highlight the spin-dependent band splitting subject to the Rashba effect; (c) the Rashba energy (ER) of MTe indicating the strength of Rashba spin-dependent band splitting; and (d) the calculated energy off (ΔELΣ = L − Σ) of the L-band and Σ-band with Te off-centering. | ||
Fig. 2(b), S1(c) and (d)† are the enlarged views of the valence bands (VBs) near the L point of MTe. The two spin-polarized band effective mass 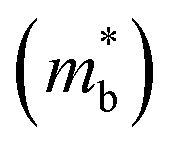 approximation is commonly described by:
 | (10) |
 | (11) |
The Rashba energy represents the strength of the Rashba band splitting, indicating the spin-dependent and spin-degenerated shift of the energy dispersions. In MTe, the Rashba effect is observed near the L point, but the Rashba energy varies, indicating that the strength of the Rashba splitting is different. As shown in Fig. 2(c), the Rashba energy of two extreme bands differs. The ER of the left extreme band is somewhat higher than that of the right band due to the opposite electron spin directions. The Rashba energy of PbTe is the largest, while that of GeTe is the smallest, indicating that the Rashba energy enlarges as the atomic number M increases. It is observed that the heavier Pb element mass causes a stronger spin-orbital coupling (SOC), leading to a larger Rashba band splitting in the L-band. We also calculated the band effective mass of the L-band  values of MTe based on a single parabolic band, as presented in Table 1. PbTe has a larger effective mass than GeTe and SnTe in the L-band. We find that whenever MTe changes with the Te atomic location (from Te in-centering to Te off-centering) or atomic type (from Ge to Sn and Pb), the band spin splitting energy increases with the increase of the band effective mass. Therefore, it can be concluded that the largest band effective mass and atomic mass of PbTe is the direct cause for the most significant Rashba band splitting in MTe.
| Atomic reciprocal displacement | |||||
|---|---|---|---|---|---|
| 0.47 | 0.48 | 0.49 | 0.50 | ||
| Eg (eV) | GeTe | 0.597 | 0.531 | 0.491 | 0.479 |
| SnTe | 0.259 | 0.223 | 0.171 | 0.1346 | |
| PbTe | 0.463 | 0.426 | 0.385 | 0.3423 | |
 (m0) (m0) |
GeTe | 0.132 | 0.105 | 0.091 | 0.081 |
| SnTe | 0.140 | 0.112 | 0.096 | 0.083 | |
| PbTe | 0.356 | 0.249 | 0.184 | 0.153 | |
Fig. 2(d) shows the variation of energy offset ΔELΣ(L–Σ) between the light band L and heavy band Σ valence band resulting from the Rashba effect. The energy offset ΔELΣ of GeTe and PbTe is very small when the Te atom is in-centering, suggesting the better band convergence of the L-band and Σ-band. As the atomic reciprocal displacement decreases, the Te off-centering distortion enlarges the Rashba spin splitting, and further influences the band energy dispersion of light band L and heavy band Σ. GeTe and PbTe maintain good band degeneracy as the Te off-centering distortion enlarges. However, the ΔELΣ of SnTe increases markedly and the contributions from the additional Σ valence band carriers to the electronic transport are reduced, thus resulting in a significant reduction in the Seebeck coefficient and electrical conductivity.
To quantify the influence of the atomic orbital on the light and heavy valence band behavior, the projected band structure (PBAND) and projected density of states (PDOS) with the Te atomic off-centering distortion were calculated, as presented in Fig. 3(a), (b) and S2.† In the centrosymmetric MTe, the cation M_s orbitals in conjunction with Te_5p4 orbitals govern the highest occupied molecular orbital (HUMO). The PBAND of MTe shows that the contribution of the M_5s orbital to the light L-band decreases as the Te off-centering distortion enlarges. This is because the Te in-centering behavior normally quenches the stereochemical activity of the cation s2 lone pair.45 The low stereochemical activity maintains a high cation s2 orbital energy, and raises the light L-band to the top of the valence band. As the Te off-centering distortion enlarges, the weight of the Sn_5s orbital gradually decreases and becomes slightly lower than that of Sn_5p, which is also observed in PDOS. Thus, the s2 lone pair expresses itself through the Te off-centering local distortion and drives the ferroelectricity in MTe, leading to a Rashba band splitting in the L-band. The Rashba band splitting further induces the L-band energy reduction and reverses the band energy between the light L-band and heavy Σ-band, making the Σ-band governed by the Te_5p orbital become the valence band maximum.
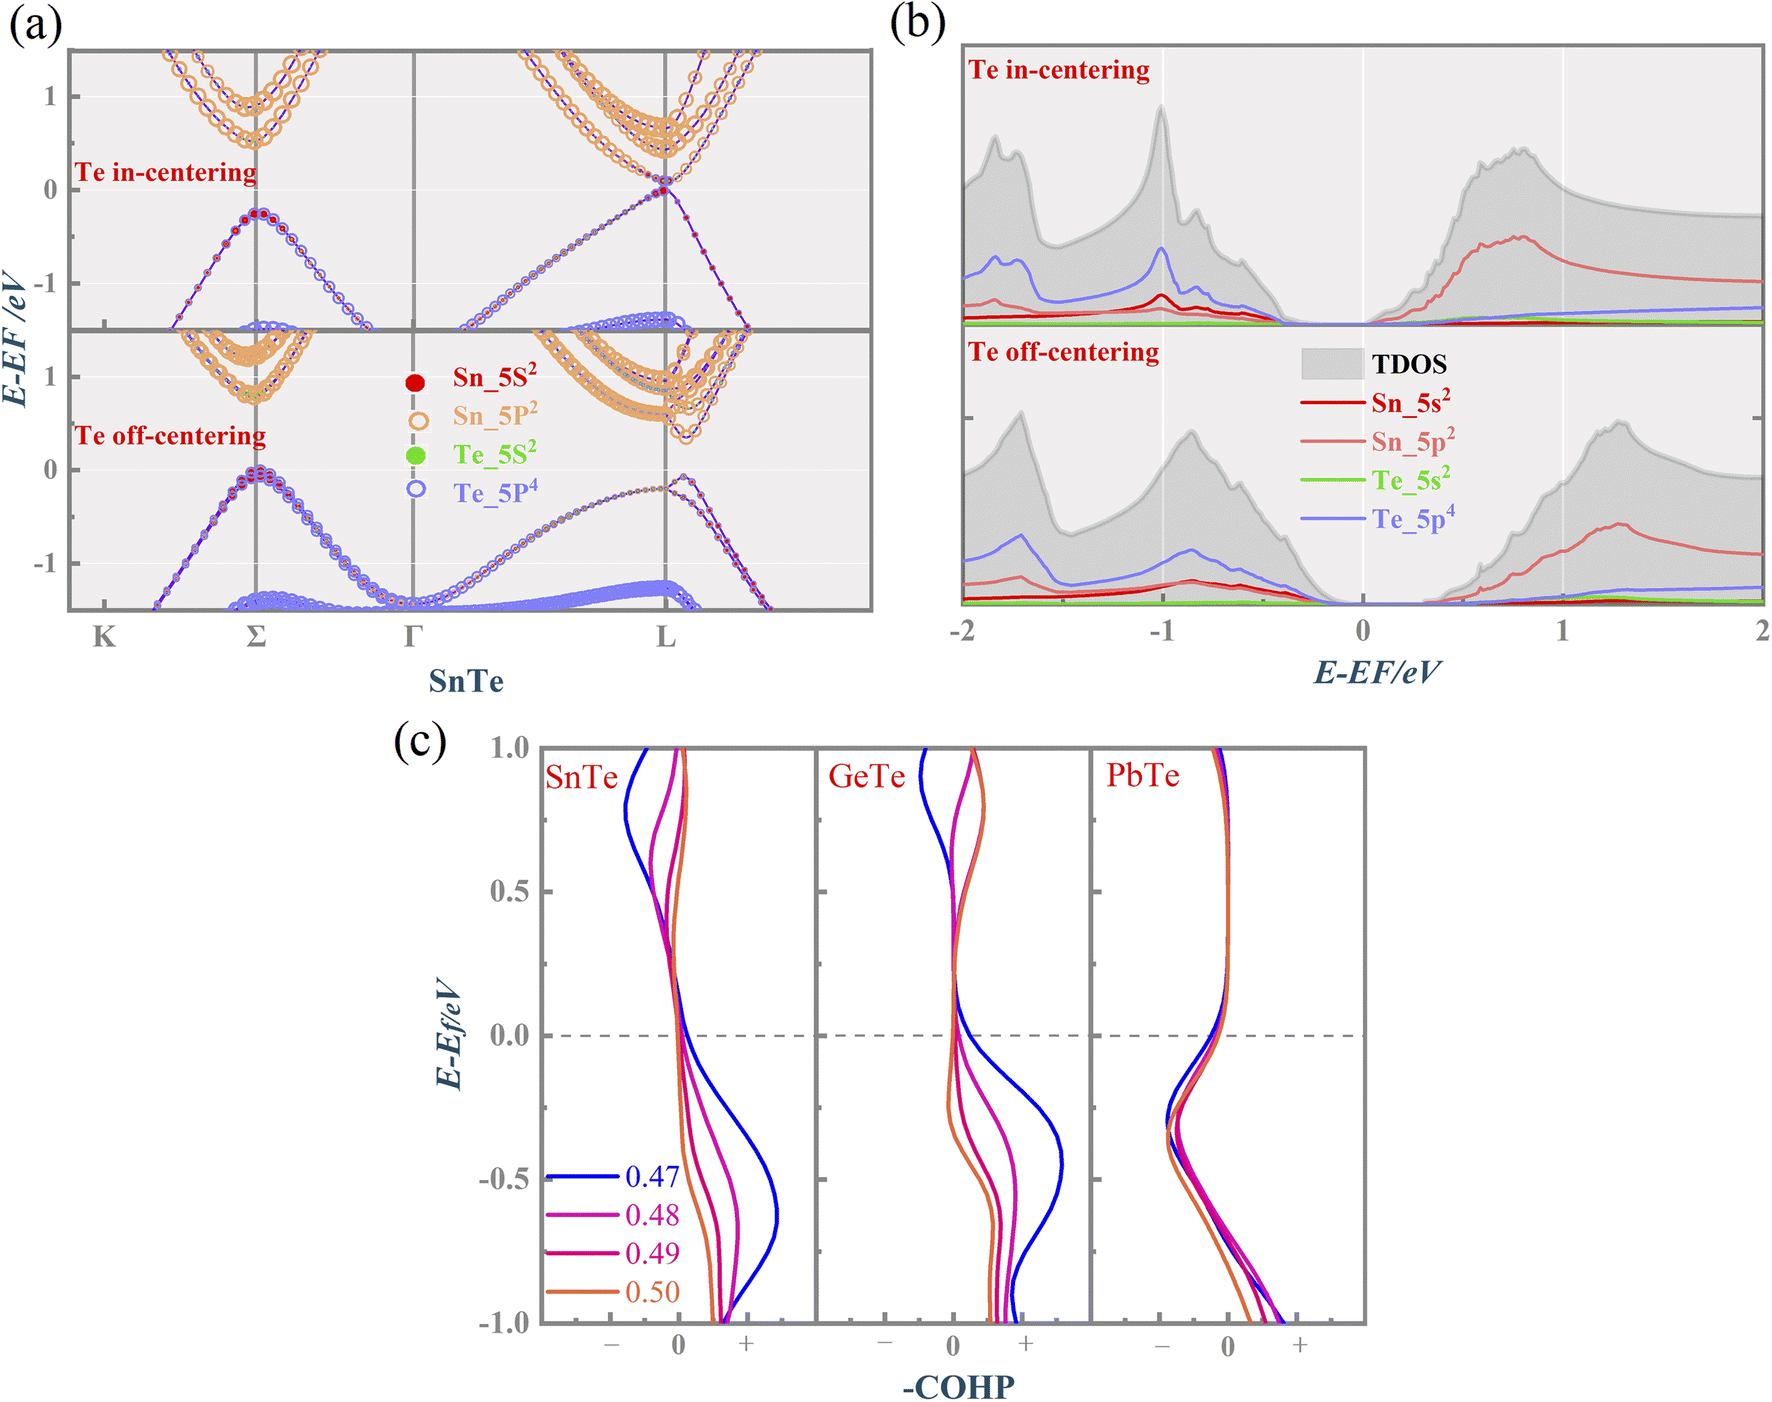 | ||
| Fig. 3 The calculated (a) PBAND (size of each circle representing the atomic orbital weight) of SnTe), (b) PDOS when the Te atom is located at (0.47, 0.47, 0.47) and (0.50, 0.50, 0.50), respectively, and (c) –COHP of MTe as a function of energy and atomic reciprocal displacement. | ||
We have also performed crystal orbital Hamilton population (COHP) analysis, a bond-detecting tool for solids and molecules, to study the contribution of the bonding and antibonding states to the electronic properties. The antibonding and bonding states are represented by the negative and positive values of –COHP along the x-axis, respectively. Fig. 3(c) shows that the Te off-centering distortion can enhance the bonding state near the Fermi level in SnTe and GeTe, correlating with the increased structural stability. The s2 lone pair's activity has long been used to explain the off-centering structural distortion in MTe.46 The enhanced bonding state indicates the stabilization of the distorted asymmetrical structures due to the stereochemical active s2 lone pair. Unlike the occurrence of the phase transition in GeTe and SnTe where a more stable rhombohedral structure emerges at low temperatures, PbTe maintains the rock salt structure. The cation s-anion p mixing of PbTe allows a more intense s2 electron pair activity, resulting in the instability of asymmetrical distortions in a cubically coordinated ion.27 This can also explain why electrons occupy antibonding states at the (−1, 0) eV energy range in the -COHP of PbTe.
Fig. 4 shows the calculated valence electron localization functions (ELF) for MTe when the central Te atom along the 〈111〉 direction is displaced from (0.47, 0.47, 0.47) to (0.5, 0.5, 0.5). According to the definition, ELF can have values in the range of 0 ≤ ELF ≤ 1, with 1 for perfect localization, 0.5 for perfect delocalization and 0 for very-low-density regions. The ELF indicates that the s2 lone pair is tightly concentrated around M cations in an approximately spherical region, while Te anions are surrounded by a nearly spherical Te p shell.
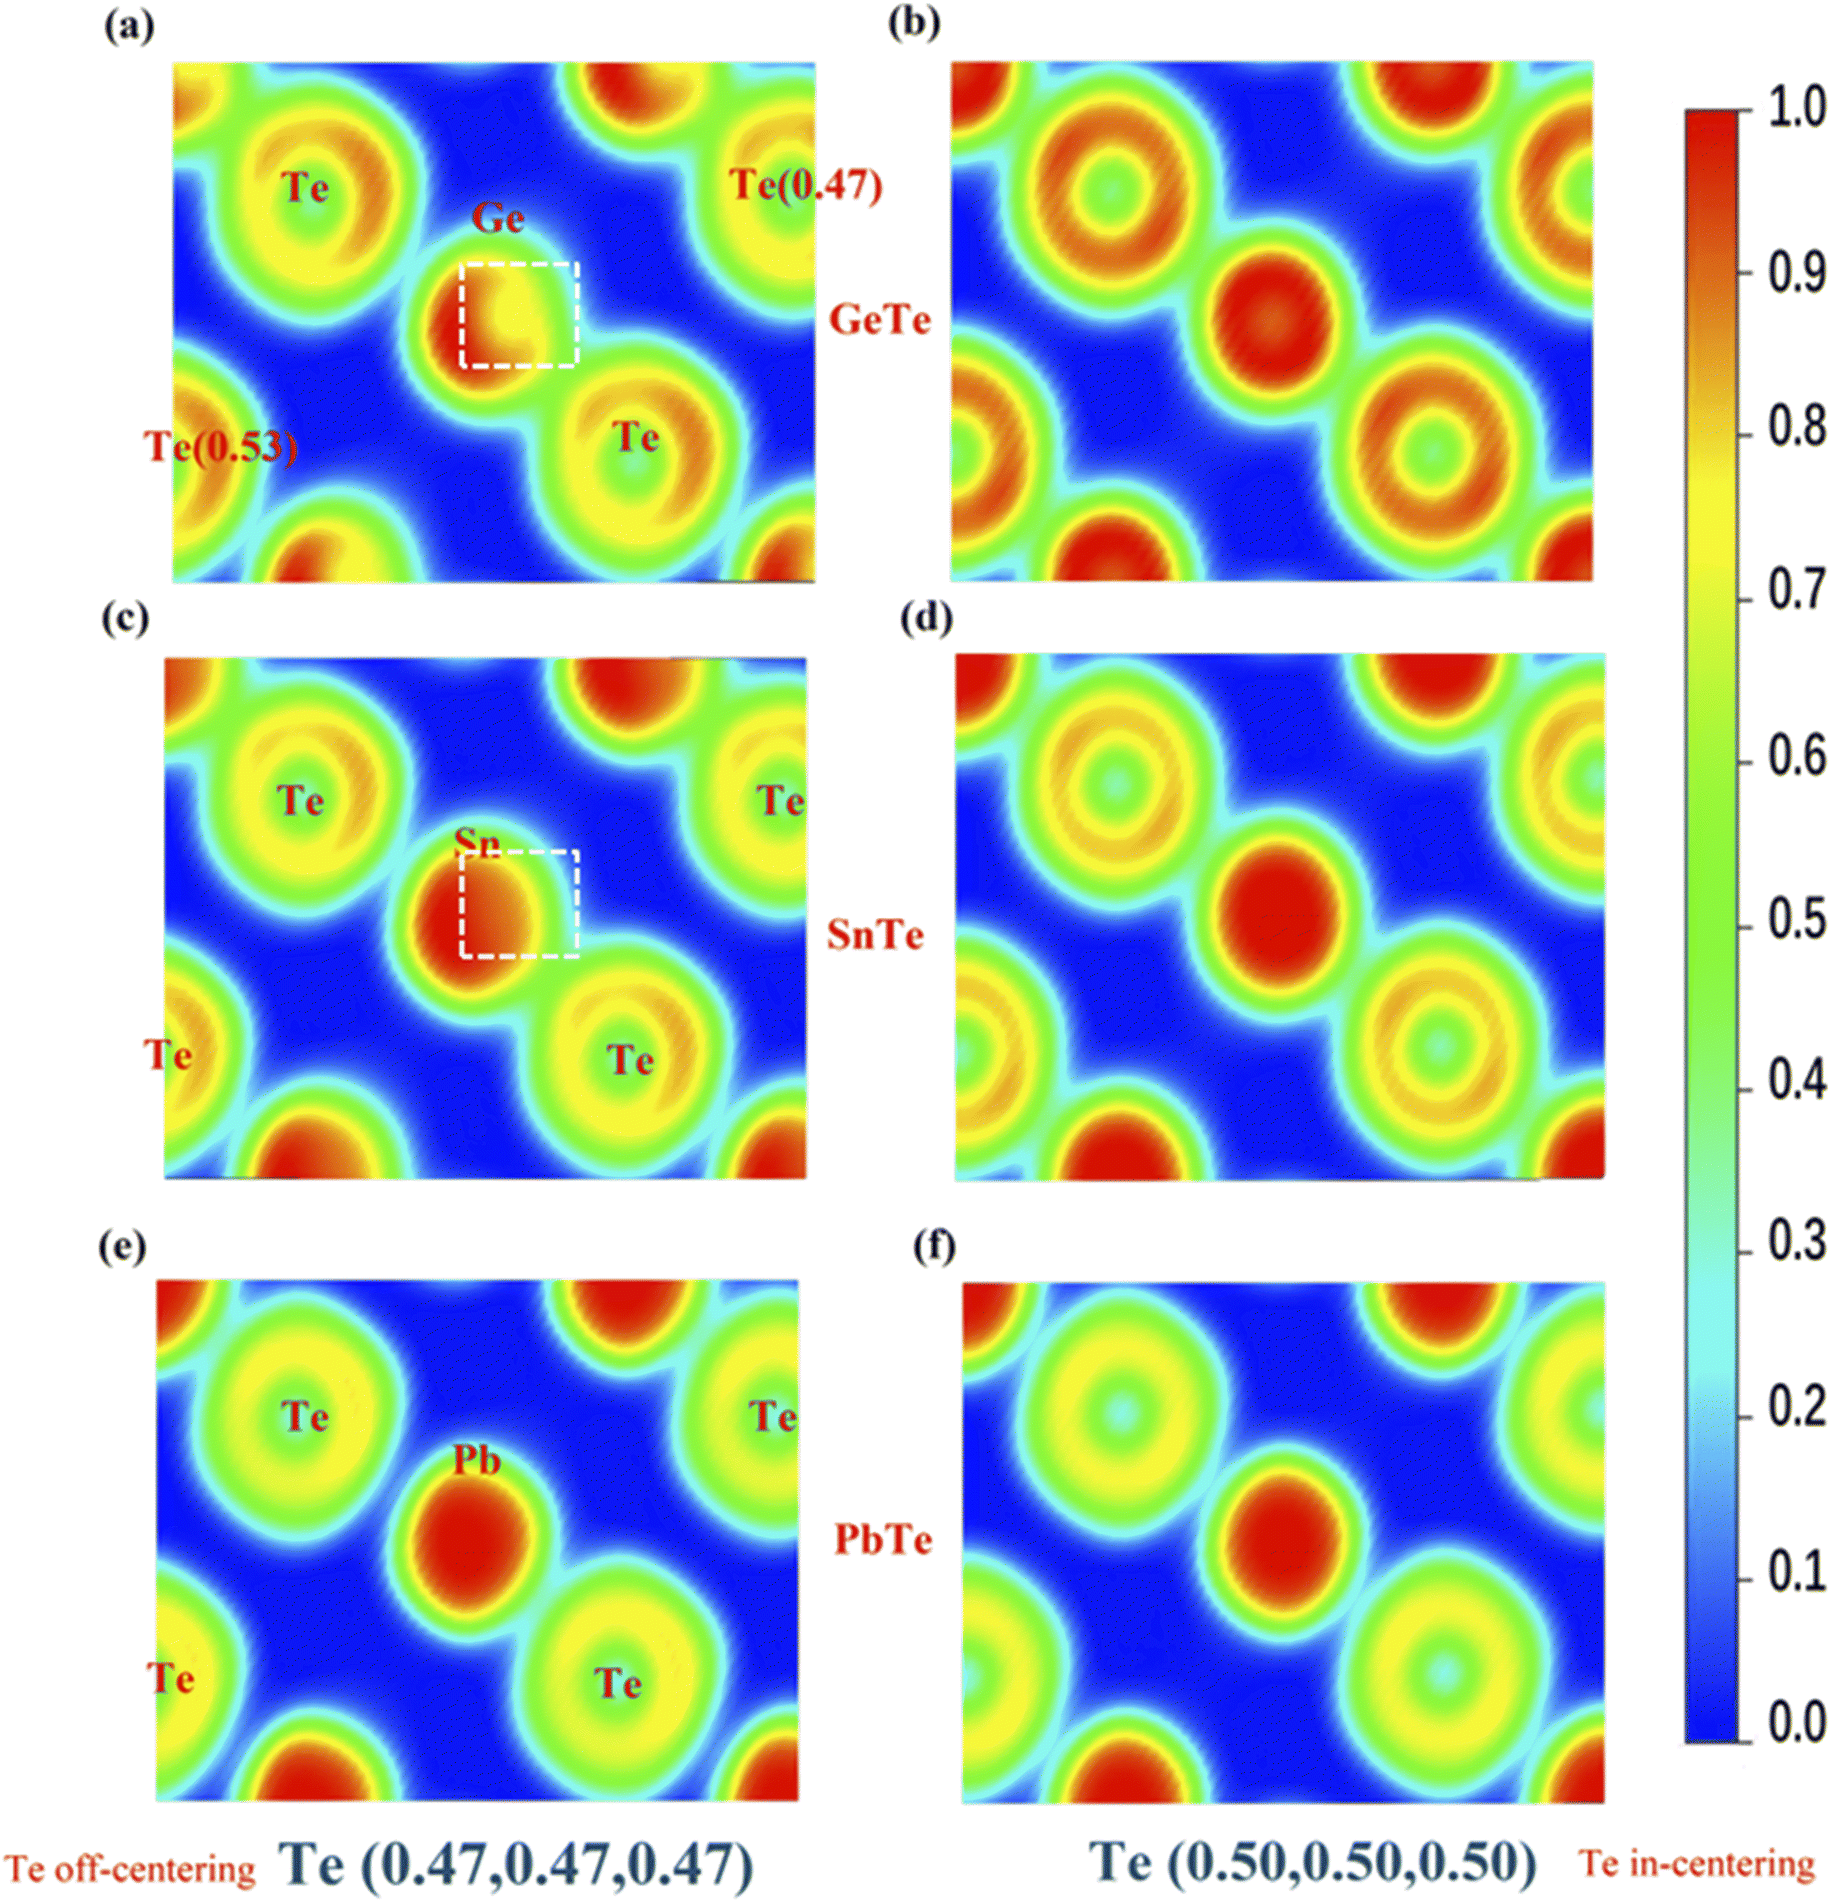 | ||
| Fig. 4 Two-dimensional color-coded electron localization function (ELF) maps of Te off-centering (a) GeTe, (c) SnSe, (e) PbTe and Te in-centering (b) GeTe, (d) SnSe, (f) PbTe cross-sectioned along the (0,−1,1) plans. | ||
As shown in Fig. 4(a) and (c), the ELF values of GeTe and SnTe show that the closer reciprocal displacement of M and Te causes the more significant spatial extent of delocalization when Te is in-centering. We observe the formation of a localized lone pair on the top right of the cation (marked by a white square) and the roughly spherical cation region's slight distortion, indicating an internal relationship between the s2 lone pair and stabilization of the distorted asymmetrical structures.47 Unlike SnTe and GeTe, the ELF of the Pb cation shows little change with the off-centering distortion due to the weak covalent bond tendency when compared to SnTe and GeTe. However, the ELF also indicates more s–p mixing between the M and Te atoms. Although PbTe has a stable cubic structure, it should also be susceptible to atomic polarization by static electric fields because the s–p mixing reduces the restoring force against ionic displacement.48 The stereochemical activity of the s2 lone pair and s–p mixing distortion can significantly manipulate the electron structure of MTe (M = Ge, Sn, Pb) through modifying the band structure and density of states, thereby affecting the carrier transport properties and thermoelectric properties.46
3.2. Effect of Te off-centering distortion on phonons
The harmonic approximation49 is often employed to predict the phonon dispersion relations of solids. However, this approach cannot address the temperature effect on phonons. The local atomic off-centering distortion rising from the lattice vibrations at finite temperatures has been demonstrated in MTe rock-salt chalcogenides, unambiguously indicating the emergence of anharmonic effects. Herein, we chose the normal mode decomposition method to estimate the anharmonic phonon dispersion at 300 K and analyze the MTe crystal anharmonicity. Fig. 5 depicts the calculated harmonic and anharmonic phonon dispersion relation for MTe. The results show an obvious anharmonic effect due to the atom off-centering distortion caused by the increased temperature.50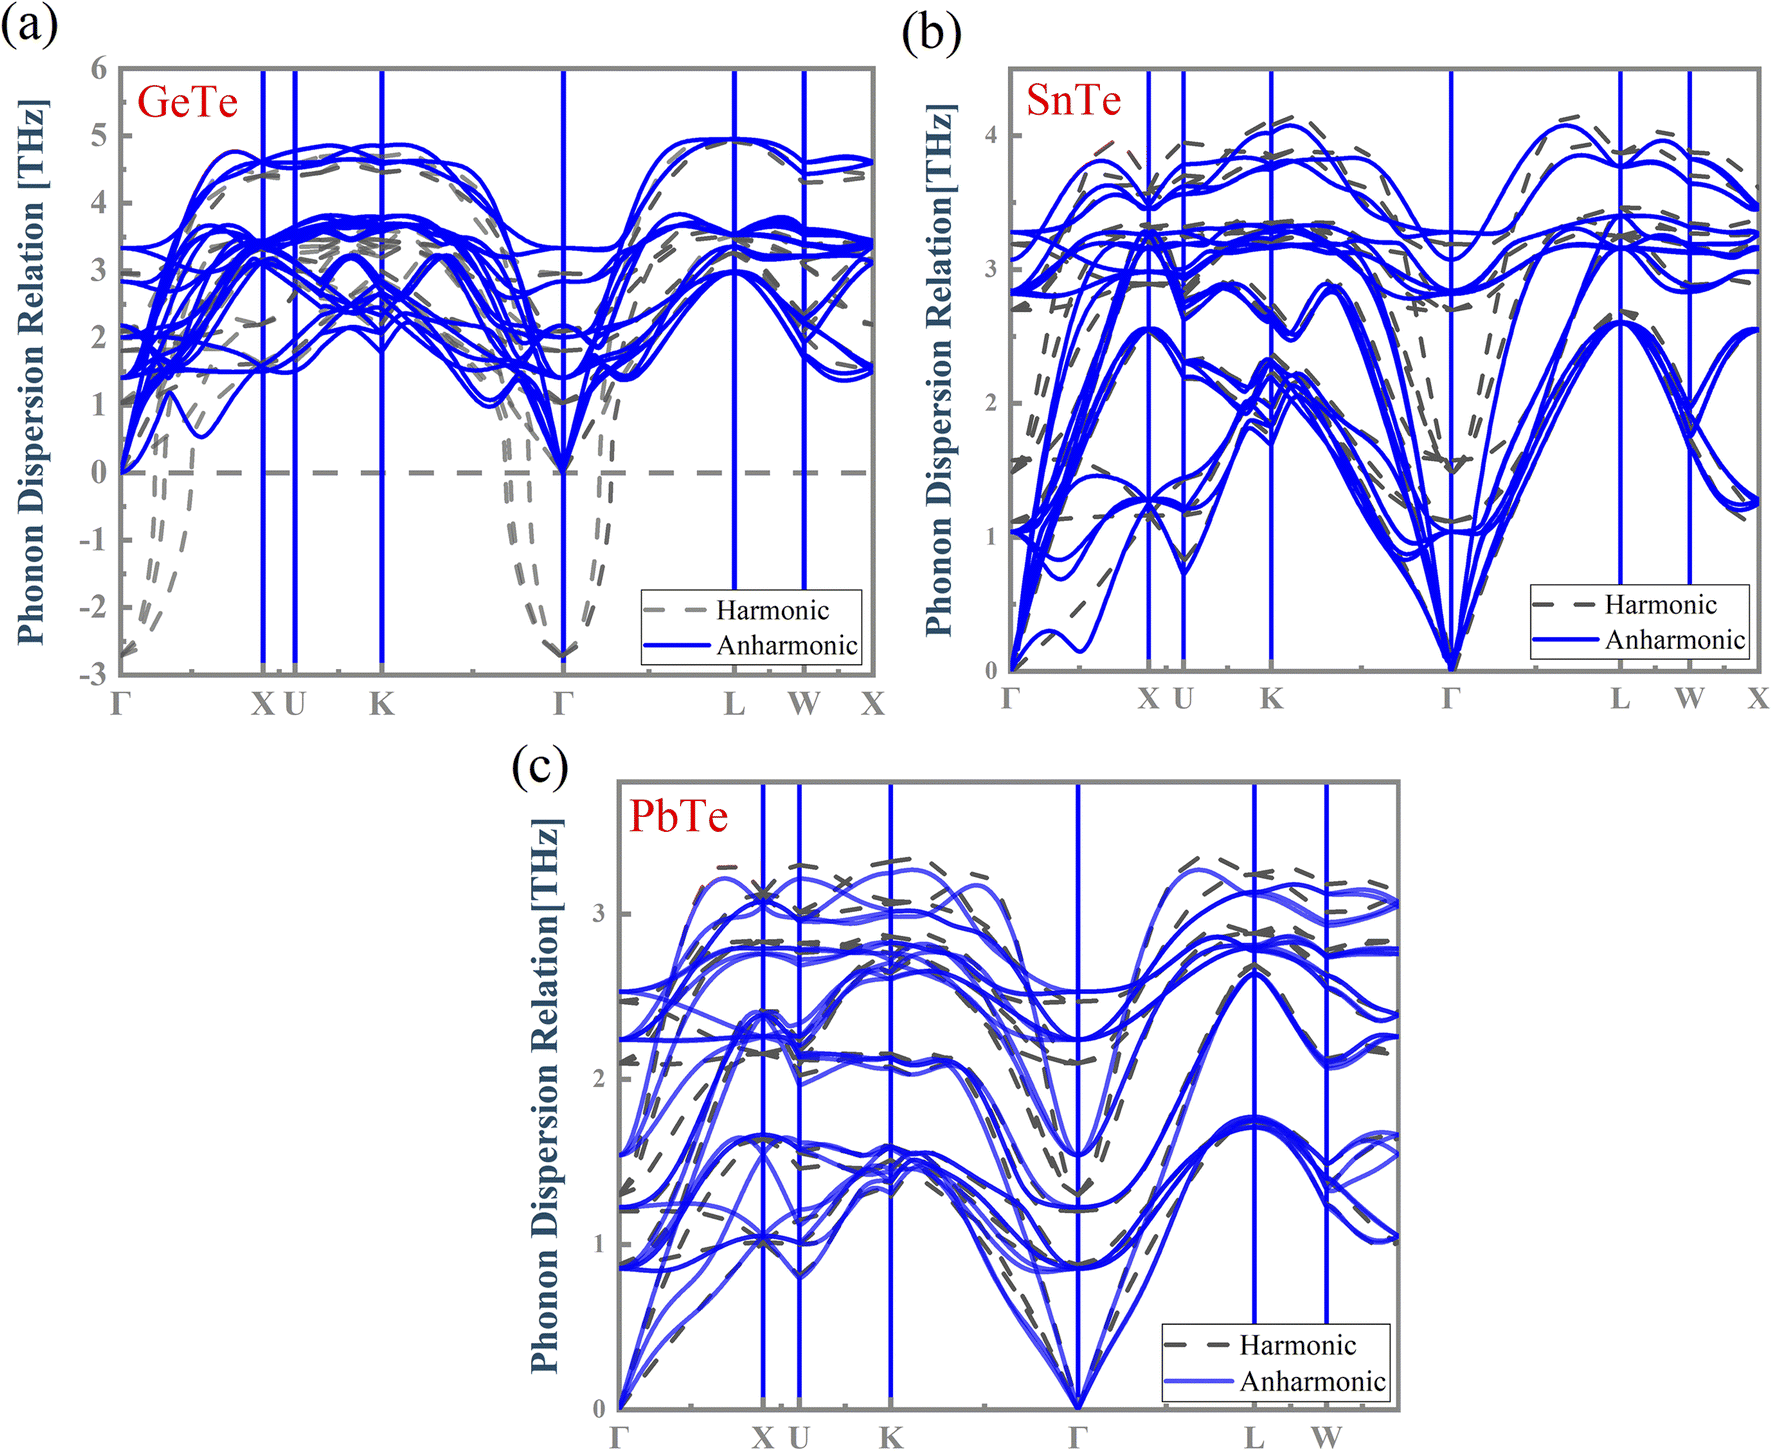 | ||
| Fig. 5 The calculated harmonic and anharmonic phonon dispersion relations for (a) GeTe, (b) SnTe and (c) PbTe, respectively. | ||
In GeTe, the optical phonons exhibit dynamically unstable phonon branches (imaginary frequencies) with a frequency of −2.718 THz at the Γ point in the harmonic phonon. However, those imaginary phonon frequencies are inconsistent with the stability of GeTe. We find that the imaginary phonon modes of GeTe disappear after considering the correction of high-order anharmonicity.51 Meanwhile, the temperature-induced atomic off-centering distortion in MTe creates dipole electrical fields, and affects the phonon frequency shift by introducing anharmonic bonds in the centrosymmetric crystalline solids.52–54 The phonon frequency shift is relative to temperature, and is essentially a change of the phonon vibration and atomic displacement. The total frequency shift is expressed by42 Δωqs ≈ ΔωAqs + ΔωEqs. The change of the intrinsic lattice anharmonicity ΔωAqs and the thermal expansion ΔωEqs (calculated as follows, ΔωEqs(T) = ωqs[V(T)] − ωqs(V0)) eliminates the imaginary phonon modes and softens the phonon frequency. The anharmonic and softened phonon modes can be attributed to the resonant bond caused by the atomic displacement, where the Te atom displaces the direction and perturbs the p orbital of the cation, as shown in Fig. 4.55 The resonant bond causes strong anharmonic scattering and optical phonon softening, which leads to a lower phonon group velocity and the decreased lattice thermal conductivity klat.56 To verify the importance of the atomic displacement to anharmonicity, we calculated the phonon dispersion as a function of the Te off-centering displacement. As shown in Fig. S3†, the phonon dispersion relations of MTe confirm that the high atomic displacive amplitudes cause the imaginary phonon modes of MTe to disappear, and enlarge the gap of the acoustic branch and optical branch. Fig. S3† shows the LO–TO splitting with the Te off-centering in MTe, where the “avoided crossing” interaction between LO and TO further blocks the heat transport.57
Furthermore, the atomic off-centering distortion caused by lattice vibration influences the activity of the s2 lone pair. The stereochemical activity of the s2 lone pair causes the crystal structure distortion. This leads to a Te off-centering distortion and a stronger bonding state (Fig. 3(c)), indicating the covalent interaction tendency. The s–p mixing also changes the restoring force of MTe. The delicate balance of the short-range restoring force and the long-range dipolar coulomb force is tuned by the crystal structure change, particularly in binary crystals with a covalent tendency. When a local dipole oscillating with a given restoring force interacts through a long-range Coulomb force, the Coulomb force tends to soften the transverse restoring potential.58,59 Thus, the s2 lone pair can strengthen the interplay between the local restoring force and long-range dipole in the centrosymmetric structures, also leading to the softened transverse optical phonon modes.60–63 The strong anharmonicity in combination with the low phonon group velocity in MTe leads to low thermal conductivity. Meanwhile, the changes of phonon dispersion caused by anharmonic bonds also influence carrier scattering (Fig. 7). The vanishing imaginary phonon modes of GeTe intensify the scattering between the acoustic branch and carrier, thus degrading the electrical properties.
3.3. Effect of the Te off-centering distortion on thermoelectric properties
Fig. 6, S5 and S6† present the calculated TE properties as a function of the carrier concentration for n-type and p-type MTe at 300 K and 700 K, respectively. It is observed that the pristine p-type PbTe has a superior Seebeck coefficient compared to that of the pristine p-type SnTe (GeTe in between). This is due to the exceptional energy band convergence caused by its low energy offset (ΔELΣ) and higher band effective mass.64,65 However, the higher band effective mass of PbTe also leads to a relatively low electrical conductivity compared to those of GeTe and SnTe. For SnTe, the energy offset (ΔELΣ) of SnTe is too large. Furthermore, the heavy hole from the heavy Σ-band would not contribute to the electron–hole transport. The above facts lead to an inevitable Seebeck coefficient decline in pristine SnTe. The Seebeck coefficient of pristine 300 K p-type MTe (M = Ge, Sn, Pb) is 91.6 μV K−1, 69.1 μV K−1 and 141.7 μV K−1 at 1020 cm−3, respectively, which basically matches the experimental data.66 For instance, the calculated Seebeck of SnTe matches well with the In-related-doped SnSe (exp 2 and exp 1 in Fig. 6). The experimental Seebeck coefficient lies between 65 μV K−1 and 80 μV K−1 when the carrier concentration nH is around 1–2 × 1020 cm−3. Our predicted Te in-centering Seebeck coefficient of SnTe ranges from 66.7 μV K−1 to 70.1 μV K−1 when the nH changes from 5 × 1019 cm−3 to 3 × 1020 cm−3, demonstrating good agreement with exp 2 and exp 1. However, for Sn1−xCdxTe (exp 3), the Seebeck coefficient is small near room temperature for Cd-doped SnTe. This is because the Cd-doping facilitates the increase of electric conductivity, but is against the Seebeck coefficient. This explains why the Seebeck coefficient of Cd-doped SnTe is lower than that of our theoretical calculation. The Seebeck coefficient value of Cd-doped SnSe is lower than 32 μV K−1 when nH is around 2 × 1020 cm−3, even lower than that of pristine SnSe.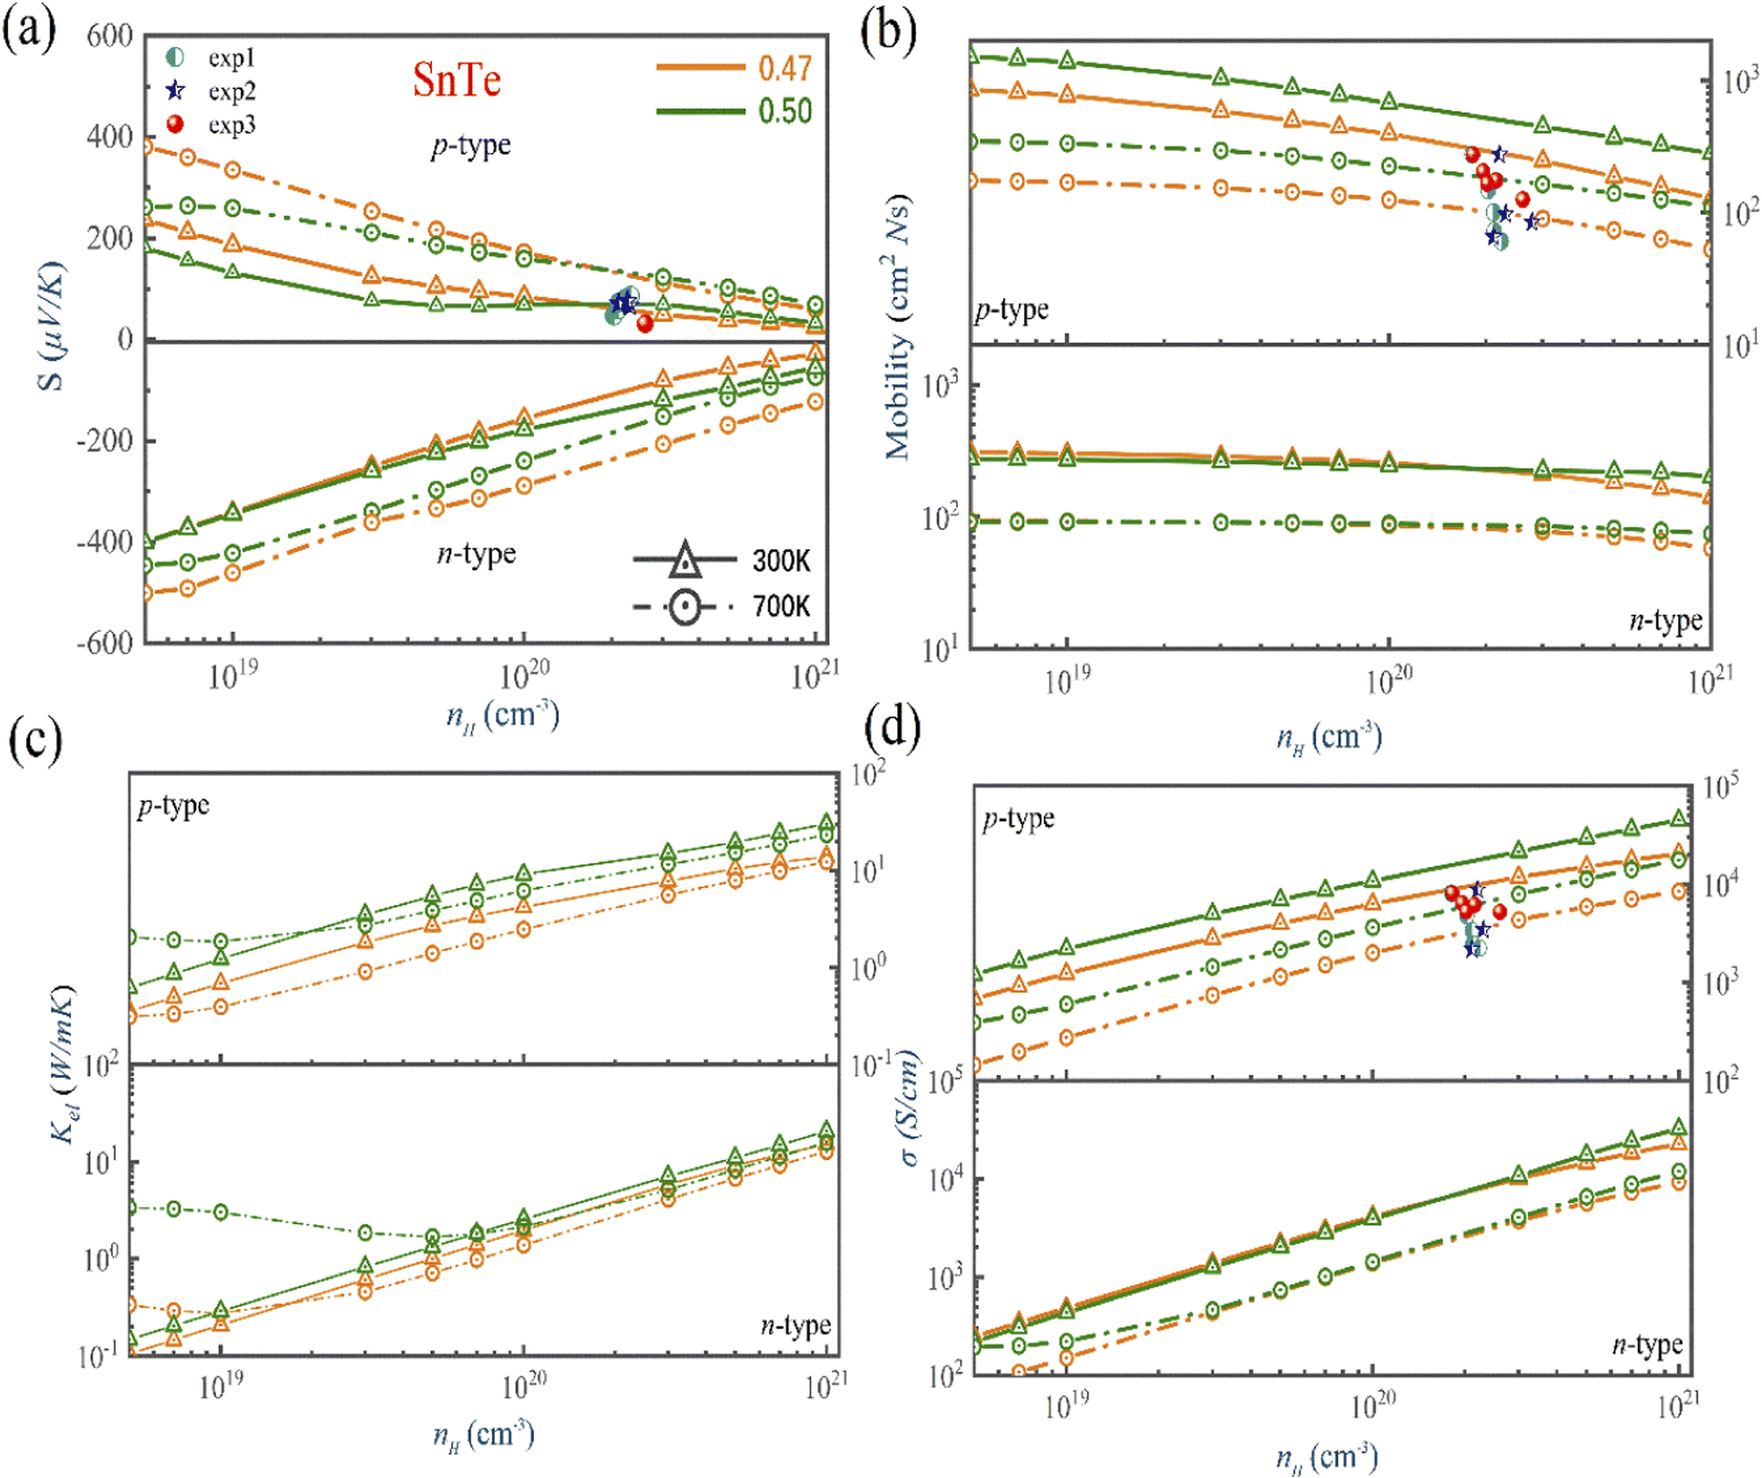 | ||
| Fig. 6 The calculated (a) Seebeck coefficient, (b) electrical conductivity, (c) thermal conductivity, and (d) mobility of SnTe as a function of the carrier concentration and atomic reciprocal displacement at 300 K and 700 K (orange line is the Te off-centering, while the green line is the Te off-centering. The solid line with triangles and dashed line with circles indicate 300 K and 700 K, respectively). Experimental data are shown in spheres, circles, and stars.66 | ||
The bipolar effect generates extra energy during the generation and recombination of two types of carriers, making few carriers participate in the transport process. The existence of minor carriers will cause a decrease of the Seebeck coefficient and further increase the electronic thermal conductivity. We find that the Rashba effect can effectively ameliorate the electronic states near the band gap region and enlarge the band gap of MTe (Fig. 2(b)), which avoid the bipolar effect caused by the unduly narrow band gap.67 According to the expression68
 | (12) |
 and kB is the constant, band gap for bipolar diffusion, and Boltzmann constant, respectively. The enlargement of the band gap for MTe (GeTe, SnTe and PbTe) from 0.479 eV to 0.579 eV, 0.135 eV to 0.250 eV, and 0.342 eV to 0.463 eV, respectively, reduces the adverse recombination of the two-type carriers and bipolar diffusion, and inevitably increases the Seebeck coefficient for both n-type and p-type MTe by avoiding the bipolar effect. Thus, the Seebeck coefficient value of MTe increases significantly. Meanwhile, the Seebeck coefficient of MTe is further enhanced as the Te atomic off-centering distortion enlarges. This is mainly due to the increased effective mass of the band structure and DOS caused by the elevation of the Sn_p and Te_p states. The Seebeck coefficient S can be expressed using:43
 | (13) |
 and mobility
  Fig. 6(b) shows that the
  basically remains unchanged after Te off-centering. Thus, the steeper DOS below the Fermi level contributes to the Seebeck coefficient's improvement. Even the Seebeck value of p-type SnTe can reach 95.7 μV K−1 when the carrier concentration is 7 × 1019 cm−3 at 300 K, which is much higher than 66.1 μV K−1 when Te is in-centering.
We calculated the individual contribution scattering mechanisms through the acoustic ADP, POP, IMP mechanisms to clarify the scattering mechanisms of the electrical transport change with Te off-centering distortion. Fig. 7 shows that the order of contribution to electrical transport of PbTe and SnTe is polar optical phonon scattering (POP) > acoustic deformation potential scattering (ADP) > ionized impurity scattering (IMP). We observed that the primary scattering rate of POP in n-type PbTe and SnTe decreases with the Te off-centering distortion, leading to the PbTe and SnTe maintaining high electrical transport properties. This is due to the softened transverse optical phonon modes caused by the s2 lone pair causing a weak electron-TO phonon scattering (Fig. 5(b) and (c)). This leads to a low lattice thermal conductivity, but does not decrease the electronic conductivity.69,70 In addition, the atomic displacement can manipulate the electric field. A more intensive Coulomb potential field is also formed around the positive and negative ions, thus strengthening the IMP scattering. The stronger IMP scatters the holes and electrons, decreasing the mobility of MTe. However, the POP and ADP remain dominant in the scattering mechanisms of SnTe and PbTe with the off-centering distortion, which ensures that the electrical conductivity and mobility of n-type PbTe and SnTe remain almost unchanged. For p-type MTe, the Rashba band splitting tends to occur in the L valence band of MTe, leading to a mismatch of spin and momentum in the band edge of PbTe and SnTe with the Te off-centering distortion. This significantly intensifies the electron–phonon scattering and degrades its p-type electrical conductivity (as shown in Fig. 6 and S5†). The average electrical conductivity and mobility values were relatively higher than experimental data.66 The relaxation time τ can significantly impact the electronic properties. The theoretical calculation cannot predict the experiment's derivative reaction, such as the In and Cd related defect configuration in SnTe. The point defect scatters electrons and holes, thus decreasing the mobility and electric conductivity. However, by reasonably considering the carrier relaxation time, the momentum relaxation time approximation theory (MRTA) can calculate the mobility and conductivity more accurately than the constant relaxation-time approximation (CRTA) (Fig. S8†). According to the Wiedemann–Franz law Ke = LσT, where σ and L are the electronic conductivity and Lorentz's constant, the electronic thermal conductivity decreases.
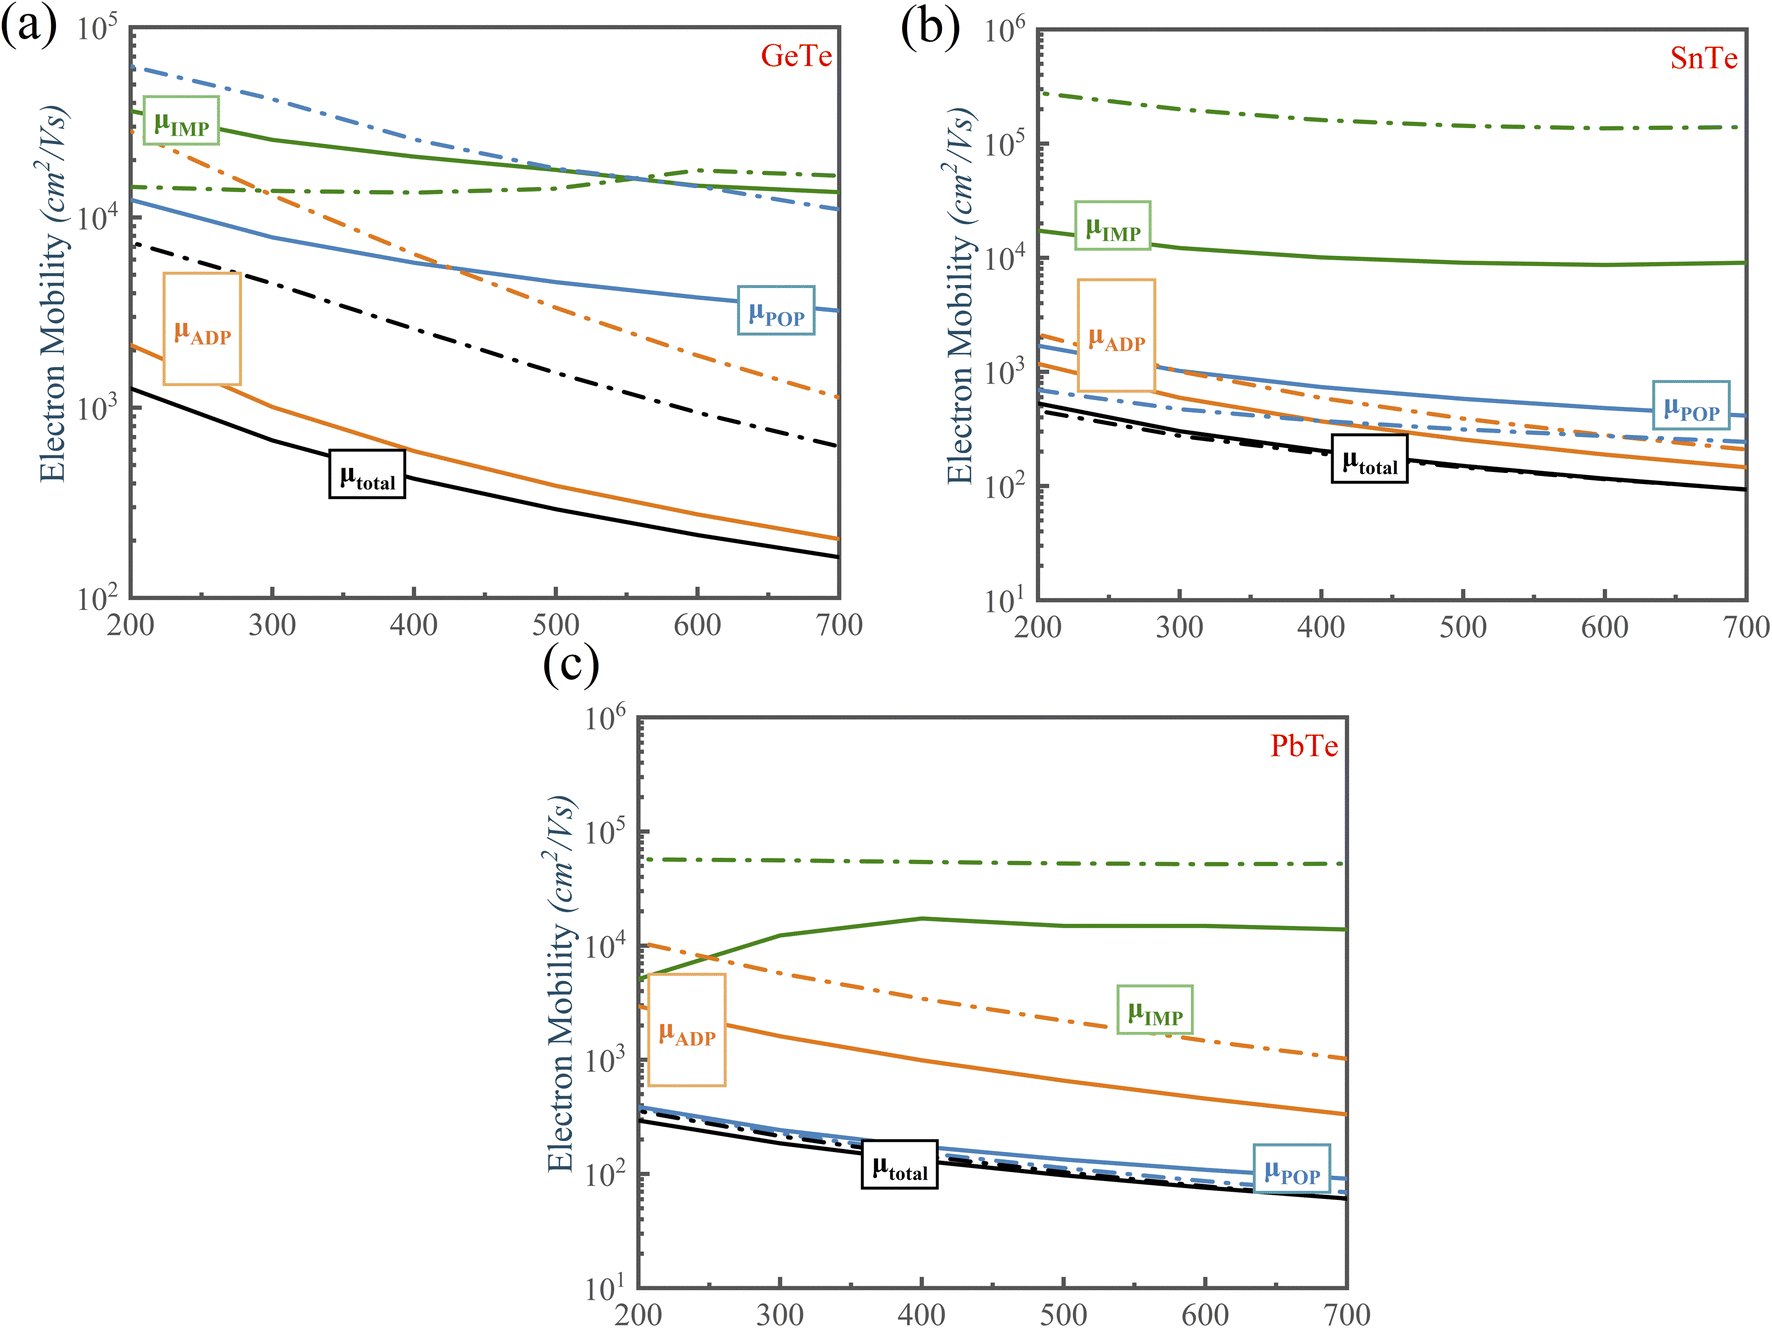 | ||
| Fig. 7 Electron mobility versus temperature for the doping concentration of n = 1 × 1019 cm−3 of n-type MTe. The solid and dashed lines represent the Te coordinate at (0.47, 0.47, 0.47) and (0.50, 0.50, 0.50), respectively. The black line is the calculated mobility including all scattering channels, while the colored lines correspond to the individual contributions of ADP, IMP and POP. | ||
For GeTe, the electrical conductivity and mobility of GeTe decrease with the Te off-centering (Figs. S6(b) and (d)†). That is because that the POP scattering in the carrier scattering can be neglected when Te is in-centering. However, the Te off-centering distortion changes the phonon dispersion, leading to more polar optical phonons to participate in the carrier scattering process. Furthermore, the Te off-centering distortion in GeTe impacts the lattice vibrations by introducing anharmonic bonds and erasing imaginary phonon modes, which strengthens the electron-acoustic phonon scattering of GeTe. Thus, we can observe that the scattering rate of ADP becomes larger, indicating that the Te off-centering distortion strengthens the scattering process between the carrier and acoustic phonon.71 Consequently, the electrical conductivity and mobility of GeTe inevitably decrease with Te off-centering. At 700 K, the electron mobility of p-type GeTe decreases from 470 cm2 V−1 s−1 to 141 cm2 V−1 s−1 when the carrier concentration is 1 × 1019 cm−3.
We have used the “maximum” thermoelectric figure of merit ZTe = S2σT/kel by ignoring the lattice contribution of thermal conductivity to evaluate the thermoelectric performance. Fig. 8 shows that the ZTe of MTe significantly increases with Te off-centering due to the high Seebeck coefficient caused by Rashba band splitting. The ZTe of p-type MTe significantly increases (for GeTe from 0.29 to 0.93, SnTe from 0.25 to 0.71, PbTe 0.95 to 2.47) when the carrier concentration is 3 × 1019 cm−3 at 300 K, which proves that the Rashba effect can significantly enhance the thermoelectric performance. In addition, the n-type MTe can achieve a much higher ZTe than p-type MTe because it maintains high electron mobility with Te off-centering distortion. The atomic displacement affects the phonon frequency and anharmonicity, which reduces the lattice thermal conductivity of MTe, and enhances the carriers' electron–phonon coupling. In SnTe, the weaker electron-TO phonon scattering caused by the softened transverse optical phonon modes guarantees the high electronic conductivity, combined with a high Seebeck coefficient, leading to superior thermoelectric performance and ZTe (from 3.07 to 4.22 when carrier concentration is 3 × 10¹⁹ at 300 K). The n-type GeTe also obtains higher ZTe (from 3.12 to 4.66) than p-type GeTe with Te off-centering distortion, while current research pays more attention to p-type GeTe and SnTe.
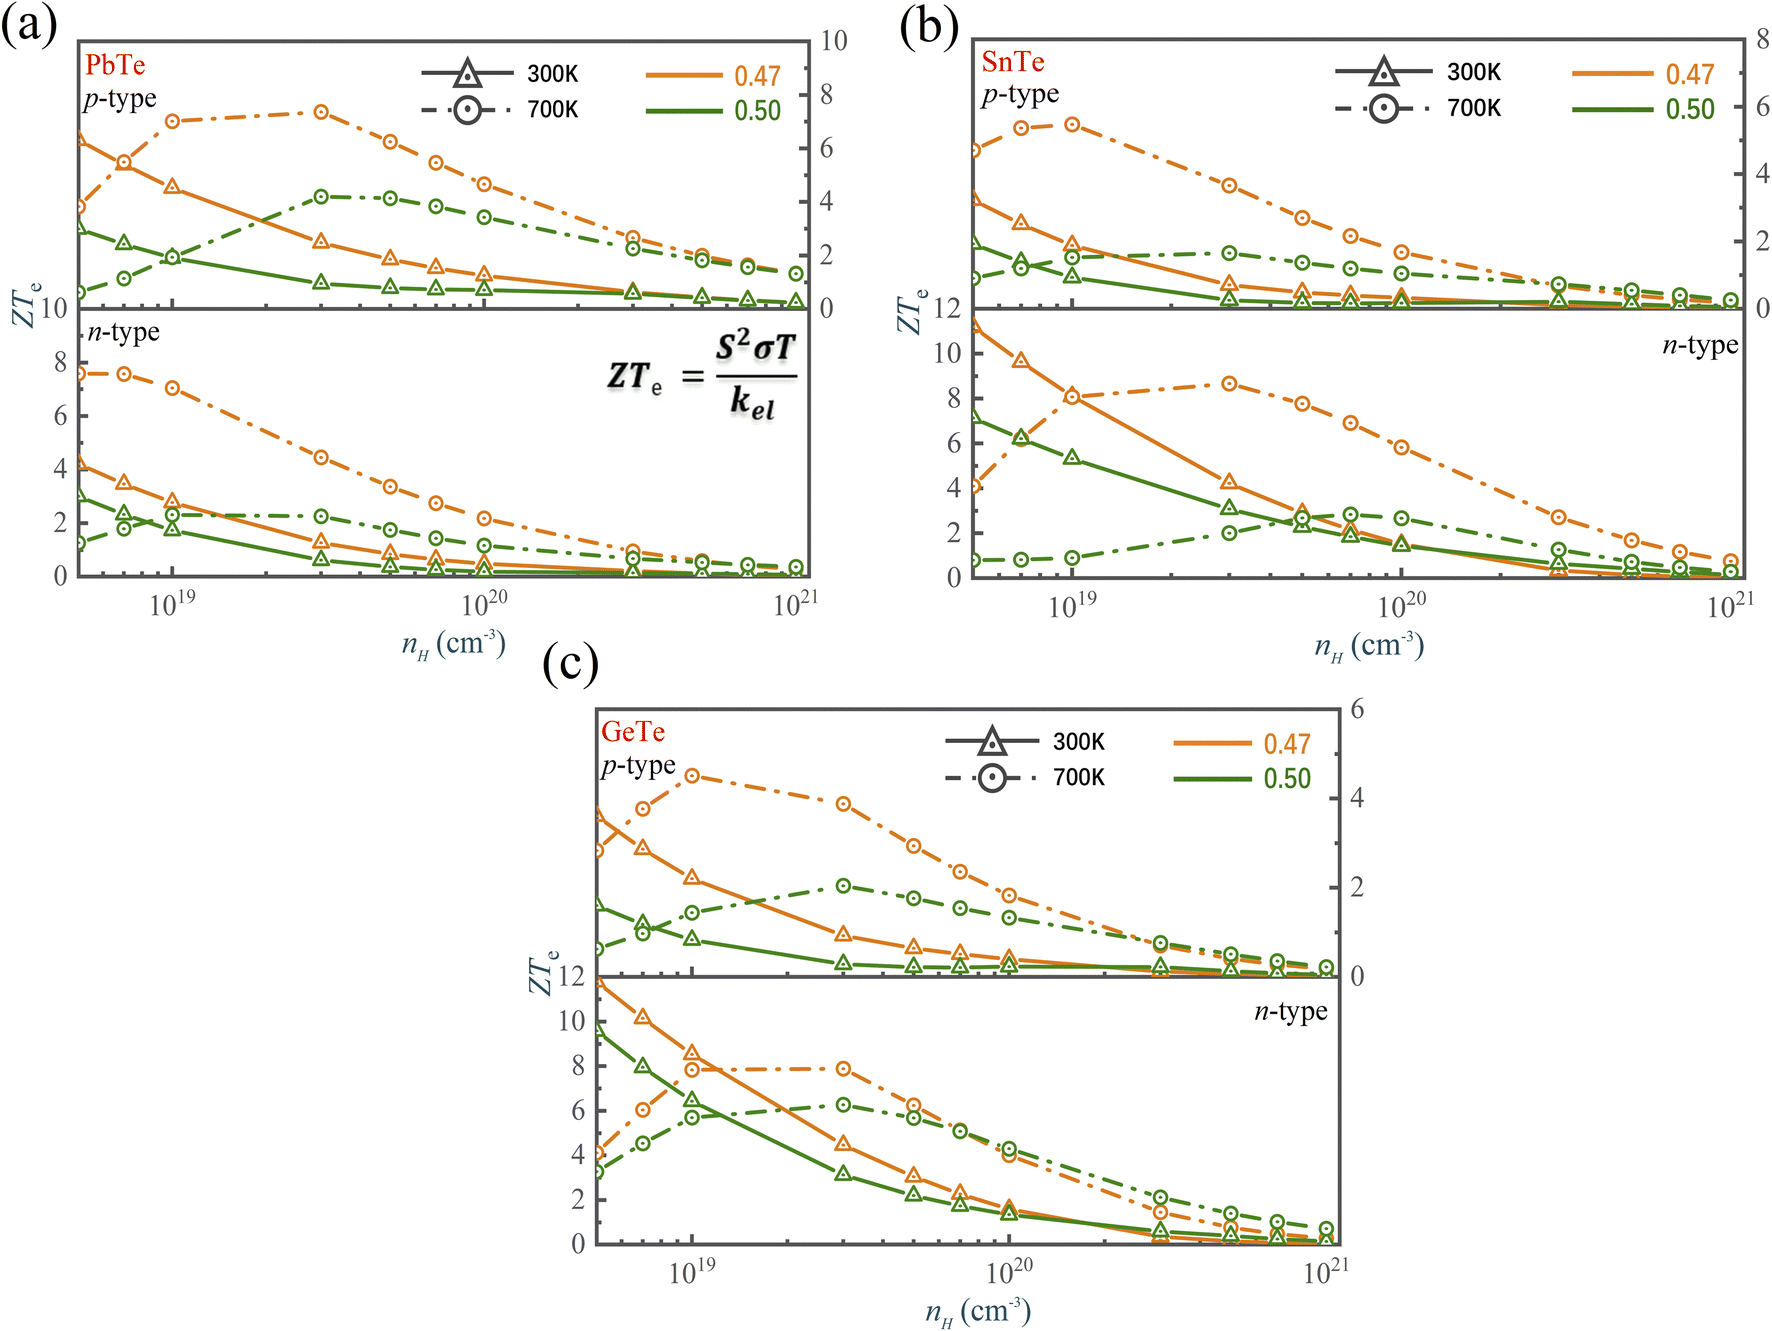 | ||
| Fig. 8 The ZTe of (a) PbTe, (b) SnTe and (c) GeTe as a function of the carrier concentration and atomic reciprocal displacement at 300 K and 700 K. | ||
4. Conclusions
To summarize, the rock salt structure MTe (M = Ge, Sn, Pb) has shown to be potential ferroelectric Rashba materials. The Te off-centering distortion promotes the original centrosymmetric structure MTe to exhibit macroscopic electric dipoles, resulting in Rashba spin-dependent shifts of energy dispersions. Further analysis of the band energy, lattice vibration and chemical orbital indicate the internal correlation between the s2 lone pair electron and atomic off-centering distortion. The s2 lone pair can exhibit its activity through Te off-centering local distortion, thereby manipulating the Rashba band splitting and band convergence of the L-band heavy Σ-band, which enhances the Seebeck coefficient. The temperature-dependent phonon dispersion shows that the atomic off-centering distortion creates dipole electrical fields and affects the lattice vibrations by introducing anharmonic bonds in the rock salt MTe. The disappearing imaginary phonon modes of GeTe caused by anharmonic bonds can intensify electron-acoustic phonon scattering, leading to a more extensive ADP scattering. Meantime, the s2 lone pair can strengthen the interplay between the local restoring force and long-range dipole in the centrosymmetric structures. This leads to the softened transverse optical phonon modes and reduced lattice thermal conductivities. The softened transverse optical phonon modes also cause weak electron-TO phonon scattering and undergo the POP scattering. This leads to a low lattice thermal conductivity, while not decreasing the electronic conductivity. This work provides physical insight into how the manipulation of Te off-centering distortion in rock salt MTe engineers its electronic structure and phonon dispersion, and further affects the electron–phonon scattering and scattering mechanism, which helps manipulate the electrical transport properties to achieve high thermoelectric merit (ZTe).Conflicts of interest
There are no conflicts to declare.Acknowledgements
J.-Y. Y. is grateful for the support from Shandong University (Qilu Young Scholar 89963031). L. L. acknowledges the support by the National Natural Science Foundation of China (Grant no. 52076123).References
- Z.-Z. Luo, S. Hao, X. Zhang, X. Hua, S. Cai, G. Tan, T. P. Bailey, R. Ma, C. Uher and C. Wolverton, Energy Environ. Sci., 2018, 11, 3220–3230 RSC.
- J. P. Heremans, M. S. Dresselhaus, L. E. Bell and D. T. Morelli, Nat. Nanotechnol., 2013, 8, 471–473 CrossRef CAS PubMed.
- M. G. Kanatzidis, Chem. Mater., 2010, 22, 648–659 CrossRef CAS.
- Y. Pei, X. Shi, A. LaLonde, H. Wang, L. Chen and G. J. Snyder, Nature, 2011, 473, 66–69 CrossRef CAS PubMed.
- Q. Zhang, F. Cao, W. Liu, K. Lukas, B. Yu, S. Chen, C. Opeil, D. Broido, G. Chen and Z. Ren, J. Am. Chem. Soc., 2012, 134, 10031–10038 CrossRef CAS PubMed.
- S. Aminorroaya Yamini, H. Wang, D. Ginting, D. R. Mitchell, S. X. Dou and G. J. Snyder, ACS Appl. Mater. Interfaces, 2014, 6, 11476–11483 CrossRef CAS PubMed.
- M. Hong, Z. G. Chen, L. Yang, Y. C. Zou, M. S. Dargusch, H. Wang and J. Zou, Adv. Mater., 2018, 30, 1705942 CrossRef PubMed.
- J. Li, Z. Chen, X. Zhang, Y. Sun, J. Yang and Y. Pei, NPG Asia Mater., 2017, 9, e353 CrossRef CAS.
- J. He, J. Xu, G.-Q. Liu, H. Shao, X. Tan, Z. Liu, J. Xu, H. Jiang and J. Jiang, RSC Adv., 2016, 6, 32189–32192 RSC.
- Y. Xiao and L.-D. Zhao, npj Quantum Mater., 2018, 3, 1–12 CrossRef CAS.
- M. Hong, Z. G. Chen, L. Yang, Y. C. Zou, M. S. Dargusch, H. Wang and J. Zou, Adv. Mater., 2018, 30, 1705941–1705942 CrossRef PubMed , 1705948.
- L. Yue, W. Cui, S. Zheng, Y. Wu, L. Wang, P. Bai and X. Dong, J. Phys. Chem. C, 2020, 124, 5583–5590 CrossRef CAS.
- L. Wu, X. Li, S. Wang, T. Zhang, J. Yang, W. Zhang, L. Chen and J. Yang, NPG Asia Mater., 2017, 9, e343 CrossRef CAS.
- A. Thompson, J. Sharp, C. J. Rawn and B. Chackoumakos, MRS Proceedings, 2007, 1044, 1044–U10031009 CrossRef.
- B. Wei, Q. Sun, C. Li and J. Hong, Sci. China: Phys., Mech. Astron., 2021, 64, 1–34 Search PubMed.
- J. K. Lee, M. W. Oh, B. S. Kim, B. K. Min, H. W. Lee and S. D. Park, Electron. Mater. Lett., 2014, 10, 813–817 CrossRef CAS.
- Z. Guo, Q. Zhang, H. Wang, X. Tan, F. Shi, C. Xiong, N. Man, H. Hu, G. Liu and J. Jiang, J. Mater. Chem. A, 2020, 8, 21642–21648 RSC.
- L. Xie, Y. Chen, R. Liu, E. Song, T. Xing, T. Deng, Q. Song, J. Liu, R. Zheng and X. Gao, Nano Energy, 2020, 68, 104347 CrossRef CAS.
- S. J. Mahdizadeh and E. K. Goharshadi, Electron. J. Nanopart. Res., 2014, 16, 1–12 CAS.
- Y. Lan, A. J. Minnich, C. Gang and Z. Ren, Adv. Funct. Mater., 2010, 20, 357–376 CrossRef CAS.
- X. Zhang, Z. Wang, B. Zou, M. K. Brod, J. Zhu, T. Jia, G. Tang, G. J. Snyder and Y. Zhang, Chem. Mater., 2021, 33, 9624–9637 CrossRef CAS.
- J.-Y. Yang, L. Cheng and M. Hu, Appl. Phys. Lett., 2017, 111, 242101 CrossRef.
- C. Liu, H. Gao, Y. Li, K. Wang, L. A. Burton and W. Ren, J. Mater. Chem. C, 2020, 8, 5143–5149 RSC.
- M. Hong, W. Lyv, M. Li, S. Xu, Q. Sun, J. Zou and Z.-G. J. Chen, Joule, 2020, 4, 2030–2043 CrossRef CAS.
- T. Wang, C. Zhang, J.-Y. Yang and L. Liu, Phys. Chem. Chem. Phys., 2021, 23, 23576–23585 RSC.
- L. Aggarwal, A. Banik, S. Anand, U. V. Waghmare, K. Biswas and G. Sheet, J. Materiomics, 2016, 2, 196–202 CrossRef.
- L. Orgel, J. Am. Chem. Soc., 1959, 3815–3819 RSC.
- W. Setyawan and S. Curtarolo, J. Materiomics, 2010, 49, 299–312 Search PubMed.
- K. Momma and F. Izumi, J. Appl. Crystallogr., 2008, 41, 653–658 CrossRef CAS.
- T. Chattopadhyay, J. X. Boucherle and H. G. Vonschnering, J. Phys. Chem. Solids, 1987, 20, 1431 CAS.
- T. Chatterji, C. Kumar and U. D. Wdowik, Phys. Rev. B: Condens. Matter Mater. Phys., 2015, 91, 054110 CrossRef.
- Y. Xiao, D. Wang, Y. Zhang, C. Chen, S. Zhang, K. Wang, G. Wang, S. J. Pennycook, G. J. Snyder and H. Wu, J. Am. Chem. Soc., 2020, 142, 4051–4060 CrossRef CAS.
- G. Kresse and J. Furthmüller, Comput. Mater. Sci., 1996, 6, 15–50 CrossRef CAS.
- J. P. Perdew, K. Burke and M. Ernzerhof, Phys. Rev. Lett., 1996, 77, 3865 CrossRef CAS PubMed.
- F. Vines, O. Lamiel-García, K. Chul Ko, J. Yong Lee and F. Illas, J. Comput. Chem., 2017, 38, 781–789 CrossRef CAS PubMed.
- S. Maintz, V. L. Deringer, A. L. Tchougréeff and R. Dronskowski, J. Comput. Chem., 2016, 37, 1030–1035 CrossRef CAS PubMed.
- A. Savin, R. Nesper, S. Wengert and T. F. Fässler, Angew. Chem., Int. Ed. Engl., 1997, 36, 1808–1832 CrossRef CAS.
- A. M. Ganose, J. Park, A. Faghaninia, R. Woods-Robinson, K. A. Persson and A. Jain, Nat. Commun., 2021, 12, 1–9 CrossRef PubMed.
- R. W. Ure Jr, Semiconductors and Semimetals, Elsevier, 1972, vol. 8, pp. 67–102 Search PubMed.
- G. K. Madsen, J. Carrete and M. J. Verstraete, Comput. Phys. Commun., 2018, 231, 140–145 CrossRef CAS.
- J.-Y. Yang, G. Qin and M. Hu, Appl. Phys. Lett., 2016, 109, 242103 CrossRef.
- A. Carreras, A. Togo and I. Tanaka, Comput. Phys. Commun., 2017, 221, 221–234 CrossRef CAS.
- X. Shi, L. Chen and C. Uher, Int. Mater. Rev., 2016, 61, 379–415 CrossRef CAS.
- Y.-H. Meng, W. Bai, H. Gao, S.-J. Gong, J.-Q. Wang, C.-G. Duan and J.-H. Chu, Nanoscale, 2017, 9, 17957–17962 RSC.
- B. B. Van Aken, T. Palstra, A. Filippetti and N. A. Spaldin, Nat. Mater., 2004, 3, 164–170 CrossRef CAS PubMed.
- U. Waghmare, N. Spaldin, H. Kandpal and R. Seshadri, Phys. Rev. B, 2003, 67, 125111 CrossRef.
- H. Wang, P. Gopal, S. Picozzi, S. Curtarolo, M. Buongiorno Nardelli and J. Sławińska, npj Comput. Mater., 2020, 6, 1–7 CrossRef.
- L. Orgel, J. Chem. Soc., 1958, 4186–4190 RSC.
- D. C. Wallace, Am. J. Phys., 1972, 40, 1718–1719 CrossRef.
- M. Markov, J. Sjakste, N. Vast, B. Perrin and L. Paulatto, J. Phys.: Conf. Ser., 2020, 012165 CrossRef CAS.
- W. Zhang, C. Zheng, Y. Dong, J.-Y. Yang and L. Liu, Phys. Chem. Chem. Phys., 2020, 22, 28086–28092 RSC.
- M. D. Nielsen, V. Ozolins and J. P. Heremans, Energy Environ. Sci., 2013, 6, 570–578 RSC.
- X. Zhang, Q. Liu, J.-W. Luo, A. J. Freeman and A. Zunger, Nat. Phys., 2014, 10, 387–393 Search PubMed.
- Y. Zhang, X. Ke, P. R. Kent, J. Yang and C. Chen, Phys. Rev. Lett., 2011, 107, 175503 CrossRef PubMed.
- P. Littlewood, Acta Mater., 1980, 13, 4855 CAS.
- S. Lee, K. Esfarjani, T. Luo, J. Zhou, Z. Tian and G. Chen, Nat. Commun., 2014, 5, 1–8 Search PubMed.
- Z. Liu, Y. Zhang, J. Mao, W. Gao, Y. Wang, J. Shuai, W. Cai, J. Sui and Z. Ren, Acta Mater., 2017, 128, 227–234 CrossRef CAS.
- C. Kittel, P. McEuen and P. McEuen, Introduction to solid state physics, Wiley, New York, 1996 Search PubMed.
- S. Fratini and P. Quémerais, Eur. Phys. J. B, 2002, 29, 41–49 CrossRef CAS.
- E. S. Božin, C. D. Malliakas, P. Souvatzis, T. Proffen, N. A. Spaldin, M. G. Kanatzidis and S. J. Billinge, Science, 2010, 330, 1660–1663 CrossRef PubMed.
- K. Knox, E. Bozin, C. Malliakas, M. Kanatzidis and S. Billinge, Phys. Rev. B, 2014, 89, 014102 CrossRef.
- K. Mitrofanov, A. Kolobov, P. Fons, M. Krbal, T. Shintani, J. Tominaga and T. Uruga, Phys. Rev. B, 2014, 90, 134101 CrossRef.
- L. Aggarwal, J. S. Sekhon, S. N. Guin, A. Arora, D. S. Negi, R. Datta, K. Biswas and G. Sheet, Appl. Phys. Lett., 2014, 105, 113903 CrossRef.
- Y. Pei, H. Wang and G. J. Snyder, Adv. Mater., 2012, 24, 6125–6135 CrossRef CAS.
- H. Goldsmid and D. M. Rowe, CRC Handbook of Thermoelectric: Conversion Efficiency and Figure-of-Merit, ed. D. M. Rowe, CRC Press, London, 1995, vol. 19–42 Search PubMed.
- G. Tan, F. Shi, S. Hao, H. Chi, L.-D. Zhao, C. Uher, C. Wolverton, V. P. Dravid and M. G. Kanatzidis, J. Am. Chem. Soc., 2015, 137, 5100–5112 CrossRef CAS PubMed.
- G. A. Slack, CRC handbook of thermoelectrics, 1995, pp. 407–440 Search PubMed.
- Ö. C. Yelgel and G. Srivastava, Phys. Rev. B, 2012, 85, 125207 CrossRef.
- J. Cao, J. D. Querales-Flores, A. R. Murphy, S. Fahy and I. Savić, Phys. Rev. B, 2018, 98, 205202 CrossRef.
- A. Pishtshev, arXiv preprint arXiv:1002.0294, 2010.
- D. Guo, H. Zhang, Z. Xu, C. Li, K. Li, B. Shao, D. Chen, Y. Ma and J. Sun, J. Alloys Compd., 2022, 893, 162296 CrossRef CAS.
Footnote |
| † Electronic supplementary information (ESI) available. See https://doi.org/10.1039/d2ra05139g |
| This journal is © The Royal Society of Chemistry 2022 |