 Open Access Article
A green fluorescence turn-off system for meclofenoxate determination by Cilefa Pink B dye†
Ahmed Abdulhafez Hamad *
*
Department of Pharmaceutical Analytical Chemistry, Faculty of Pharmacy, Al-Azhar University, Assiut Branch, Assiut 71524, Egypt
First published on 20th September 2022
Abstract
Because of their high extinction indices, high quantum yields, and propensity to attach to biomolecules, xanthene dyes, and related compounds have attracted more attention for analytical drug labelling and monitoring. The halogen-substituted xanthene dye, Cilefa Pink B, has also been adapted for usage in the food and pharmaceutical industries as well as for diagnostic purposes. Cilefa Pink B dye is a promising reagent for the quantitative analysis of numerous analytes due to its natural fluorescence characters. MFX is a powerful antioxidant serving as a nootropic agent, motivating glucose uptake and oxygen levels and improving metabolic energy in the brain. The first novel fluorimetric method for quantifying the cerebral circulatory enhancer meclofenoxate is presented in this article. This study used a green, single-pot, and direct fluorimetric strategy to quantify and validate meclofenoxate. A rapid association complex was designed using meclofenoxate and the Cilefa Pink B dye in a weakly acidic solution. The fluorometric assay was performed based on the turn-off effect of meclofenoxate on the fluorescence magnitude of the bio pigment (Cilefa Pink B) at 556.5 nm. The linearity is within the range of 0.08–1.9 μg mL−1. Regarding all system parameters, meclofenoxate–Cilefa Pink B coupled complexes were regulated analytically. The system was compliant with ICH guidelines as well. Meclofenoxate in indicated therapy dosage forms was successfully recovered using the designed procedure. The planned fluorescence detection approach has also been effectively utilized to monitor the analyte of interest in its crude and commercial forms. Additionally, the reaction kinetics were studied further, and the product was characterized and confirmed spectroscopically. An eco-scale was applied to rate the environmental friendliness of the designed method.
Introduction and background
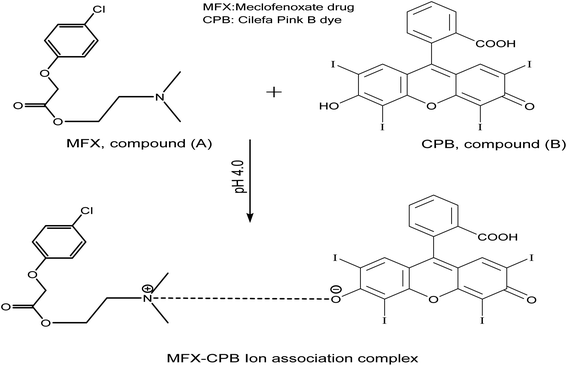
Recently, xanthene dyes and related compounds have received a lot of interest for use in marking and tracking analytes.The halogen-substituted xanthene as Cilefa Pink B has been modified for use as a laser dye, a food dye, and a clinical and pharmaceutical diagnostic. The preferential protein binding and inherent photoluminescence of CPB make it an attractive reagent for the quantitative assessment of proteins in biological materials. Interactions using CPB as a probe have been documented with a wide range of analytes, including oxygen content,1 vitamin B6,2 and urine protein.3 From an analytical standpoint, proteins4,5 and other medicinal substances6–10 have all been identified with the help of biological dyes based on xanthene. Cilefa Pink B dye is structurally 2,4,5,7-tetraiodo-fluorescein8 (Fig. 5[B]). Proteins high in lysine and arginine were labelled as “eosinophilic” with a dark red or pink stain. Formerly, these methods relied on the formation of an ion-association complex binding the dye to the base chemicals. CPB's intrinsic fluorescence was suppressed by a chemical due to the intricacy of the system. This response represents a quantitative measure of the centrally-located analyte.
A powerful nootropic drug, meclofenoxate hydrochloride (MFX, Fig. 5[A]), also known as centrophenoxine hydrochloride, is an ester of p-chlorophenoxyacetic acid and dimethylaminoethanol. It functions as an antioxidant, promotes glucose absorption and oxygen consumption, and increases mental energy metabolism. Pathological conditions such as cerebral ischemia, dementia, aluminium toxicity, brain traumas, and chronic alcoholism respond to MFX treatment.11 Meclofenoxate is formally named: 2-(4-chlorophenoxy)-acetic acid, 2-(dimethylamino)ethyl ester, monohydrochloride, which is shortly defined as dimethylaminoethyl 4-chlorophenoxyacetate. The psychostimulant meclofenoxate was used mainly to treat mental changes in the elderly. MFX was determined through its crude and manufactured forms for its therapeutic value. An investigation of MFX's presence in raw materials or pharmaceuticals has been documented in the literature. MFX in crude or prescribed formulations can be analyzed using various methods. However, there are just a few publications on how MFX concentrations can be determined using various methods such as electrochemistry,12–14 proton magnetic resonance spectroscopy,15 HPLC,16–18 resonance Rayleigh scattering method accompanied with flow injection procedure,19 radiochemistry,20 microcalorimetry21 DSC and 1H-NMR.22 To our knowledge, and as shown from the literature, no fluorimetric technique has been referenced to determine MFX.
In the interest of using MFX securely and scientifically and getting a better curative effect, it is crucial to develop a simple, rapid, and sensitive method for determining MFX. Spectrofluorimetric procedures have various advantages because of their simplicity, specificity, and heightened sensitivity. However, no fluorimetric technique has yet been published for evaluating MFCX. As a result, spectrofluorimetric analysis of the meclofenoxate, an anti-ischemic agent, is essential. The spectrofluorimetric method accomplishes these objectives by tying the drug under study to the self-fluorescent pigments in a hydrogenating medium. The designed technique has been validated according to ICH criteria.23 Pharmaceutical preparations and MFX in bulk were accurately and quickly quantified.
Materials and methods
Chemicals such as acetone, acetonitrile, alcohol, methanol, and dimethylformamide were obtainable from El Nasr Co. for Interme Chem in Cairo, Egypt.CPB (0.015% w/v) was supplied from Market Harborough, Leicestershire, United Kingdom, and dismantled in distilled water.
The stock concentration of meclofenoxate hydrochloride was 20.0 μg mL−1.
Luciforte powder is a product of Lipha sante-France was utilized as a representative MFX reference material. All of the standard solutions of MFX were prepared from this product. The product is supplied as a freeze-dried powder. Lucidril® f.c tablet (branded to contain 500 and 250 mg per tab, Batch No. MCE0970 and JBE0461 respectively) and vial (500 mg per vial, Batch No. LHE2619). The products used were manufactured by Minapharm Co. for Pharmaceuticals & Chemical Industries (10th of Ramadan City, Egypt) and were shopped from a local pharmacy.
All medicinal substances and chemicals were tested in their unprocessed form. Every day, a new batch of solutions was created. Doubly distilled water was employed throughout the experiment.
Medium-pH controlling solutions
Britton–Robinson,24 Teorell–Stenhagen25 (pH from 2.0 to 12.0), McIlvaine (pH from 2.2 to 8.0),26 and acetate buffer (pH from 3.6 to 5.6) controlling solutions were included to check the solution's pH.47Working solutions preparation
The standard parent solution of MFX was prepared by loading the volumetric flask with 20 mg of MFX, blending it in an appropriate quantity of distilled water, and then topping it off with the same liquid giving a father solution of 200 μg mL−1. As a result, a standard operating liquid was made by diffusing the required quantity of the above solution in distilled water. The liquids were stored in a cold chamber.Instrumental and methods
![[thin space (1/6-em)]](https://www.rsc.org/images/entities/char_2009.gif) :
:![[thin space (1/6-em)]](https://www.rsc.org/images/entities/char_2009.gif) 1.0, 0.1
1.0, 0.1![[thin space (1/6-em)]](https://www.rsc.org/images/entities/char_2009.gif) :
:![[thin space (1/6-em)]](https://www.rsc.org/images/entities/char_2009.gif) 0.9, …, 0.9
0.9, …, 0.9![[thin space (1/6-em)]](https://www.rsc.org/images/entities/char_2009.gif) :
:![[thin space (1/6-em)]](https://www.rsc.org/images/entities/char_2009.gif) 0.1, 1.0
0.1, 1.0![[thin space (1/6-em)]](https://www.rsc.org/images/entities/char_2009.gif) :
:![[thin space (1/6-em)]](https://www.rsc.org/images/entities/char_2009.gif) 0). The general procedure has adhered. In parallel, references were made and measured. The tested drug's mole fractions were plotted against the corresponding adjusted fluorescence magnitude (ΔF).
0). The general procedure has adhered. In parallel, references were made and measured. The tested drug's mole fractions were plotted against the corresponding adjusted fluorescence magnitude (ΔF).Results and discussion
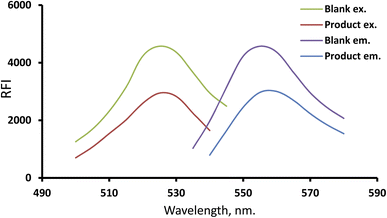
The use of xanthene dyes and related compounds has grown significantly for labelling and monitoring applications because of their high extinction indices, high quantum yields, and affinity to bind to biomolecules. MFX's tertiary amino group can be protonated in an acidic environment. This allows for the ion-pair complex formation involving CPB and MFX. Because MFX suppresses dye intrinsic emission upon complexity, we can use the resulting “Turn-off fluorescence system” to precisely measure MFX (Fig. 1). The inhibition of the fluorescence response was linearly proportional to the analyte quantity at a concentration from 0.08 to 1.9 μg mL−1, making it a simple and sensitive method for analyte screening. The reagents are inexpensive, and the device is widely available throughout most quality control research labs, causing this a cost-effective application.The designed system spectrum
CPB (a xanthene stain representative example) was utilized in the estimation process to quantify many compounds and drugs by lowering its intrinsic emission strength. Due to the CPB's intrinsic fluorescence at 556.5 nm, MFX may quantitatively lower it, so it is viable to assay the analyte (Fig. 1). The quantitative experimental spectrum for the fluorescent spectra at different concentrations of the investigated drug was provided (ESI Fig. 1†).The mechanism of the complex formation
Many nitrogen-containing drugs have been documented to inhibit the inherent emission magnitude of CPB, fluorescein, and eosin (xanthene-based dyes).8,9 A binary complex can be generated by employing an ion-coupling between MFX (with a basic nitrogenous core) and the CPB reagent in moderately acidic environments (Fig. 5).Based on the pH of the solution, the CPB molecule can take one or more of the following forms:
 | (1) |
R represents the charged component of CPB. The dye's pKa1, pKa2, and pKa3 values were 2.10, 2.85, and 4.95, respectively.28 If the media is slightly acidic, the predominant form of CPB (HR−) is the monovalent species. The carboxylic and hydroxyl groups of CPB are ionisable. Hydroxyl ionization is easier than carboxylic ionization because two potent electron-withdrawing radicals (iodine atoms) are nearby.29,30 As a result of this ionization, CPB contains a single monovalent hydroxyl group. Cationization of the MFX molecule's tertiary amino group in an acidic environment is easily achieved, yielding the cationic form that is positively charged. Ion-pair complexes are formed when the amino group of hydrogenated MFX and mono anion CPB (through hydroxyl groups) form electrostatic and hydrophobic interactions.31
Discussion and management of the experiment's factors
The reaction items affecting the system's signal were investigated and modified to achieve the best possible scores for these spectroscopic measurements.The effects of pH and buffer volume
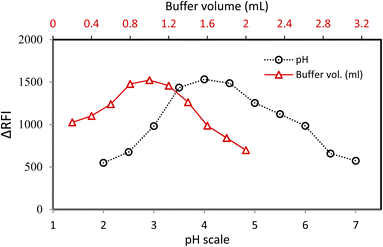
The pH scale of 2.0–7.0 was checked to explore the possibility of MFX–CPB binary complex's formation. The sample pH had a significant impact on the MFX–CPB complex. The strongest RFI amplitudes were found at 3.5–4.5 on the pH scale for the intended system. After changing the pH, the RFI measurements reduced considerably (Fig. 2). At pH of range 3.5–4.5, the monovalent species of CPB, (HR−) is the predominant, thus; CPB can be ionised easily producing either carboxylate form (if the carboxyl was ionized) or phenate form (if the hydroxyl group was ionized). But, the closeness of two powerful electron-withdrawing radicals (iodine atoms) makes hydroxyl ionisation simpler than carboxyl ionisation. This ionisation results in CPB having only a single hydroxyl group. Also, in this acidic environment, the positively charged cationic version of the MFX molecule by tertiary amino group cationization is chemically logic and easy. The amino group of hydrogenated MFX and the monoanion CPB (through ionized hydroxyl group) create ion-pair complexes by electrostatic and hydrophobic interactions.The buffer volume significantly impacted the MFX–CPB complex's growth, and the optimal pH level was 4.0 in this investigation. The acetate buffer solution was employed in quantities ranging from 0.2 to 2.0 millilitres to examine the MFX–CPB binary complex. The most strong response (reduction in dye emission) was achieved with a buffer volume of 0.8–1.2 mL. Excessive variations in volume yielded a decrease in response values. To keep the pH stable, the buffer volume needs to be suitable because if the buffer is too large, the anionic dye will compete with the positive constituent of the buffer for coupling, hindering the complex formation process. Considering these considerations, the ideal volume for this system was 1.0 millilitres (Fig. 2).
CPB dye volume and reaction time effects
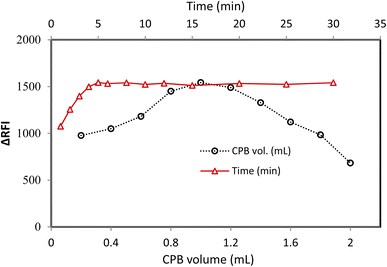
It was necessary to experiment with various quantities of CPB reagent (0.015% w/v) to record the best possible signal from the applied method. The fluorescence quenching power of CPB solution at 0.015% w/v in 1.0 mL was the strongest. The incomplete reaction, as depicted in Fig. 3, led to a poor response at low concentrations of CPB. A higher CPB concentration resulted in a lower effect owing to CPB self-agglomeration.At ambient temperature, the MFX–CPB was formed and completed quickly. After five minutes, all measurements were performed so that the complex constituents could contact each other and ensure that the complex formation would proceed (Fig. 3).
The dispersing liquid impact
Many dispersing solvents were tested, including alcohols (ethanol, methyl, and propanol-2-ol), dioxane, and distilled water (Fig. 4). When distilled water was employed as the distributing liquid, fluorescence inhibition records were at their highest. The poor measure scores obtained with the organic medium in this investigation could be attributable to the solvents' detrimental impact on the resulting complex. The fluorescence sign may be modified using certain solvents, disrupting the complex system. Short-chain solvents, such as ethanol and methanol dissolve in water and disturb the complex formation process, which is particularly problematic in watery environments. The complexation process is impaired at high levels of alcohol, and the complex may be substantially damaged.32 Unfortunately, it was discovered that pure water was the most effective liquid for dilution; thus, this was lucky regarding the procedure's greenness. The polarity and dielectric constant scores for water (9 and 80.2 respectively) are superior to the other solvents.33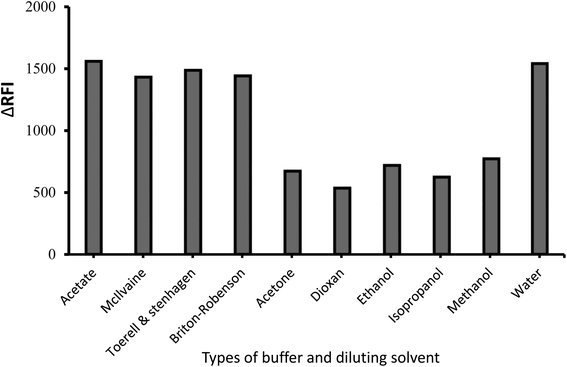 | ||
| Fig. 4 Impact of buffer type and diluting solvent on the emission quenching magnitude of the ion-coupling complex developed between MFX (1.0 μg mL−1) and CPB. | ||
Because most of the system's components dissolve in water, the system will likely be completely miscible. The system's formation may be hindered by the low miscibility of various organic solvents with variable dielectric constants.10
Selection of the pH's controlling solution
Some buffer kinds were tried in 1.0 mL volumes to score the highest signal from the current procedure. Acetate solution produced better signals and more bearable results than other buffers (McIlvaine, Toerell–Stanhagen, and Britton–Stanhagen). So, as a result, it served as the option's buffer (Fig. 4).The ratio of the included reactants
Using Job's plotting method, the molar ratio of the ion-coupled complex was calculated. The analyte and the dye were dosed at different complementary ratios of an equal concentration to maintain the overall molarity constant. Analyses were executed in the same order as the experiments. Job's plots depicted a correlation between a drug's mole fraction and its corresponding response. Fig. 6 shows that a mole fraction of roughly 0.5 produced the best results in the plots. This score suggested that a drug: reagent combination of 1![[thin space (1/6-em)]](https://www.rsc.org/images/entities/char_2009.gif) :
:![[thin space (1/6-em)]](https://www.rsc.org/images/entities/char_2009.gif) 1 be established. One tertiary amino group could be attached to one dye molecule based on this ratio, which signals and approves the existence of the medicine.
1 be established. One tertiary amino group could be attached to one dye molecule based on this ratio, which signals and approves the existence of the medicine.
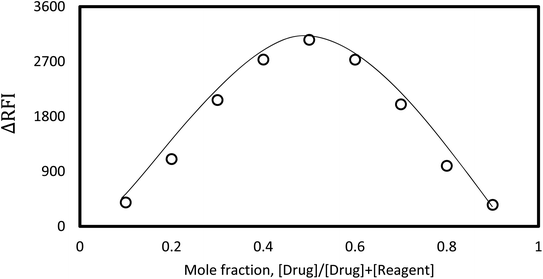 | ||
| Fig. 6 Job's plot for ion-coupling complex formation for the designed system using the same concentration of master solutions. | ||
Stern–Volmer formula and quenching kinetic study
The Stern–Volmer formula34 (eqn (1), ESI Table 7†) was used to explain the quenching mechanism of CPB caused by FFD.The fluorophore's lifetime in the excited state (about 0.089 ns![[thin space (1/6-em)]](https://www.rsc.org/images/entities/char_2009.gif) 35 or 89 ps
35 or 89 ps![[thin space (1/6-em)]](https://www.rsc.org/images/entities/char_2009.gif) 36), the Stern–Volmer dynamic suppressing constant (KSV), and the bimolecular suppressing rate constant (kq) all play a role in this equation. The relative fluorescence amplitudes of the dye and analyte–dye are denoted by the letters F0 and F.
36), the Stern–Volmer dynamic suppressing constant (KSV), and the bimolecular suppressing rate constant (kq) all play a role in this equation. The relative fluorescence amplitudes of the dye and analyte–dye are denoted by the letters F0 and F.
The quenching rate constant, kq, confirmed that the complex had formed (eqn (2), ESI Table 7†).
The plot of F0/F for CPB and MFX is presented at temperatures of 35, 45, and 55 °C (308, 318, and 328 K). KSV and Kq are the outcomes of linear regressions using experimental data.
Straight-line correlation between results and dose of interest was found in the (ESI: 2†) figure. Creating a ground-state complex caused the quenching of the dye's fluorescence.
MFX inhibitory mechanisms are not expected to be inhibited by dynamic collisions, but by the complexation process, according to the study's findings. It is generally known that the Stern–Volmer equation can be employed for both dynamic and static quenching mechanisms. Unlike dynamic quenching processes, static inhibition processes will possess a Stern–Volmer slope (KSV) dependent on CPB concentration. This shows that suppression is the product of a complexation process, not a dynamic activity. In addition, the fluorescence data were investigated using a modified Stern–Volmer equation37 (eqn (3), ESI Table 7†).
The suppression constant (Ka) is the amount of initial fluorescence that can be quenched by the quencher (fa). (ESI: 3†) clearly shows a straight-line correlation between F0/ΔF and the quencher dose in inverted form; (1/[M]). The data confirmed a static quenching process, demonstrating a linear relationship between the medication and dye.
Binding constant and binding site(s) evaluation
A considerable association exists between therapeutic agents' ability to bind and the medications' stability and danger during the therapy course. The drug–protein combination serves as an excellent model for studying the various ways that drugs and proteins might interact. The binding constant scores for MFX and CPB were calculated from fluorescence amplitude data. The equilibrium between nonbounded and bounded moieties can be calculated from the equation (eqn (4), ESI Table 7†).9When plotting [(fo − f)/f] versus log[M], the slope is equal to n, and the Y-axis intercept is equal to log![[thin space (1/6-em)]](https://www.rsc.org/images/entities/char_2009.gif) K since the linking constant (K) and the number of linking sites (n) are the same for the reaction in the static quenching models in eqn (1).†
K since the linking constant (K) and the number of linking sites (n) are the same for the reaction in the static quenching models in eqn (1).†
The closeness of n value to one (1.05) indicates that the medication has only one binding site for CPB when interacting with the CPB (ESI: 4†). For medicine to reach its target receptor quickly and easily, it must be able to bind to CPB in the bloodstream. A typical binding constant for reversible protein binding is around 7.071 × 10⁴ L mol−1.38 Therefore, the K value indicates that MFX and CPB form a reversible MFX–CPB complex based on the K value.
Thermodynamic study and binding forces
Biomolecular interactions can occur via hydrophobic, van der Waals, or electrostatic forces between a big biological molecule and a small organic one. Ross and Subramanian have detailed the thermodynamic parameters (ΔH and ΔS) of several types of protein coupling processes.39,40 Hydrophobic contact is the prevailing force if both ΔH and ΔS are greater than zero. If ΔH and ΔS are smaller than zero, the significant forces are van der Waals and hydrogen-bonding interactions. Electrostatic forces take primacy when ΔH is negative, and ΔS is positive. If the temperature varies just a tiny amount, the alteration in enthalpy (ΔH) can be assumed as a given following the van't Hoff formula (eqn (5), ESI Table 7†).MFX–CPB binding thermodynamic characteristics were estimated, where R represents the gas constant, KT is the coupling constant, and T is the temperature (in kelvin scale).
MFX–CPB binding thermodynamic parameters were calculated using the van't Hoff equation, and the implications of this conclusion have been studied.
The slope of the van't Hoff connection is used to compute the change in enthalpy (ΔH). Here is a formula that can be used to estimate G (eqn (6), ESI Table 7†).
To derive the thermodynamic criteria, the binding constants at three distinct temperatures were plotted on a linear van't Hoff chart (ESI: 5†).
The van't Hoff equation was used to plot ln![[thin space (1/6-em)]](https://www.rsc.org/images/entities/char_2009.gif) K and the inverse of T (1/T) to produce a straight line. The thermodynamic criteria for the MFX and CPB interface reveal that MFX binding occurs spontaneously, as demonstrated by the negative free energy (ΔG) and entropy (ΔS) changes. Enthalpy change (ΔH) to the positive value shown by increased K values with increasing temperature shows that this binding is endothermic.
K and the inverse of T (1/T) to produce a straight line. The thermodynamic criteria for the MFX and CPB interface reveal that MFX binding occurs spontaneously, as demonstrated by the negative free energy (ΔG) and entropy (ΔS) changes. Enthalpy change (ΔH) to the positive value shown by increased K values with increasing temperature shows that this binding is endothermic.
Using the formula: ΔG° = −2.303RT![[thin space (1/6-em)]](https://www.rsc.org/images/entities/char_2009.gif) log
log![[thin space (1/6-em)]](https://www.rsc.org/images/entities/char_2009.gif) Kd, where R denotes gas constant (8.314 J K−1 mol−1), T: temperature (in kelvin scale), and Kd signifies linking constant, one can calculate Gibb's free energy value (ΔG°). Gibb's free energy value for the anticipated reaction was −26.61 kJ mol−1. This significant negative free energy value at ambient temperature suggests that the system's signal is both immediate and realistic.
Kd, where R denotes gas constant (8.314 J K−1 mol−1), T: temperature (in kelvin scale), and Kd signifies linking constant, one can calculate Gibb's free energy value (ΔG°). Gibb's free energy value for the anticipated reaction was −26.61 kJ mol−1. This significant negative free energy value at ambient temperature suggests that the system's signal is both immediate and realistic.
The product confirmation
Both the crude drug sample and the drug-dye product were analyzed using FTIR spectroscopy to validate and characterize the functional groups present. The FTIR spectra from the MFX confirmed that some group's peaks were missed from the final IR spectrum. This demonstrated that a whole new product might be created from the previously existing elements. The creation of the complex was confirmed by spectroscopic analysis of the medication, the dye, and the final product. In conclusion, the newly produced product has modified features that are unrelated to the starter drug, MFX. Since there was no detectable amino peak in the molecule, it was concluded that the LVS amino group was either not present or else occupied by the CPB dye (ESI: 6†).Validation of the method
The designed fluorimetric technique was checked regarding ICH criteria.23 Many criteria, including linearity and range, precision, accuracy, and ruggedness, were examined as part of the validation process.Linearity and sensitivity
MFX solutions were analyzed using a spectrofluorimetric device. MFX concentration-dependent calibration chart was created by plotting FI scores against the MFX dose in μg mL−1 unit terms. The new method's response varied linearly from 0.08 to 1.9 μg mL−1. Table 1 shows the results of a linear decline analysis applied to the stated technique.| Parameter | Value |
|---|---|
| Linear range (μg mL−1) | 0.08–1.9 |
| Slope | 1431.8 |
| Intercept | 79.12 |
| SD of intercept (Sa) | 10.02 |
| Correlation coefficient (r) | 0.99972 |
| Determination coefficient (r2) | 0.99968 |
| Limit of quantitation (μg mL−1) | 0.069 |
| Limit of detection (μg mL−1) | 0.0243 |
Formulas were used to assess the method's sensitivities, such as the LOQ and LOD.
 | (2) |
This formula uses SD as the intercept standard deviation and S as the line's slope. The LOD and LOQ yields were 0.023 and 0.069 μg mL−1 when the data analysis was applied (Table 1).
Precision and accuracy
The spectroscopic method was tested at three dose levels (0.5, 1.0, and 1.5 μg mL−1) to determine its accuracy. The recovered % and the relative error are the two most famous metrics for evaluating accuracy. Table 2 indicates the method's high degree of accuracy.The designed system was also utilized to evaluate the current system's inter-day and intra-day precision at dosages of 0.5, 1.0, and 1.5 μg mL−1. The RSD score was employed to evaluate the spectroscopic technique's precision in this criterion. Table 3 shows that the present approach has good precision, with RSD scores under 2% (both levels).
The testing of the system's adaptability (robustness)
Various system parameters, including pH, CPB solution volume, and reaction rate, were examined to evaluate if the designed spectroscopic technique could cope with light alteration in these components. The technique's robustness was determined using these metrics. Fluorescence quenching readings were unaffected by the slight modifications validating the spectrofluorimetric application's tolerance to minor alterations (Table 4).Selectivity and interference
The impacts of several pharmaceutical additives (mentioned in Table 5) were evaluated to test the proposed method's selectivity.MFX (1.0 μg mL−1) containing solutions in the presence of pharmaceutical additives (10 μg mL−1) were tested using the proposed approach. As shown in Table 5, none of the tested excipients interfered noticeably with the method's output.
Evaluation of available market formulations
The published spectroscopic approach was used to examine the prescription MFX tab and vial formulations of Lucidril® and Luciforte®. The spectrofluorimetric approach41 was used to test the identical dose formulations. Equilibration of the reported technique with the designed system was achieved using the t and F-statistical tests. The t- and F-values were obtained at a confidence level of 95% using the disclosed approach, and the recommended spectroscopic system had no apparent difference in accuracy or precision (Table 6).| Dosage forms | % Recoverya ± SDb | t-Test | F-Value | |
|---|---|---|---|---|
| Proposed method | Reported method | |||
| a Average of 5 determinations.b Tabulated values at 95% confidence limit are t = 2.306, F = 6.338. | ||||
| Lucidril tablet (250 mg) | 99.15 ± 0.88 | 99.06 ± 0.92 | 1.81 | 3.63 |
| Lucidril tablet (500 mg) | 99.21 ± 0.94 | 99.24 ± 1.21 | 1.65 | 3.95 |
| Luciforte 500 mg vial | 100.54 ± 0.32 | 100.26 ± 0.8 | 1.23 | 1.75 |
This method outperformed earlier approaches regarding sensitivity, convenience of use, time savings, use of a “green” liquid, and detection level. QC laboratories can use the described technique to test MFX-containing dosage forms because of the high recovery percentage and absence of interference from pharmaceutical package ingredients.
An assessment of the environmental impact of the system
Chemical and pharmaceutical industries produce dangerous radicals and organic waste, which analysts are tasked with preventing from harming nature and humans.10,42 The pursuit of ever-improving green chemistry is a must. The analytical eco ranker43 and the Environmental Quality Methods rater44 are recent considerations. The greenness of the system was evaluated using the eco-scale. In an “ultimate green analysis”, a yield produced “ultimate green analysis” is represented by a penalty point deducted from a score of 100. As the analysis becomes more environmentally friendly, the rate will rise (to a greater value).45,46 Energy consumption per sample was less than 0.1 kW h because no extraction or heating was required. Using an aqueous medium to carry out the method resulted in a high eco-scale score (95) (Table 7). As a result, we used a green approach.| Item | Parameter | PP score |
|---|---|---|
| a LSH is an abbreviation for the less severe hazard and TPPs for the total penalty points. | ||
| Technique | Fluorimetry | 0 |
| Reagent | CPB | 1 |
| Amount of reagent | >10 mL | 1 |
| Solvent(s) | Water | 0 |
| Heating | — | 0 |
| Temperature | 25 °C | 0 |
| Cooling | — | 0 |
| pH | 4.6 | 0 |
| Energy (kW h per sample) | 1.0> | 0 |
| Waste | 1–10 (mL) | 3 |
| Occupational hazards | 0 | |
| (TPPs) | 5 | |
| Eco-scale total score | =100 − TPP | 95 |
Conclusion
A new spectrofluorimetric approach for detecting MFX was developed in this work. The electrostatic attraction was used to evaluate MFX concentrations from 0.080 to 1.9 μg mL−1 in a moderate acidic solution. Another attractive choice is a regent CPB that poses less risk to its subjects. Due to the procedure's usage of water and the resulting ion-linked complex's sensitivity in aquatic environments, it was environmentally friendly. The present system is predicated on an ion-coupled complex formed between MFX and the deprotonated hydroxyl group of CPB. The elimination of laborious extraction processes allowed for a quick and easy technique. Furthermore, water is used as the reaction fluid because it is the least detrimental to the environment. The methods outlined here are entirely safe for the environment. In this study, we did not use any experiments with volatile solvents. The technique scored highly on the eco-friendly scale. Therefore, this method can be used in research facilities, raw material checking, and pharmaceutical production to guarantee the efficacy of this treatment.Abbreviations
| MFX | Meclofenoxate |
| CPB | Cilefa Pink B |
| SD | Standard deviation |
| RSD | Relative standard deviation |
| Er | Relative error |
Conflicts of interest
There is no conflict of interest to declare.References
- S. Wood, D. Metcalf, D. Devine and C. Robinson, J. Antimicrob. Chemother., 2006, 57, 680–684 CrossRef CAS PubMed.
- X. Zhu, J. Sun and J. Wu, Talanta, 2007, 72, 237–242 CrossRef CAS.
- L. Jin, T. Wang, C. Cui, H. Wu, H. Ren and M. Wei, Dyes Pigm., 2014, 111, 39–44 CrossRef CAS.
- X. Zhu, J. Sun and Y. Hu, Anal. Chim. Acta, 2007, 596, 298–302 CrossRef CAS PubMed.
- A. M. O. Azevedo, C. Sousa, S. S. M. Rodrigues, M. Chen, C. E. Ayala, R. L. Pérez, J. L. M. Santos, I. M. Warner and M. L. M. F. S. Saraiva, Dyes Pigm., 2022, 110635, DOI:10.1016/j.dyepig.2022.110635.
- S. M. Derayea, A. A. Hamad, D. M. Nagy, D. A. Nour-Eldeen, H. R. H. Ali and R. Ali, J. Mol. Liq., 2018, 272, 337–343 CrossRef CAS.
- J. Wang, Z. Liu, J. Liu, S. Liu and W. Shen, Spectrochim. Acta, Part A, 2008, 69, 956–963 CrossRef.
- S. M. Derayea, A. A. Hamad, R. Ali and H. R. H. Ali, Microchem. J., 2019, 149, 104024 CrossRef CAS.
- A. A. Hamad, R. Ali, H. R. H. Ali, D. M. Nagy and S. M. Derayea, RSC Adv., 2018, 8, 5373–5381 RSC.
- A. A. Hamad, R. Ali and S. M. Derayea, RSC Adv., 2022, 12, 7413–7421 RSC.
- B. Nehru, R. Verma, P. Khanna and S. K. Sharma, Brain Res., 2008, 1201, 122–127 CrossRef CAS PubMed.
- M. G. El-Bardicy, H. M. Lotfy, M. A. El-Sayed and M. F. El-Tarras, Yakugaku Zasshi, 2007, 127, 201–208 CrossRef CAS PubMed.
- A. A. Aleem, E. Khaled, A. A. Farghali, A. Abdelwahab and M. Khalil, Int. J. Electrochem. Sci., 2020, 15, 3365–3381 CrossRef CAS.
- K. Li, X. Zhu and Y. Liang, Am. J. Med., 2012, 125(6), 551–559 CrossRef PubMed.
- I. Shoukrallah, A. Sakla and B. Paletta, Farmaco, 1990, 45, 455–463 CAS.
- B. Ni, J. Zhang, J. Zou, W. Zhao and J. Li, J. Chromatogr. Sci., 2010, 48, 353–357 CAS.
- Y.-h. Tong, D.-q. Ling and B.-q. Che, Chin. J. Pharm. Anal., 2004, 24, 463–464 CAS.
- M. S. Moneeb, F. Elgammal and S. M. Sabry, J. Appl. Pharm. Sci., 2016, 6, 001–011 CAS.
- X. Hu, D. Xu, S. Liu, Z. Liu, C. Li and P. Chen, Anal. Lett., 2010, 43, 2125–2133 CrossRef CAS.
- A. Cecal, C. Oniscu and E. Horoba, Pharmazie, 1983, 38(8), 562 CAS.
- T. Otsuka, S. Yoshioka, Y. Aso and T. Terao, Chem. Pharm. Bull., 1994, 42, 130–132 CrossRef CAS.
- P. Zhang, T. Liu, X. Xu, S. Liu and D. Chen, Am. J. Anal. Chem., 2016, 7, 92 CrossRef CAS.
- M. E. Swartz and I. S. Krull, Analytical Method Development and Validation, CRC Press, 2018 Search PubMed.
- M. Pesez and J. Bartos, Colorimetric and fluorimetric analysis of organic compounds and drugs, Marcel Dekker, New York, 1974 Search PubMed.
- H. T. S. Britton and R. A. Robinson, J. Chem. Soc., 1931, 1456–1462 RSC.
- T. McIlvaine, J. Biol. Chem., 1921, 49, 183–186 CrossRef CAS.
- C. Y. Huang, in Methods in Enzymology, Elsevier, 1982, vol. 87, pp. 509–525 Search PubMed.
- L. Kong, Z. Liu, X. Hu and S. Liu, Sci. China: Chem., 2010, 53, 2363–2372 CrossRef CAS.
- S. M. Derayea, Anal. Methods, 2014, 6, 2270–2275 RSC.
- L. Yu, Z. Liu, X. Hu, L. Kong and S. Liu, Microchim. Acta, 2010, 169, 375–382 CrossRef CAS.
- C. Li, S. Liu, Z. Liu and X. Hu, J. Fluoresc., 2011, 21, 723–732 CrossRef CAS PubMed.
- S. Shiao, V. Chhabra, A. Patist, M. Free, P. Huibers, A. Gregory, S. Patel and D. Shah, Adv. Colloid Interface Sci., 1998, 74, 1–29 CrossRef CAS.
- L. B. Kier, J. Pharm. Sci., 1981, 70, 930–933 CrossRef CAS PubMed.
- J. R. Lakowicz, Principles of Fluorescence Spectroscopy, Springer, 2006 Search PubMed.
- J. P. Eichorst, K. W. Teng and R. M. Clegg, in Fluorescence Spectroscopy and Microscopy, Springer, 2014, pp. 97–112 Search PubMed.
- N. Boens, W. Qin, N. Basarić, J. Hofkens, M. Ameloot, J. Pouget, J.-P. Lefevre, B. Valeur, E. Gratton and M. VandeVen, Anal. Chem., 2007, 79, 2137–2149 CrossRef CAS PubMed.
- S. Lehrer, Biochemistry, 1971, 10, 3254–3263 CrossRef CAS PubMed.
- L. N. Jattinagoudar, S. T. Nandibewoor and S. A. Chimatadar, J. Biomol. Struct. Dyn., 2017, 35, 1200–1214 CrossRef CAS PubMed.
- M. Hema and S. Arivoli, Int. J. Phys. Sci., 2007, 2, 10–17 Search PubMed.
- L. Carmen Apostol, C. Ghinea, M. Alves and M. Gavrilescu, Desalin. Water Treat., 2016, 57, 22585–22608 CrossRef CAS.
- W.-x. Ma, Y.-h. Liu and O. Sha, Asian J. Chem., 2011, 23, 3481 CAS.
- S. M. Derayea, R. Ali and A. A. Hamad, Arabian J. Chem., 2020, 13, 8026–8038 CrossRef CAS.
- A. Gałuszka, Z. M. Migaszewski, P. Konieczka and J. Namieśnik, TrAC, Trends Anal. Chem., 2012, 37, 61–72 CrossRef.
- M. De La Guardia and S. Armenta, Green Analytical Chemistry: Theory and Practice, Elsevier, 2010 Search PubMed.
- S. M. Derayea, H. Madian, E. Samir, A. Hamad and K. M. Badr-eldin, Spectrochim. Acta, Part A, 2022, 121024 CrossRef CAS PubMed.
- S. M. Derayea, D. M. Nagy, K. M. B. El-Din, T. Z. Attia, E. Samir, A. A. Mohamed and A. A. Hamad, RSC Adv., 2022, 12, 17607–17616 RSC.
- A. A. Hamad, R. Ali and S. M. Derayea, Luminescence, 2021, 36(2), 443–453 CrossRef CAS.
Footnote |
| † Electronic supplementary information (ESI) available. See https://doi.org/10.1039/d2ra05128a |
| This journal is © The Royal Society of Chemistry 2022 |

