 Open Access Article
Electrocatalytic H2 evolution using binuclear cobalt complexes as catalysts†
Tung H. To *ab,
Dang B. Tran
 bc,
Vu Thi Thu Had and
Phong D. Tran
 *b
*b
aGraduate University of Science and Technology, Vietnam Academy of Science and Technology, 18 Hoang Quoc Viet, Hanoi, Vietnam. E-mail: to-hai.tung@usth.edu.vn
bUniversity of Science and Technology of Hanoi, Vietnam Academy of Science and Technology, 18 Hoang Quoc Viet, Hanoi, Vietnam. E-mail: tran-dinh.phong@usth.edu.vn
cHo Chi Minh City University of Education, 280 An Duong Vuong, Ho Chi Minh City, Vietnam
dInstitute of Chemistry, Vietnam Academy of Science and Technology, 18 Hoang Quoc Viet, Hanoi, Vietnam
First published on 16th September 2022
Abstract
We report herein on the use of two binuclear cobalt complexes with the N,N′-bis(salicylidene)-phenylmethanediamine ligand as catalysts for the H2 evolution in DMF solution with acetic acid as proton source. Both experimental analyses (electrochemical analysis, spectroscopy analysis) and theoretical analysis (foot-of-the wave analysis) were employed. These catalysts required an overpotential of ca. 470 mV to catalyze the H2 evolution and generated H2 gas with a faradaic efficiency of 85–95% as calculated on the basis of after 5 hour bulk electrolysis. The kinetic investigation showed the maximal TOF value of 50 s−1 on the basis of an ECEC mechanism. Two cobalt centers, standing at a long distance of 4.175 Å, operated independently during catalysis without a synergetic effect or cooperation capability.
1. Introduction
The Hydrogen Evolution Reaction (HER) represents a potential approach for achieving an efficient large-scale production of hydrogen, which is a low-carbon, renewable and eco-friendly alternative fuel.1 Due to the low kinetics of this reaction, appropriate catalysts are required to achieve an adequate reaction rate.2 Inspired by the hydrogenases which efficiently catalyze the proton–hydrogen interconversion in nature, several complexes of transition metals have been designed which show attractive catalytic activities for the H2 evolution.3–5 Among them, we can mention the coordination compounds of cobalt such as cobaloximes;6,7 cobalt–polypyridine complexes4 or cobalt–salen complexes.8,9 It can be noted that both mononuclear Co complexes4,6–9 and dinuclear Co complexes4 have been investigated.In 2009, Peters and colleagues reported on the preparation of dicobalt pyridazine-bridged complexes that functioned as efficient H2 evolution catalysts in acetonitrile electrolyte solution with 2,6-dichloroanilinium tetrafluoroborate as the proton source.10 A series of binuclear cobalt catalysts containing polypyridine ligands and a pyrazine-bridging linkage was reported by Long and colleagues.11 These catalysts have been evaluated for both electrocatalytic H2 evolution and photocatalytic H2 evolution in coupling with a [Ru(bpy)3]2+ photosensitizer. Gray and colleagues reported on a dicobalt coordination compound with dimethylglyoxime as the ligand and one [BO4] linkage.12 This complex was found to be active for catalyzing the proton reduction in acetonitrile solution using protonated dimethylformamide as the proton source with an overpotential of 954 mV; TON of 3.3, and the faradaic yield of H2 production of 88%. Another dinuclear cobalt HER catalyst with a tetrakis-Schiff base ligand was reported by Dinolfo.13 The catalyst required a relatively high overpotential of 880 mV and 310 mV when using 55 mM of trifluoroacetic acid and 55 mM acetic acid as the proton sources, respectively. The bulk electrolysis at −1.88 V vs. Fc+/0 (corresponding to 530 mV of overpotential) in the acetic acid solution generated H2 with a faradaic efficiency of 72–94%.
The H2 evaluation mechanism occurred on mononuclear cobalt complexes catalysts has been intensively investigated. It has been accepted that the protonation of CoI species generating the CoIII–H hydride represents the key elemental step of catalysis. Subsequently, H2 can be produced by two pathways, namely (i) heterolytic pathway where the CoIII–H species or its reduced state CoII–H is protonated releasing a H2 molecule; (ii) homolytic pathway where two CoIII–H species combine releasing a H2 molecule via a reductive elimination.14,15 Hence, development of binuclear Co molecular catalysts for the H2 evolution could be of great interest given that the homolytic pathway which is more energetic favorable compared with the heterolytic pathway could occur in a unimolecular or bimolecular way. In 2013, Fukuzumi and colleagues reported on detailed kinetics and discussed on the H2 evolution mechanism on dinuclear cobalt complexes containing bispyridino pyrazine and terpyrdine ligands.16 This study confirmed the formation of CoIII–H hydride complex and the heterolytic cleavage to produce H2. In 2018, a bis(thiosemicarbazone) cobalt complex prepared by Artero and colleagues showed an attractive catalytic activity for H2 evolution.17 On the basis of DFT calculations, the H2 evolution was proposed to follow the ligand-assisted metal-centered pathway which involved the ligand reduction and the formation of CoIII–H species. The work reported by Verani and colleagues demonstrated that the distance between two cobalt atoms was decisive to the formation of CoII–(H−)–CoII hydride, e.g. via the two-electron donation from each CoI moiety to the proton.18 This bridging-hydride intermediate is reasonable with most known Co2(μ-H) have Co–Co distance in the range of 2.2–2.3 Å.19,20
In this work, we report on the synthesis and structural characterization of two binuclear cobalt complexes as well as their electrocatalytic properties for hydrogen evolution in an organic medium.
2. Experimental
The all reagents and solvents used were purchased from commercial sources and used without any additional purification. All reactions were performed in oven-dried glassware. 1H and 13C-NMR spectra were recorded in deuterated solvent (dimethyl sulfoxide DMSO-d6) on Bruker Avance Neo 600 spectrometer (600 and 150 MHz, respectively). Chemical shifts were reported in parts per million (ppm) from tetramethylsilane (TMS) with the solvent resonance as an internal standard. Splitting patterns were designated as “s, d, t, dd, td and m” to indicate “singlet, doublet, triplet, doublet of doublets, triplet of doublets and multiplet,” respectively. Mass spectra were recorded on Agilent 6530 Accurate-Mass Q-TOF LC/MS using electrospray ionization source at negative mode. UV-Vis spectra were recorded on Agilent Cary 3500 compact.2.1. Synthesis of ligand (L) N,N′-bis(salicylidene)-phenylmethanediamine
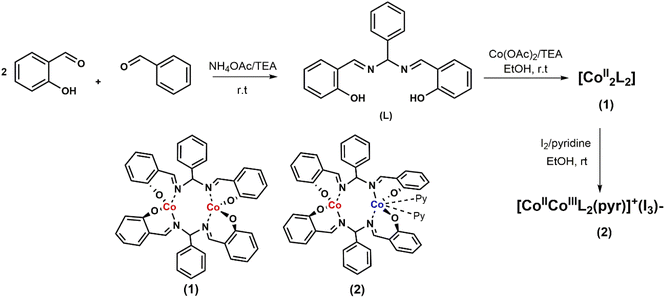
A mixture of benzaldehyde (1.21 g; 12.28 mmol; 1.0 eq. mol); salicylaldehyde (3.0 g; 24.56 mmol; 2.0 eq. mol) and ammonium acetate (4.0 g; 51.58 mmol; 2.1 eq. mol) was stirred at the ambient temperature in the presence of triethylamine (0.25 g; 1.23 mmol; 0.2 eq. mol) for 1 hour. When the yellow solid appeared, 15 mL of ethanol was added and the reaction was kept continuing overnight. After the completion of the reaction (monitored by TLC), the reaction mixture was cooled in the fridge for 3 hours and then the solid product was filtered off and washed with cold ethanol until the filtrate was colorless. The ligand product was dried in vacuo and was used in the subsequent step without further purification (yellow solid; 3.24 g; 80%). 1H NMR (600 MHz, DMSO-d6) δ 12.95 (s, 2H); 8.85 (s, 2H); 7.56 (dd, J = 7.7, 1.7 Hz, 2H); 7.51 (d, J = 7.1 Hz, 2H); 7.44 (t, J = 7.6 Hz, 2H); 7.40–7.35 (m, 3H); 6.94 (td, J = 7.5, 1.0 Hz, 2H); 6.92 (d, J = 8.2 Hz, 2H); 6.13 (s, 1H). 13C-NMR (150 MHz, DMSO-d6) δ 165.40; 160.12; 141.10; 133.07; 132.13; 128.86; 128.27; 126.71; 119.01; 118.67; 116.48; 89.50.2.2. Synthesis of [CoII2L2] (1)
To the suspension of the ligand L (2.0 g; 6.06 mmol; 1.0 eq. mol) and triethylamine (6 mL) in ethanol (20 mL), was added dropwise 10 mL ethanolic solution of Co(OAc)2·4H2O (1.5 g; 6.06 mmol; 1.0 eq. mol). The suspension was stirred at ambient temperature for 5 hours. The precipitate formed was filtered and washed with ethanol and diethyl ether and then dried in vacuo to obtain the orange powder (3.52 g; 75%). HR-ESI-MS m/z [M + Cl]− calcd for C42H32Co2N4O4Cl 809.0776 found 809.0775.2.3. Synthesis of [CoIICoIIIL2(pyr)2]+(I3)− (2)
A suspension of the complex 1 (1.5 g; 1.94 mmol; 1.0 eq. mol) and iodine (0.69 g; 2.71 mmol; 1.4 eq. mol) in ethanol (30 mL) with the presence of pyridine (2 mL) was stirred at ambient temperature for 14 hours. The brown precipitate was filtered off, washed with ethanol and diethyl ether and dried in vacuo yielding 2.16 g (85%) of a dark brown complex. HR-ESI-MS m/z [M-I3-2Py]+ calcd for C42H32Co2N4O4 774.1088 found 774.1074.2.4. X-ray crystallography
The intensities for the X-ray determinations of complex 2 were collected on a Bruker D8 Quest instrument at 298 K with Mo Kα radiation (λ = 0.71073 Å) using a TRIUMPH monochromator. Standard procedures were applied for data reduction and absorption correction.39,40 Structure solution and refinement were performed with the SHELXT and SHELXL 2014/7 programs.41,42 Hydrogen atoms were calculated for idealized positions and treated with the ‘riding model’ option of SHELXL. The representation of molecular structures was done using the program OLEX2-1.5.43 More details on data collections and structure calculations are contained in the following Tables S1 and S2.† CCDC reference numbers 168845.2.5. Electrochemistry
Cyclic voltammetry experiments were performed using a BioLogic SP300 potentiostat and a three-electrode set-up consisting of a glassy carbon working electrode (working surface area = 0.071 cm2), a platinum wire counter electrode and an Ag/AgCl (KCl 3 M) reference electrode. Ferrocene was used as an internal standard with E0(Fc+/0) = 0.53 V vs. Ag/AgCl. All studies were performed in deoxygenated DMF containing tetrabutylammonium tetrafluoroborate (TBATFB) (0.1 M) as supporting electrolyte. Controlled-potential electrolysis (CPE) in organic media were conducted using an air-tight glass double compartment cell separated by a frit. The working compartment was fitted with a glassy carbon electrode (working surface area = 0.071 cm2) and an Ag/AgCl reference electrode. The auxiliary compartment was fitted with a Pt counter electrode. Bulk electrolysis solutions were purged with N2 gas for 1 hour. The manual sample was analyzed in a PerkinElmer Clarus 690 gas chromatographer using a setup: 2 min method with 90 °C injection; argon gas flow was 20 mL min−1; Restek Packed column 5A Molesieve; Thermal Conductivity Detector (TCD) at 200 °C and −40 mA current.3. Results and discussion
3.1. Synthesis and characterization of complexes
The ligand (L), being a salen–homologue ligand, was prepared by the condensation of three components namely salicylaldehyde, benzaldehyde and ammonium acetate at ambient temperature (Scheme 1). The structure of the obtained product was confirmed by NMR spectra which were identical to those reported elsewhere.21,22 The cobalt complex [CoII2L2] 1 was then synthesized by using one-step reaction of equimolar amounts of cobalt(II) acetate and ligand (L) in the presence of triethylamine.23 After 4 hours, the crude compound precipitated as an orange powder that was found pure after washing with ethanol and diethyl ether. Oxidation of 1 by iodine afforded the dinuclear CoIII–CoII complex 2.23 The presence of two pyridine as two extra ligands helped to stabilize CoIII ion by satisfying its preferred six-coordination. The resultant dark brown product was intensively washed with ethanol until the colorless filtrate was obtained. For instance, we faced difficulty to grow suitable single crystals of complex 1 for X-ray crystallography analysis. However, the formation of binuclear compound was confirmed by the HR-ESI-MS spectra collected in the negative mode showing the pseudo-molecular ion peak at 809.0775 m/z which corresponded to the formula of complex [CoII2L2 + Cl]−. Furthermore, the structure of complex 1 could be indirectly confirmed thanks to the single crystal structure of the oxidized derivative 2 (Fig. 1).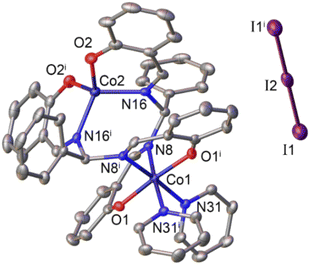 | ||
| Fig. 1 Molecular structure of complex 2. Hydrogen atoms are omitted for clarity. Symmetry operations used to generate equivalent atoms: i1 −x, y,1/2 − z. | ||
Actually, the X-ray diffraction analysis on single crystals obtained from the slow diffusion of n-hexane into a dichloromethane solution of complex 2 provided the similar structure to that reported previously.23
The Co(2) atom shows the tetrahedral geometry which is created by the coordination with two oxygen atoms and two imine nitrogen atoms of two ligand molecules. Because of +3 oxidation state, the Co(1) atom displays the regular octahedral geometry with two additional pyridine ligands. We note that for the cases of dicobalt complexes aforementioned,10,11,13,18 the Co(III) center has always octahedral geometry but geometry of the Co(II) center may varies. The complexes reported by Peters,10 Dinolfo13 and Long11 showed Co(II) center with an octahedral coordination geometry while that reported by Verani18 showed a tetrahedral geometry for the Co(II) center. Herein, our current complexes 1 and 2 show Co(II) center with tetrahedral geometry. These complexes 1, 2 show common bond length usually found for the Co–N or Co–O coordination bonds within cobalt complexes, e.g. insignificant difference of only less than 0.3 Å was determined (Tables S1 and S2†).10–13,16–18 The distance between two Co atoms is determined to be 4.175 Å which is rather too long for expecting the formation of a hydro-bridging linkage. Indeed, with Co–Co distances of 3.7–4.3 Å, formation of a hydride-bridging linkage is not favorable.18–20 Therefore, these complexes 1 and 2 are expected to use the two Co centers as two independent active sites during the catalytic H2 evolution without a strong electronic communication between these two centers.
3.2. Electrochemical properties
We first investigated the electrochemical properties of these complexes 1 and 2 in an organic electrolyte, namely the DMF solvent containing 0.1 M TBATFB as the electrolyte support. Molar concentration of these complexes was set at 1 mM. Cyclic voltammograms were recorded on a glassy carbon electrode with potential scan rate of 50 mV s−1. The complex 1 showed the first redox events at E1/2 of −1.85 V vs. Fc+/0 (with peak-to-peak ΔEp of 85 mV) (Fig. 2, red trace). We attribute this event to the CoIICoII/CoICoI redox couple. The second event (Epc = −2.48 V vs. Fc+/0) is assigned to the L/L-redox couple, namely the reduction of the ligand, as the solution of this ligand L in DMF showed identical redox behavior (Fig. S1†).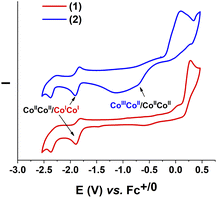 | ||
| Fig. 2 Cyclic voltammograms of 1 (red trace) and 2 (blue trace) recorded at a stationary glassy carbon electrode in DMF with a potential scan rate of 50 mV s−1. | ||
These two events were also found for the complex 2 (Fig. 2, blue trace) including the CoIICoII/CoICoI redox at E1/2 of −1.87 V vs. Fc+/0 (with peak-to-peak ΔEp of 82 mV). However, due to the presence of counter anion triiodide I3− in the structure, the complex 2 showed also a redox event of I−/I couple having Epc of −1.14 V vs. Fc+/0 and Epa at 0.12 V vs. Fc+/0 (Fig. S1†). The broad peak of this couple overlapped the peak at Epc = −0.70 V vs. Fc+/0 assigned to the reduction of CoIIICoII/CoIICoII couple (Fig. 2).17 A clear observation of CoIIICoII/CoIICoII reduction peak could be confirmed when excess amount of acetic acid was added (Fig. S2†). This phenomenon was explained by the reaction of acetic acid with iodine molecule leading to a decrease in the amount of iodine participating in the reduction process, thereby reducing the peak overlap.
3.3. Electrocatalytic H2 evolution
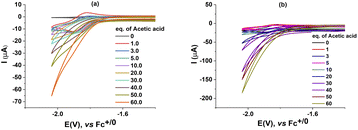
We then investigated the electrocatalytic H2 evolution activities of these complexes 1, 2 in the same DMF electrolyte solution when adding acetic acid (AA) as the proton source. It can be seen that with the sequent increase of AA concentration (from 0.0 to 60.0 mM), a catalytic wave emerged. The mid-wave potential was deduced to be E0cat of −1.92 V vs. Fc+/0 for the case of catalyst 1 (Fig. 3). This potential is close to that found for the CoIICoII/CoICoI redox couple in the absence of proton source (Fig. 2). It suggests that the H2 evolution emerges via the protonation of the reduced CoI–CoI intermediate. The catalyst 2, namely the CoIII–CoII complex, displayed similar catalytic behavior to that of the catalyst 1. Indeed, the catalytic wave emerged at potential E0cat of −1.93 V vs. Fc+/0 when adding AA. We observed that the current density remained unchanged in the potential range of the CoIIICoII to CoIICoII reduction event. It indicates that the reduced CoIICoII species is not basic enough yet for being protonated by the AA in DMF solution. In other words, the catalyst should be further reduced generating CoICoI prior the protonation and then evolution of H2 take place.To ensure that the proton reduction is catalyzed by homogeneous catalysts 1 and 2 but not their eventual deposited products, “rinse test” control experiments were carried out. The glassy carbon electrode, used for recording CVs of a solution containing 1 mM catalyst 1 and 60 mM AA, was taken out and rinsed intensively with DMF solvent. Subsequently, the electrode was polarized when being immersed in a DMF solution containing 60 mM AA but being free of any catalyst 1 or 2. Negligible cathodic current was recorded, demonstrating the non-catalytic character of this electrode. In other word, we can conclude no catalytic active deposits have been produced from the homogeneous solution of catalysts 1 and 2 (Fig. S3†). This is in contrast to some previous studies, which described about the formation of deposited cobalt nanoparticle from cobalt complexes as heterogeneous catalysts. Aukauloo and colleagues24 and Artero and colleagues25 showed that the actual active species for H2 evolution consisted of Co-based nanoparticles (mentioned as CoOx) formed on the electrode surface due to the degradation of the pyridine–oxime cobalt complex and diamine–dioxime cobalt complexes, respectively. We note that, the cobalt complex decomposition causing the formation of cobalt based deposits acting as the actual catalyst for the water oxidation reaction has been also demonstrated by Hetterscheid and colleagues.26
We then aimed to probe the structural change of complexes 1, 2 during their catalytic operation by using the UV-Vis spectroscopy analysis. Prior to use for the catalysis, complexes 1 and 2 in DMF exhibited two absorption bands: the first band at λmax of 266 nm (for 1) and 276 nm (for 2) and the second band at λmax of 378 nm (for 1) and 400 nm (for 2) (Fig. S4†). After each potential polarization cycle for assaying the electrochemical catalytic activity of complexes with the increase concentration of acetic acid, the UV-Vis spectra of catalyst solutions were collected. It can be seen that the absorption bands remained at the same wavelengths but their absorption intensity decreased progressively (Fig. 4). This observation suggests a partial degradation of complexes 1 and 2 during the H2 evolution catalysis. However, the degradation is likely different to a simple decomplexation as the characteristic absorption band at 325 nm of the free ligand was not observed (Fig. 4 and S4).†
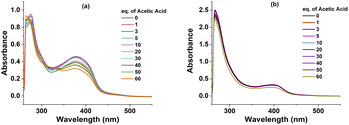 | ||
| Fig. 4 UV-Vis spectra of complexes 1 (a) and 2 (b) after evaluating electrochemical activity with different concentration of acetic acid. | ||
Bulk electrolysis was conducted at a constant potential of −1.93 V vs. Fc+/0 using a DMF electrolyte solution constituted of 1 mM catalyst 1 (or 2) and 60 mM AA. The amount of H2 gas produced was quantified by GC analysis. On the basis of 5 hours bulk electrolysis experiments, the average faradaic efficiency was deduced to be 95% for the catalyst 1 (namely CoIICoII complex) and 86% for the catalyst 2 (namely CoIIICoII complex) (Fig. S5†). After 5 hours of bulk electrolysis, the electrochemical properties of the remained catalyst solutions were examined using a new fresh glassy carbon electrode. It was found that catalytic activities remained almost unchanged for both catalysts 1 and 2 (Fig. S6 and S7†).
Indeed, overpotential (η) is a key descriptor to appreciate a H2-evolution catalyst and compare one to others. It can be deduced from the onset potential, being the potential where the H2 evolution starts to emerge,27 the potential required to sustain a given catalytic current density,27 or the half-wave potential of the catalytic wave.28 Herein, the overpotential required for the H2 evolution when using both catalysts 1 and 2 in DMF solution is determined at the half-way potential in the presence of 60 mM concentration of acetic acid. Under such an operation condition, the thermodynamic reduction potential of the acetic acid in DMF  can be estimated by the eqn (1) following Artero and colleagues,29 providing the
  value of −1.46 V vs. Fc+/0 (see ESI†). Thus, the overpotentials for the H2 evolution on complex 1 and 2 are 460 and 470 mV, respectively (Fig. S8†).
 | (1) |
In comparison with Dinolfo's complex13 having the comparable structure (based on shift-base ligand), our complexes requires more than 150 mV overpotential for catalytic operation using the same acetic acid as proton source. We note that two types of complexes were investigated in two different solvents (Dinolfo's in Acetonitrile and ours in DMF) so this difference is possible. When comparing with dicobalt–glyoxime complexes reported by Gray and colleagues,12 our current dinuclear cobalt complexes showed better catalytic activity with requirement of lower onset overpotential (460 mV vs. 954 mV) although the former complexes were evaluated the activity for HER with stronger acid (protonated DMF pKa 6.1 in acetonitrile4). The detailed comparison of these two catalysts with other published dicobalt complexes is presented in the Table S6†.
3.4. Kinetic analysis and determination of rate constants
We then investigated on the kinetics of H2 evolution using these catalysts 1 and 2. The order of catalyst concentration was examined by varying the catalyst concentration from 0.5 to 1.0 mM while keeping the same H+ activity by using the same solution of 60 mM glacial AA. The catalytic rate was deduced by recording cycling voltammograms at different potential scan rates from 50 mV s−1 to 1 V s−1.In this case, the concentration of AA is largely excess, thus the acid concentration tends to be constant during the catalysis. Fig. 5 shows the evolution of maximum catalytic current at different potential scan rates in function of catalyst concentration. Linear dependence can be seen for both catalysts, from which the first order can be deduced.
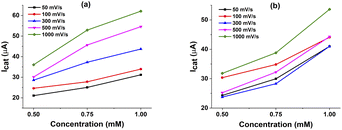 | ||
| Fig. 5 The line graphs of catalytic current versus concentration of complexes 1 (a) and 2 (b) with different scan rate in the presence of 60 mM acetic acid solution. | ||
We then carried out the foot-of-the-wave analysis (FOWA) to determine the catalytic rate constant and predict the maximum turnover frequency. In comparison with the plateau current analysis, FOWA can reduce the effect of side phenomenon such as the depletion of proton at the surface of electrode or the deactivation of catalyst after potential scanning cycles, e.g. deactivation due to the formation new complexes of conjugated base-catalyst or prohibition of active sites by hydrogen evolved. Few FOWA models have been developed by Costentin and Saveant which could be applied for different H2 evolution mechanisms.30,31 Actually, a find prediction of catalysis mechanism is required prior to applying the FOWA.32 As aforementioned, the H2 evolution is initiated by the one-electron reduction of CoII center generating CoI species (denoted hereafter as E for electron transfer step) which is then protonated providing CoIII–H-hydride (denoted here after as C for chemical step). This hydride complex underwent the second EC process resulting in the evolution of H2 molecule. In other words, the H2 evolution occurred on catalysts 1 and 2 via a ECEC mechanism. We note this ECEC mechanism was usually found for cobalt complexes such as cobaloximes,14,33,34 diimine–dioxime cobalt complexes35 or pendant amines cobalt complexes36,37 (Scheme 2).
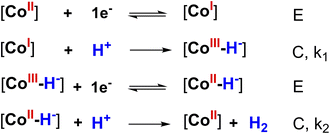 | ||
| Scheme 2 The proposedly heterolytic mechanism of 1 or 2 catalyzing HER (where [CoI], [CoII] and [CoIII] represented the active sites). | ||
For such a ECEC mechanism, the ratio of the catalytic current over the peak current is a function of overpotential as described by eqn (2) wherein icat is the catalytic current (mA), ip is the cathodic peak current (mA), R = 8.314 J mol−1 K−1, T = 299 K, F = 96![[thin space (1/6-em)]](https://www.rsc.org/images/entities/char_2009.gif) 485C mol−1,31,38 ν is scan rate (V s−1), kobs = kcat[H+] (s−1), E is the potential at the foot of the wave (V) and Ecat/2 is the half-wave potential of the catalysis (V).
485C mol−1,31,38 ν is scan rate (V s−1), kobs = kcat[H+] (s−1), E is the potential at the foot of the wave (V) and Ecat/2 is the half-wave potential of the catalysis (V).
 | (2) |
The plots of icat/ip in function of exp[−F/RT(E − Ecat/2)] is depicted in Fig. 6.
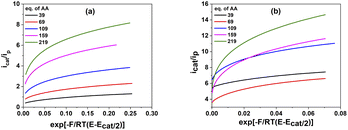 | ||
| Fig. 6 The plot of icat/ip as a function of exp [−F/RT(E − Ecat/2)] for 1 mM catalysts 1 (a) and 2 (b) in various concentration of acetic acid. | ||
The values of the observed rate constants kobs and the catalytic rate constants kcat were extracted from the slope of linear plots and showed in Table S5.† Using these rate constants, the maximal turnover frequency (TOFmax) at the foot of the catalytic wave was deduced (Fig. 7). In the case of complex 1, the catalytic rate constant increased gradually when increasing AA concentration from 39 mM to 159 mM before it reached a plateau at higher acid concentration. The TOFmax value therefore approximates kcat[AA] and can be extrapolated to be 50 s−1 for AA concentration of 1 M. In the shape contrast, no obvious evolution of the catalytic rate kcat was found for the complex 2. The kcat value fluctuated around 800 M−1 s−1 when the concentration of AA increased from 39 mM to 159 mM. For the higher acid concentration, the slope became steeper, showing the faster rate of catalysis. The [H+]-dependent rate constant showed the catalysis had not come into the saturated region of acetic acid. Thus, complex 2 was expected to afford the TOFmax value of over 1600 s−1 with 1 M AA. It could be explained because the diffusion coefficient of 2 was about one order of magnitude higher than that of 1 (see ESI†), which can foster the rate of electron transfer.
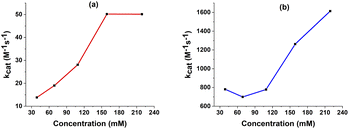 | ||
| Fig. 7 The kcat extracted from FOWA in various concentration of AA with 1 mM catalyst 1 (a) and 2 (b). | ||
4. Conclusion
Two dinuclear cobalt–salen homologue complexes, namely complex 1 ([CoII2L2]) and complex 2 ([CoIICoIIIL2(pyr)2]+(I3)−) wherein L is N,N′-bis(salicylidene)-phenylmethanediamine and pyr is pyridine, were prepared. These complexes showed a long Co–Co distance of 4.175 Å which was too long for formation of a hydro-bridging linkage Co–H–Co. Thus, the two Co centers within these complexes acted as independent catalytic centers for the catalytic H2 evolution. In DMF electrolyte solution, using these complexes as catalysts and with adding acetic acid as proton source, the electrocatalytic H2 evolution emerges at potential being close to that of CoII/CoI reduction. Bulk electrolysis at −1.93 V vs. Fc+/0 showed the H2 production with high faradaic yield of 86–95%. Theoretical FOWA analysis allowed quantifying the rate constants and maximal turnover frequency of two complexes. With 1 M acetic acid, TOFmax of complex 1 was estimated to be about 50 s−1 while it was of over 1600 s−1 for the complex 2. The difference of calculated TOFmax values could be elucidated by the 5-fold higher diffusion coefficient of complex 2 than that of complex 1.Author contributions
All authors have given approval to the final version of the manuscript.Conflicts of interest
There are no conflicts of interest to declare.Acknowledgements
This research is funded by Graduate University of Science and Technology under grant number GUST.STS.ĐT2020-HH11. Authors thank https://www.Bbrusheezy.com for the free brushes used in the creation of graphic for the TOC.References
- A. I. Osman, N. Mehta, A. M. Elgarahy, M. Hefny, A. Al-Hinai, A. a. H. Al-Muhtaseb and D. W. Rooney, Environ. Chem. Lett., 2022, 20, 153–188 CrossRef CAS.
- S. Wang, A. Lu and C.-J. Zhong, Nano Convergence, 2021, 8, 4 CrossRef CAS PubMed.
- G.-G. Luo, H.-L. Zhang, Y.-W. Tao, Q.-Y. Wu, D. Tian and Q. Zhang, Inorg. Chem. Front., 2019, 6, 343–354 RSC.
- L. Tong, L. Duan, A. Zhou and R. P. Thummel, Coord. Chem. Rev., 2020, 402, 213079 CrossRef CAS.
- D. B. Tran, T. H. To and P. D. Tran, Coord. Chem. Rev., 2022, 457, 214400 CrossRef CAS.
- D. Dolui, S. Khandelwal, P. Majumder and A. Dutta, Chem. Commun., 2020, 56, 8166–8181 RSC.
- S. Sowmya and V. Vijaikanth, ChemistrySelect, 2022, 7, e202104044 CrossRef CAS.
- C.-B. Li, P. Gong, Y. Yang and H.-Y. Wang, Catal. Lett., 2018, 148, 3158–3164 CrossRef CAS.
- S. Khandelwal, A. Zamader, V. Nagayach, D. Dolui, A. Q. Mir and A. Dutta, ACS Catal., 2019, 9, 2334–2344 CrossRef CAS.
- N. K. Szymczak, L. A. Berben and J. C. Peters, Chem. Commun., 2009, 6729–6731, 10.1039/B913946J.
- C. Di Giovanni, C. Gimbert-Suriñach, M. Nippe, J. Benet-Buchholz, J. R. Long, X. Sala and A. Llobet, Chem.–Eur. J., 2016, 22, 361–369 CrossRef CAS PubMed.
- S. M. Laga, J. D. Blakemore, L. M. Henling, B. S. Brunschwig and H. B. Gray, Inorg. Chem., 2014, 53, 12668–12670 CrossRef CAS PubMed.
- S. Kal, A. S. Filatov and P. H. Dinolfo, Inorg. Chem., 2014, 53, 7137–7145 CrossRef CAS PubMed.
- J. L. Dempsey, B. S. Brunschwig, J. R. Winkler and H. B. Gray, Acc. Chem. Res., 2009, 42, 1995–2004 CrossRef CAS.
- V. Artero, M. Chavarot-Kerlidou and M. Fontecave, Angew. Chem., Int. Ed., 2011, 50, 7238–7266 CrossRef CAS PubMed.
- S. Mandal, S. Shikano, Y. Yamada, Y.-M. Lee, W. Nam, A. Llobet and S. Fukuzumi, J. Am. Chem. Soc., 2013, 135, 15294–15297 CrossRef CAS PubMed.
- T. Straistari, R. Hardré, J. Fize, S. Shova, M. Giorgi, M. Réglier, V. Artero and M. Orio, Chem.–Eur. J., 2018, 24, 8779–8786 CrossRef CAS PubMed.
- K. K. Kpogo, S. Mazumder, D. Wang, H. B. Schlegel, A. T. Fiedler and C. N. Verani, Chem.–Eur. J., 2017, 23, 9272–9279 CrossRef CAS PubMed.
- P. Dapporto, S. Midollini and L. Sacconi, Inorg. Chem., 1975, 14, 1643–1650 CrossRef CAS.
- F. Lutz, R. Bau, P. Wu, T. F. Koetzle, C. Krüger and J. J. Schneider, Inorg. Chem., 1996, 35, 2698–2700 CrossRef CAS.
- D. Koh, J. Appl. Biol. Chem., 2005, 48, 105–107 CAS.
- N. Hossein, R. Khadijeh and S. Fariba, Bull. Korean Chem. Soc., 2008, 29, 2445–2448 CrossRef.
- B. Chiari, A. Cinti, O. Crispu, F. Demartin, A. Pasini and O. Piovesana, J. Chem. Soc., Dalton Trans., 2001, 3611–3616, 10.1039/B105594C.
- S. E. Ghachtouli, R. Guillot, F. Brisset and A. Aukauloo, ChemSusChem, 2013, 6, 2226–2230 CrossRef.
- N. Kaeffer, A. Morozan, J. Fize, E. Martinez, L. Guetaz and V. Artero, ACS Catal., 2016, 6, 3727–3737 CrossRef CAS.
- D. D. Boer, Q. Siberie, M. A. Siegler, T. H. Ferber, D. C. Moritz, J. P. Hofmann and D. G. H. Hetterscheid, ACS Catal., 2022, 12, 4597–4607 CrossRef CAS.
- D. N. Nguyen, M. Fadel, P. Chenevier, V. Artero and P. D. Tran, J. Am. Chem. Soc., 2022, 144, 9651–9660 CrossRef CAS PubMed.
- A. M. Appel and M. L. Helm, ACS Catal., 2014, 4, 630–633 CrossRef CAS.
- V. Fourmond, P.-A. Jacques, M. Fontecave and V. Artero, Inorg. Chem., 2010, 49, 10338–10347 CrossRef CAS PubMed.
- C. Costentin, S. Drouet, M. Robert and J.-M. Savéant, J. Am. Chem. Soc., 2012, 134, 11235–11242 CrossRef CAS PubMed.
- J.-M. Savéant, Chem. Rev., 2008, 108, 2348–2378 CrossRef PubMed.
- E. S. Rountree, B. D. McCarthy, T. T. Eisenhart and J. L. Dempsey, Inorg. Chem., 2014, 53, 9983–10002 CrossRef CAS PubMed.
- J. L. Dempsey, J. R. Winkler and H. B. Gray, J. Am. Chem. Soc., 2010, 132, 16774–16776 CrossRef CAS PubMed.
- M. Razavet, V. Artero and M. Fontecave, Inorg. Chem., 2005, 44, 4786–4795 CrossRef CAS PubMed.
- N. Kaeffer, M. Chavarot-Kerlidou and V. Artero, Acc. Chem. Res., 2015, 48, 1286–1295 CrossRef CAS PubMed.
- E. S. Wiedner, J. A. S. Roberts, W. G. Dougherty, W. S. Kassel, D. L. DuBois and R. M. Bullock, Inorg. Chem., 2013, 52, 9975–9988 CrossRef CAS PubMed.
- E. S. Wiedner, A. M. Appel, D. L. DuBois and R. M. Bullock, Inorg. Chem., 2013, 52, 14391–14403 CrossRef CAS.
- V. C. C. Wang and B. A. Johnson, ACS Catal., 2019, 9, 7109–7123 CrossRef CAS.
- Bruker, APEX2 and SADABS, Bruker AXS Inc., Madison, Wisconsin, USA, 2014 Search PubMed.
- Bruker, SAINT, Bruker AXS Inc., Madison, Wisconsin, USA, 2013 Search PubMed.
- G. Sheldrick, Acta Crystallogr., Sect. A, 2015, 71, 3–8 CrossRef PubMed.
- G. Sheldrick, Acta Crystallogr., Sect. C, 2015, 71, 3–8 CrossRef PubMed.
- O. V. Dolomanov, L. J. Bourhis, R. J. Gildea, J. A. K. Howard and H. Puschmann, J. Appl. Crystallogr., 2009, 42, 339–341 CrossRef CAS.
Footnote |
| † Electronic supplementary information (ESI) available. See https://doi.org/10.1039/d2ra05109e |
| This journal is © The Royal Society of Chemistry 2022 |

