
 Open Access Article
 This Open Access Article is licensed under a
 Creative Commons Attribution 3.0 Unported Licence
A highly efficient electrochemical sensor containing polyaniline/cerium oxide nanocomposites for hydrogen peroxide detection
Mahmoud A. Hussein *a,
Ajahar Khanb and
Khalid A. Alamry*a
*a,
Ajahar Khanb and
Khalid A. Alamry*a
aChemistry Department, Faculty of Science, King Abdulaziz University, Jeddah 21589, Saudi Arabia. E-mail: maabdo@kau.edu.sa; mahussein74@yahoo.com; kaalamri@kau.edu.sa
bDepartment of Food and Nutrition, Bionanocomposite Research Center, Kyung Hee University, 26 Kyungheedae-ro, Dongdaemun-gu, Seoul, 02447, South Korea
First published on 3rd November 2022
Abstract
An efficient electrochemical sensor containing polyaniline/cerium oxide (PANI/CeO2) nanocomposites for the detection of hydrogen peroxide has been fabricated using the traditional in situ oxidative polymerization process. PANI/CeO2 nanocomposite-based modified glassy carbon electrodes were utilized as an electrochemical sensor for the detection of hydrogen peroxide. Before the fabrication, CeO2 was prepared by a hydrothermal method, and common techniques confirmed its structure. PANI/CeO2 nanocomposites were prepared by adding variable loadings of the pre-prepared CeO2 nanoparticles (weight%) inside the polymer host matrix. All the nanocomposites were characterized to determine their chemical structures and suitability for electrode materials. The electrode detection limit, sensitivity, and effect of pH on the sensor performance were investigated using different electrochemical methods, including cyclic voltammetry, electrochemical impedance spectroscopy, and linear sweep voltammetry. The results indicated that the sensing abilities of the synthesized PANI/CeO2(10) nanocomposite-modified GCE presented good electrocatalytic oxidation properties towards H2O2 with an enhanced low limit of detection and good repeatability. The fabricated electrode sensor was successfully used to detect H2O2 in real samples.
1. Introduction
Metal oxides derived from polymer nanocomposites are novel nanostructured materials that have shown customized properties that are seldom observed in pure polymers. Those nanocomposites have demonstrated exceptional performance in a variety of domains, making them appropriate for a broad range of real-world applications.1–4 The above multifunctional materials have a wide range of applications, along with the construction of different kinds of sensors.5–7 The nanofillers, which seem to be nanoscale in size and have a highly porous structure, are the primary reasons for the vast uses of nanocomposites. The porous structure is responsible for increasing the polymer nanocomposites' physical and chemical characteristics. Because of their good qualities with synergetic or complimentary tendencies among conductive polymers and inorganic nanoparticles, composite materials with conductive characteristics have prospective uses in a variety of disciplines.8 There have been many publications on the creation of nanoparticles in polymers. In situ polymerization, anodic oxidation, electrochemical, and electrodeposition are some processes employed to create these composite materials.9–11 Polyaniline (PANI) has been intensively explored among conjugated polymers over the past two decades due to its unusual electrochemical and physicochemical properties. PANI is likely to be much more explored since it has a huge variety of superior properties deduced from its structural flexibility, as well as some economic benefits such as good environmental stability, processability in aqueous solutions and organic solvents, achievement consistency, distinct optical, electrical, and electrochemical characteristics, and its simple non-redox doping/de-doping ability in acid/base reactions.12,13 Along with its chemical and environmental stability, unusually quick redox rate, and acid-base doping/de-doping chemistry, PANI has been regarded among the most promising and effective components. A significant amount of work has gone into the fabrication of PANI electrodes for supercapacitors using different methods such as self-doping, template polymerization, in situ polymerization, and counter-ion induced technique.14–17 Cerium oxide (CeO2) is a promising material, and CeO2 nanostructures have a diverse range of potential applications in many areas, including catalysis, fuel cells, optical additives, high-temperature oxidation resistance, cosmetic components, free-radical scavengers, and others.18–20 Moreover, it plays a crucial part in the growth of technology for environmental applications.21–23CeO2 nanostructures have also been used in sensor technologies. Due to their high specific surface area, good electrochemical activity, and the probability of promoting electron transfer reactions at a lower overpotential, CeO2 nanostructures have piqued interest among researchers due to their unique and diverse applications in various areas in many disciplines, particularly sensor advanced technologies.18,19,24,25 CeO2 nanostructures were created as nanoparticles with small dimensions due to their interesting uses in electronics, energy storage, catalysis, and gas sensing. As a result, in this study, we attempted to create PANI/CeO2 nanocomposites by inserting crystalline low-dimensional CeO2 nanoparticles into a PANI matrix. The glassy carbon electrode (GCE) modified with the PANI/CeO2 nanocomposite was used to detect hydrogen peroxide (H2O2) in actual biological samples like tap water and packed bottled milk. Field-emission scanning electron microscopy (FE-SEM) was used to analyze the surface morphology of PANI/CeO2 nanocomposites, while Fourier transform infrared (FTIR), ultraviolet-visible (UV-vis), and X-ray diffraction (XRD) spectroscopy techniques were used to evaluate the stoichiometry and crystalline structure. Linear sweep voltammetry (LSV), cyclic voltammetry (CV), and electrochemical impedance spectroscopy (EIS) were used to study the electrode detection limit, sensitivity, and pH influence on the detection of H2O2 using PANI/CeO2 nanocomposites.
2. Experimental
2.1 Materials & solvents
Aniline (BDH, 99%) was freshly distilled before use via a simple distillation method. Phosphoric acid (Merck, 97%), and ammonium persulfate (BDH, 99%) was used without further purification. All other used chemicals, such as cerium chloride, ammonium nitrate, etc., were purchased from Aldrich Chemical Co. All the chemicals were of reagent grade and used without further purification. Distilled water was used throughout the study.2.2 Growth of CeO2 nanoparticles
CeO2 nanoparticles were synthesized by the hydrothermal method in which CeCl2 (1.36 g) was dissolved in distilled water (100 ml) with constant stirring for about 30 min at room temperature and were then titrated with NH4OH solution until pH = 10.2. The resultant solutions were then transferred into a Teflon autoclave and heated at 150.0 °C for 9 hours. Finally, a white precipitate was obtained, which was washed with water and ethanol several times and dried at room temperature. The resulting white powder was calcined at 250 °C for 5 hours.2.3 Oxidative polymerization of pure PANI
Pure PANI was prepared using a well-known oxidative polymerization technique as previously described in the literature.26,272.4 Fabrication of PANI/CeO2(1,3,5,10) nanocomposites
The PANI/CeO2 nanocomposites were synthesized using a constant weight of aniline and 1, 3, 5, 10 wt% of CeO2 nanoparticles. New PANI/CeO2 nanocomposites with different CeO2 ratios (wt%) were prepared by in situ polymerizations in an aqueous solution. In a typical procedure, a certain amount of CeO2 nanoparticles (0.01, 0.03, 0.05, 0.1 g) and 1 ml aniline monomer were added to 35 ml of 0.5 mol per L H3PO4 solution and sonicated for 30 min. Then, 2.78 g ammonium persulfate was dissolved in 20 ml of 0.5 mol per L H3PO4 solution and added dropwise to the mixture with constant stirring. The polymerization was carried out at 0 °C under nitrogen for 24 h. The composites obtained by filtering were washed respectively with deionized water and ethanol and dried under vacuum at 60 °C for 24 h (Fig. 1). The fabricated nanocomposites were given the following abbreviations PANI/CeO2(1), PANI/CeO2(3), PANI/CeO2(5), PANI/CeO2(10) for the different CeO2 loadings (1, 3, 5, 10 wt%) within the polymer matrix.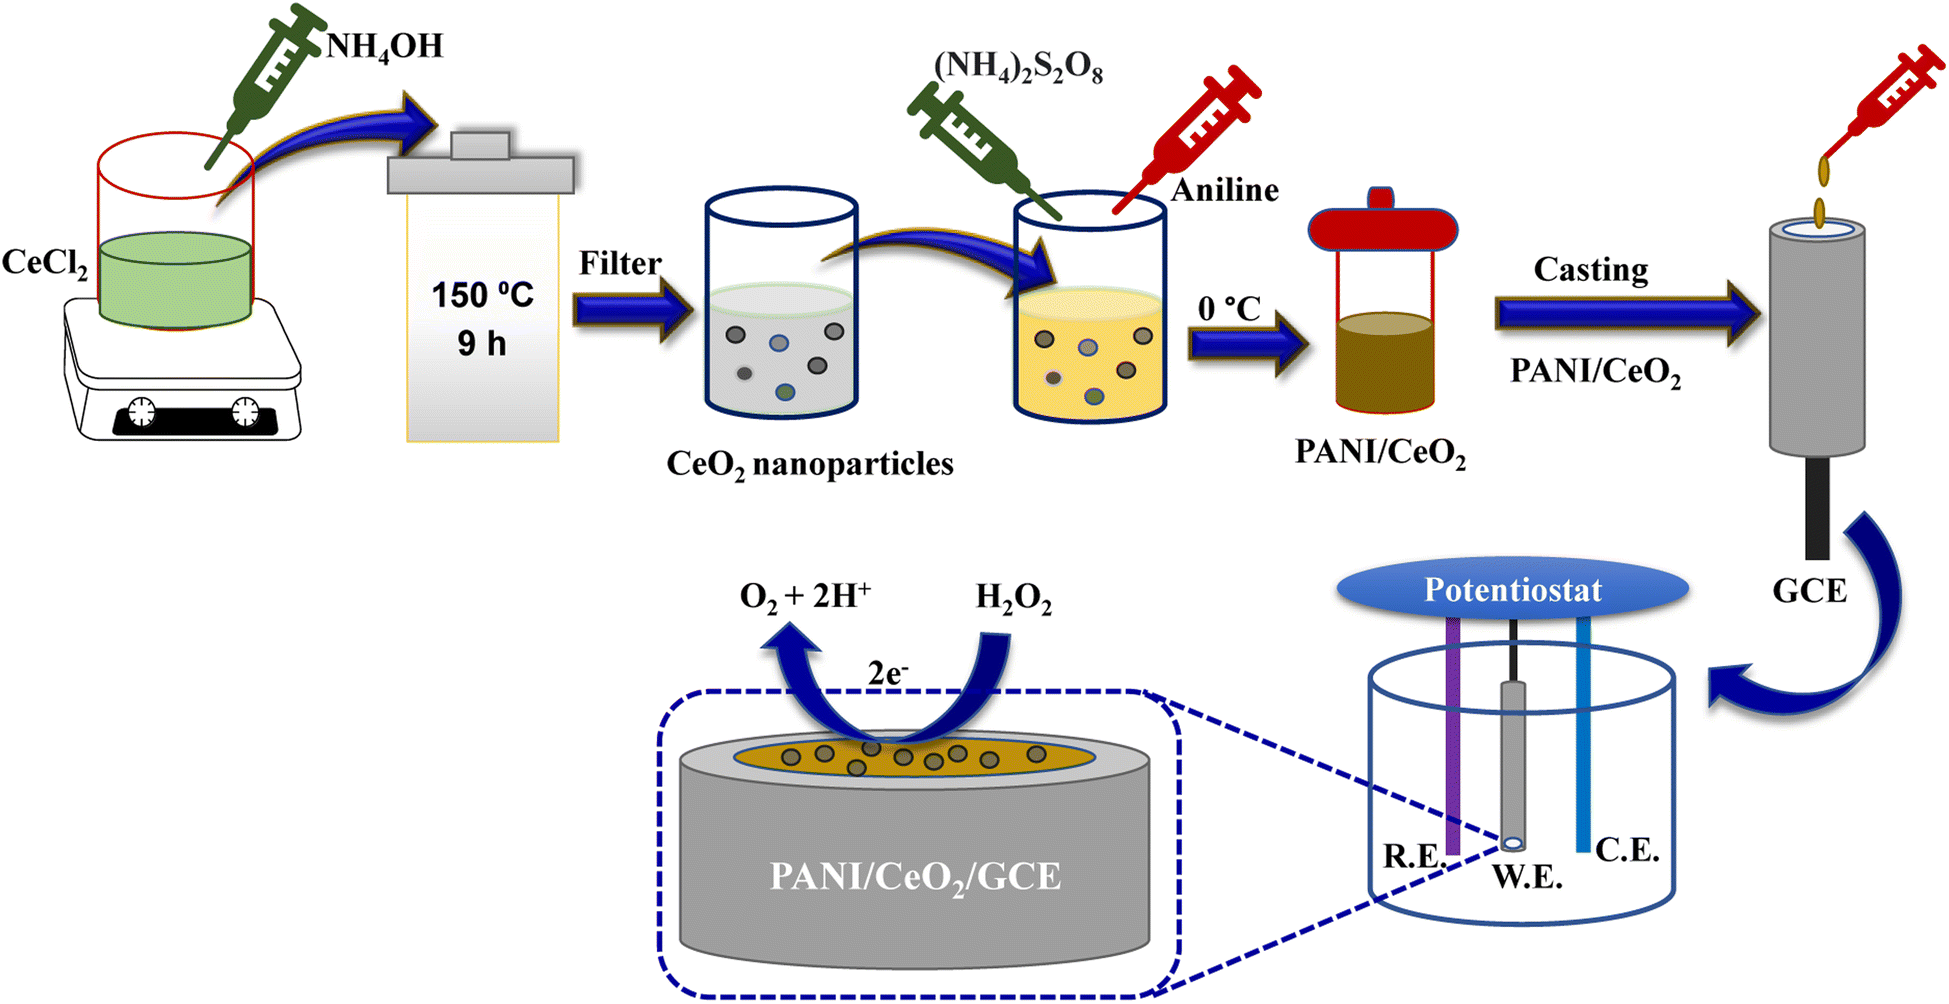 | ||
| Fig. 1 Schematic illustration of PANI/CeO2 synthesis and the modification of GCE with the prepared nanocomposite. | ||
2.5 PANI/CeO2(10) nanocomposite-modified electrode fabrication
Glassy carbon electrodes were polished using a velvet pad with 0.05 μm alumina slurry, followed by sonication in acetone and washing with double distilled water (DDW) at room temperature (25 ± 3 °C) (RT). A fine dispersion of 1%, 3%, 5%, and 10% of CeO2 loading in the form of PANI/CeO2(1,3,5,10) was prepared by dissolving 20 mg of each in 1 ml DDW by sonicating the solution mixture for up to 3 h. Next, 20 μL of each nanocomposite dispersion was deposited on a GCE, which was assigned as a non-enzymatic electrochemical sensor electrode for the detection of H2O2 (Fig. 1). Electrochemical studies of the modified GCE deposited with different concentrations of PANI/CeO2(1,3,5,10) were conducted at room temperature using an Autolab potentiostat (Metrohm PGSTAT302N-AUT85887) fitted with an impedance analyzer (FRA32M.X) and programmed with Nova 1.1 software. A conventional cell having a three-electrode system, including a working electrode (bare or GCE, 3 mm diameter), reference electrode (Ag/AgCl), and counter electrode (platinum wire), was used to perform a CV, LSV, and EIS in the potential range of −0.6 to 1.0 V at the scan rates of 20 to 200 mV s−1. The optimization procedures were carried out on PANI/CeO2(10), which gave the highest electrochemical performance among all the fabricated materials.2.6 Instrumentation
The synthesized nanoparticles and nanocomposites were characterized in detail in terms of their structural, optical, and sensing properties. XRD diffractograms were taken with a computer-controlled X'Pert Explorer, PANalytical diffractometer. The surface morphology of the nanohybrid membranes was studied at 15 kV using a JEOL scanning electron microscope (JSM-7600F, Japan). FT-IR spectra were recorded in KBr dispersion in the range of 400 to 4000 cm−1 on a PerkinElmer (spectrum 100) FT-IR spectrometer. UV-vis spectra were recorded from 250–700 nm using a PerkinElmer (Lambda 950) UV-visible spectrometer. The electrochemical measurements were carried out by using an Autolab potentiostat (Metrohm PGSTAT302N-AUT85887) fitted with an impedance analyzer (FRA32M.X) and programmed with Nova 1.1 software.3. Results and discussion
3.1 Physicochemical characterization of CeO2 nanoparticle and PANI/CeO2(1,3,5,10) nanocomposites
Hybrid PANI/CeO2 nanocomposites have been fabricated using the familiar in situ oxidative polymerization process and applied in the electrochemical sensing of hydrogen peroxide. PANI/CeO2(1,3,5,10) nanocomposites-based modified glassy carbon electrodes were utilized as electrochemical sensors for the detection of hydrogen peroxide. Prior to the fabrication process, CeO2 nanoparticles were prepared by a hydrothermal method and the chemical structure was confirmed by common characterization tools including FT-IR, UV-vis, XRD and FE-SEM measurements. The formation of CeO2 nanoparticles was confirmed by the FT-IR spectrum, which is shown in Fig. 2a. FT-IR showed an absorption band at 554 cm−1, which is the characteristic peak for the Ce–O stretching vibration. FT-IR also showed absorption bands at 3343 cm−1, 1600 cm−1and 1400 cm−1, responsible for water and CO2, which nanocrystalline materials normally absorb from the environment due to their high surface-to-volume ratio.25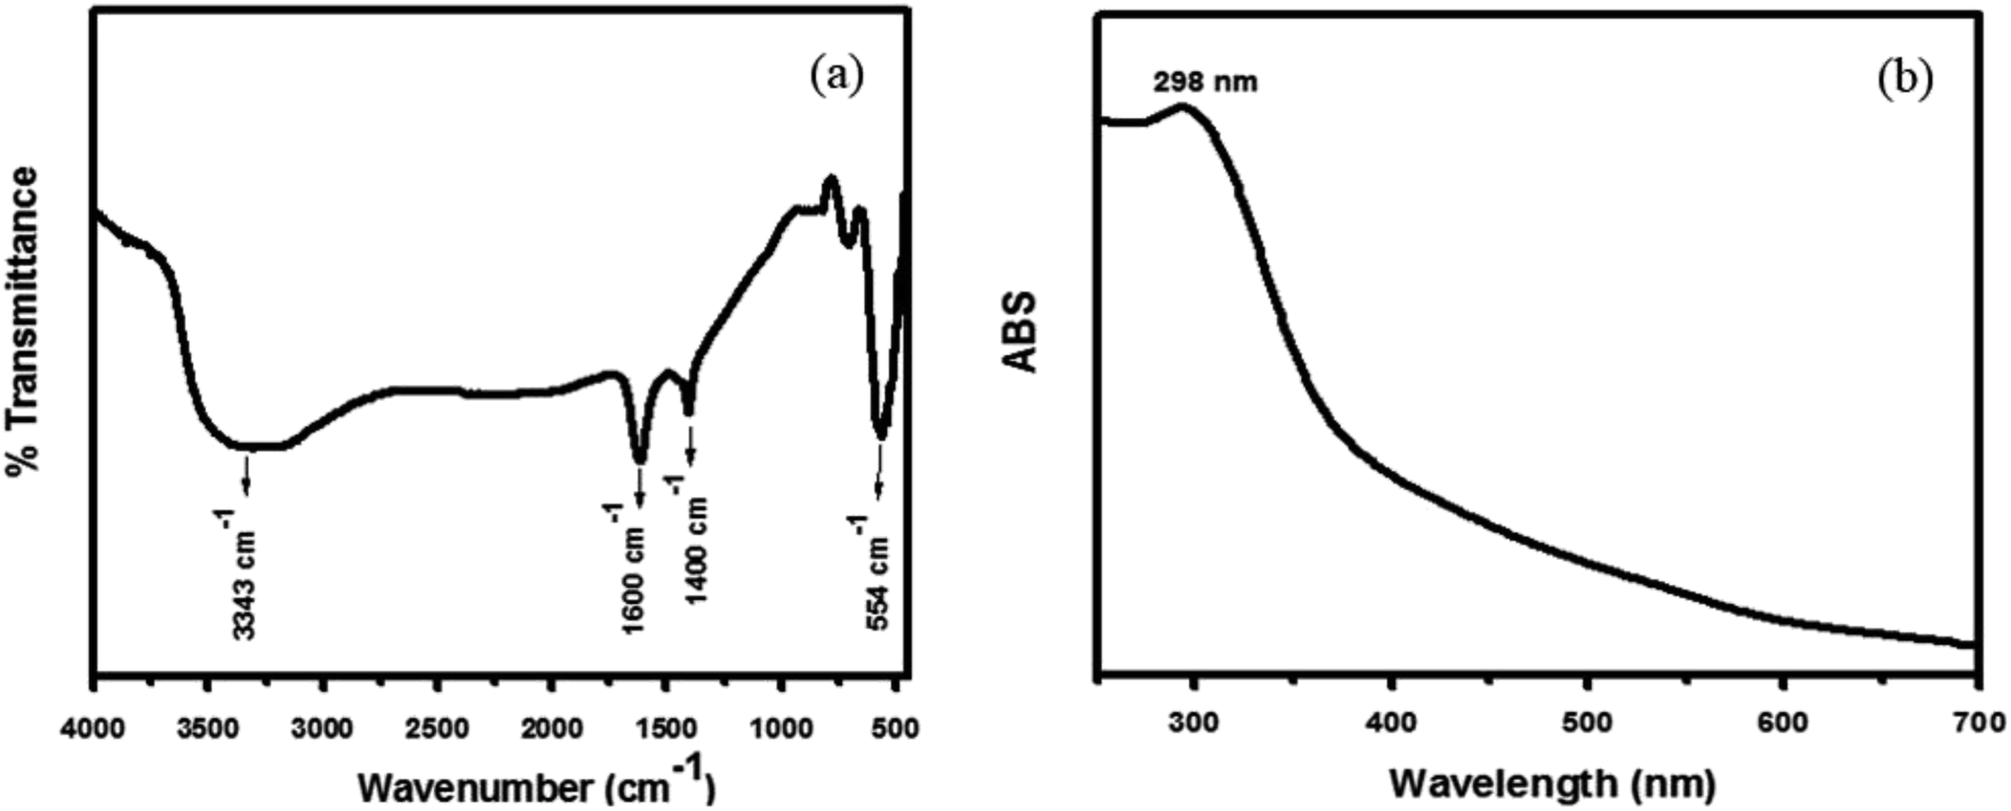 | ||
| Fig. 2 Typical FT-IR spectrum of the synthesized CeO2 nanoparticles (a) and typical UV-vis spectrum of the synthesized CeO2 nanoparticles (b) grown via a simple hydrothermal process. | ||
The UV-vis spectra of the synthesized nanoparticles were also examined to check the photocatalytic activity of CeO2 nanoparticles, which depends on their optical properties. As shown in Fig. 2b, the UV-vis spectra of the CeO2 nanoparticles exhibited a well-defined absorption band at 298 nm.25 Usually, a peak at 298 nm corresponds to the fluorite cubic structure of CeO2. The UV spectrum showed no other peak related to impurities and structural defects, confirming that the synthesized nanoparticles were pure CeO2.
FE-SEM was used to characterize the structure and shape of the CeO2 nanoparticles as demonstrated in Fig. 3a. The FE-SEM images show that the synthesized product consists of aggregated spherical particles, grown with high density. The average diameter of the grown nanoparticles was about 50 ± 10 nm. The surface images of the PANI/CeO2(1,3,5,10) nanocomposites indicate that the CeO2 nanoparticles were homogeneously distributed in the PANI without any aggregation (Fig. 3b–e), and the data is in good agreement with the previous reports in the literature.7
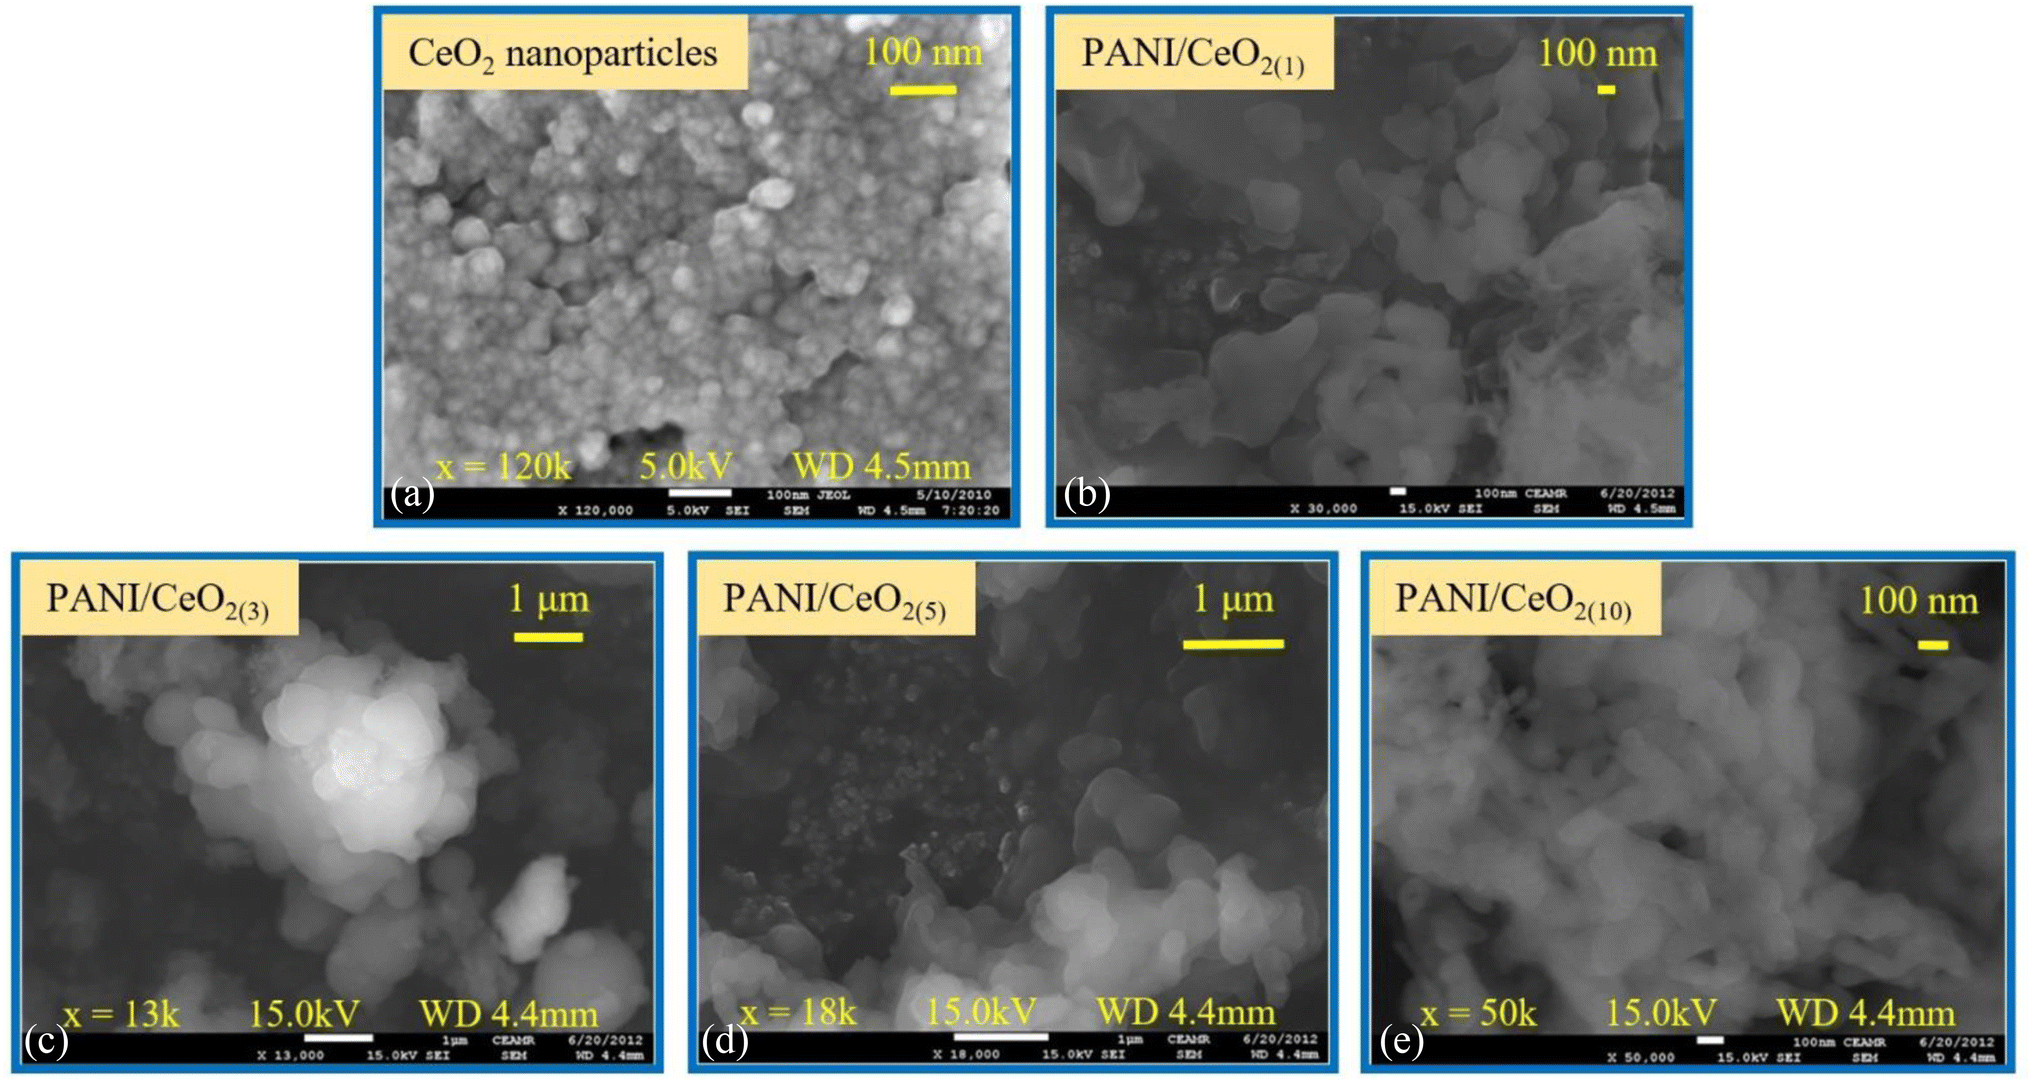 | ||
| Fig. 3 Typical FESEM images of the synthesized CeO2 nanoparticles grown via a simple hydrothermal process (a) and for the fabricated PANI/CeO2(1,3,5,10) nanocomposites (b–e). | ||
The main target of this study is to fabricate a set of PANI/CeO2 nanocomposites in the form of PANI/CeO2(1,3,5,10) containing different loadings of the pre-prepared CeO2 nanoparticles (weight%) inside the polymer host matrix. Here, 1, 3, 5, and 10% of the CeO2 nanoparticles have been inserted into the pure PANI to form the required PANI/CeO2 nanocomposites.
Fig. 4a represents the wide-angle XRD pattern of CeO2 nanoparticles. The XRD pattern exhibited well-defined peaks located at 2θ = 28.5, 33.1, 47.5, 56.2, 59.0, 69.4, 76.6 and 79.0, corresponding to (111), (200), (220), (311), (222), (400), (331) and (420) planes, respectively. All these peaks of the synthesized CeO2 can be indexed to the cubic phase of CeO2 (JC-PDF cards no 01-075-8371) because all the peaks are well-matched with the standard peaks of crystalline cubic CeO2.25 According to the JC-PDF cards, the lattice parameter a is 5.4116 Å for CeO2 nanoparticles. All the obtained peaks in the pattern belong only to CeO2. No other peak related to impurities was detected within the XRD's detection limit, which confirmed that the obtained nanoparticles are pure CeO2 with a cubic phase.
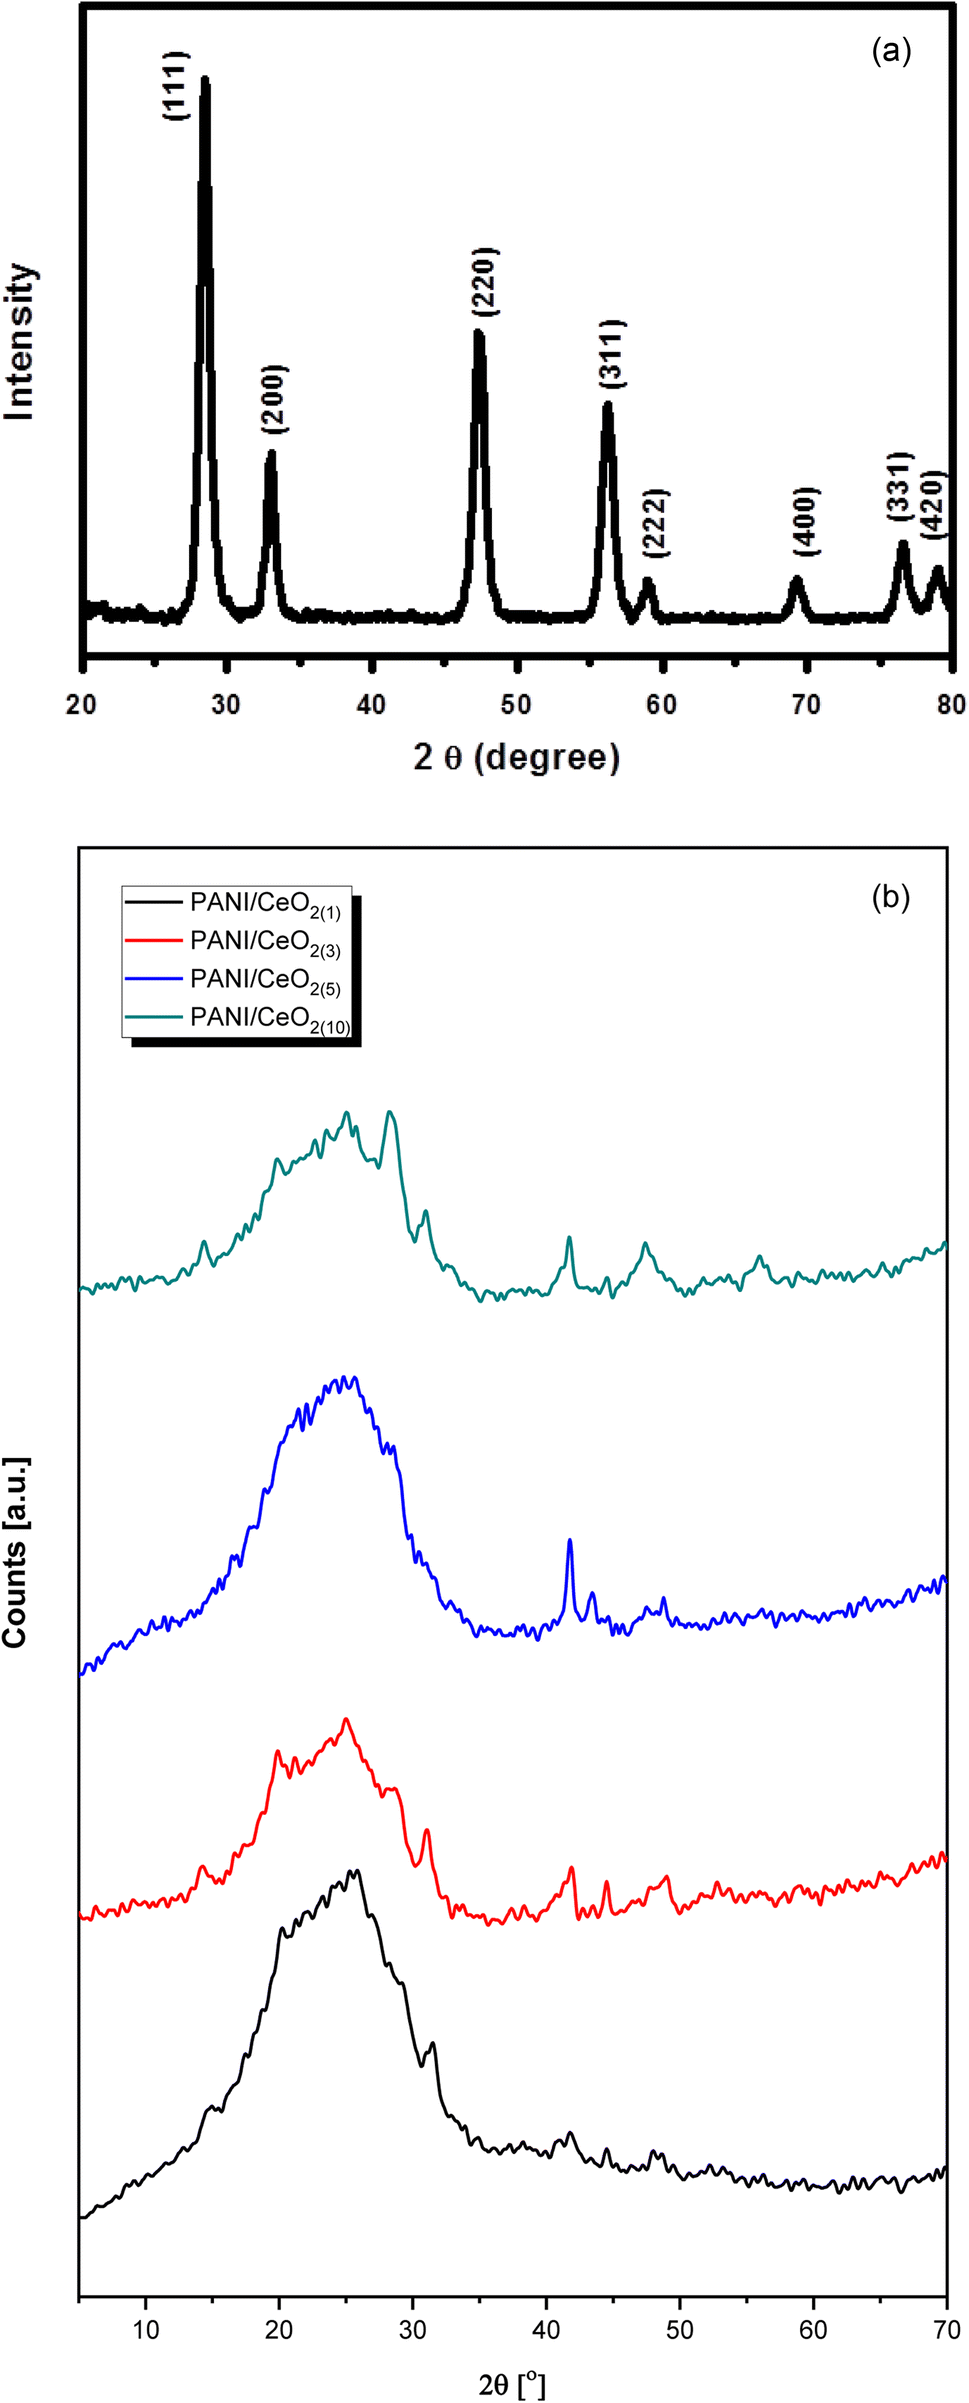 | ||
| Fig. 4 (a)Typical XRD pattern of the synthesized CeO2 nanoparticles grown via a simple hydrothermal process. (b) Typical XRD patterns of the fabricated PANI/CeO2(1,3,5,10) nanocomposites. | ||
The XRD pattern of the pure PANI and the fabricated PANI/CeO2(1,3,5,10) nanocomposites (Fig. 4b) shows a peak with a peak maximum at 25.0 Å, which is responsible for the amorphous phase of PANI. The amorphous nature of pure PANI is in agreement with previously reported studies.26,27 The XRD patterns of the fabricated materials also showed several small peaks attributed to the CeO2 in the nanocomposites.7 The CeO2–related peak intensities were noticeably increased, in agreement with the increased CeO2 loading in the formation of the nanocomposite. All diffraction peaks in the obtained patterns confirmed that the synthesized products are nanocomposites of PANI and CeO2 nanoparticles. XRD did not show any other peaks except PANI and CeO2, verifying that the synthesized nanocomposites are made of PANI and CeO2.7,26,27
The pure PANI, and the fabricated PANI/CeO2(1,3,5,10) nanocomposites were further characterized by FTIR spectroscopy, as illustrated in Fig. 5. Samples were examined over a wide range from 4000 to 500 cm−1. The peaks of pure PANI observed, including broad peaks in the range of 3037–3319 cm−1, were due to N–H bond stretching vibrations of secondary amino groups,28,29 and other peaks observed at 1568 cm−1 and 1043 cm−1 were attributed to the C![[double bond, length as m-dash]](https://www.rsc.org/images/entities/char_e001.gif) C stretching of the quinoid ring in PANI, and (NQN).30,31 Moreover, benzene rings were identified by C–N and C–C peaks at 1304 and 1391 cm−1, respectively.32,33 The absorption band observed at 1615 cm−1 is due to the “scissor’’ bending of related water.34 For the PANI/CeO2(1,3,5,10) nanocomposites, new peaks were observed at 822, 754, and 583 cm−1 in the FTIR spectra of each composite, attributed to the Ce–O asymmetric stretching mode and bending vibrations. The Ce–N symmetric stretching vibration of Ce–N caused the peak at 502 cm−1, which shows that the composite was successfully formed with PANI.33,34 The concentration percentage varied, as can be seen. This refers to each bond, although no shift in the location of the bonds was observed. The FT-IR spectrum after adding PANI to CeO2 in the form of PANI/CeO2(1,3,5,10) nanocomposites is displayed in Fig. 5a–e. Some IR peaks of PANI have shifted to lower wavenumber with reduced intensity, which may be due to the formation of hydrogen bonds between the hydroxyl groups on the surface of the CeO2 nanoparticles and the imine groups in the polyaniline molecular chains.35 A similar type of FTIR behavior with reduced intensity of IR peaks was also reported by Sasikumar et al. (2015) for the PANI/CeO2 nanocomposite caused due to the hydrogen bonding between hydroxyl groups on the surface of the CeO2 nanoparticles and the polyaniline's imine groups.36
C stretching of the quinoid ring in PANI, and (NQN).30,31 Moreover, benzene rings were identified by C–N and C–C peaks at 1304 and 1391 cm−1, respectively.32,33 The absorption band observed at 1615 cm−1 is due to the “scissor’’ bending of related water.34 For the PANI/CeO2(1,3,5,10) nanocomposites, new peaks were observed at 822, 754, and 583 cm−1 in the FTIR spectra of each composite, attributed to the Ce–O asymmetric stretching mode and bending vibrations. The Ce–N symmetric stretching vibration of Ce–N caused the peak at 502 cm−1, which shows that the composite was successfully formed with PANI.33,34 The concentration percentage varied, as can be seen. This refers to each bond, although no shift in the location of the bonds was observed. The FT-IR spectrum after adding PANI to CeO2 in the form of PANI/CeO2(1,3,5,10) nanocomposites is displayed in Fig. 5a–e. Some IR peaks of PANI have shifted to lower wavenumber with reduced intensity, which may be due to the formation of hydrogen bonds between the hydroxyl groups on the surface of the CeO2 nanoparticles and the imine groups in the polyaniline molecular chains.35 A similar type of FTIR behavior with reduced intensity of IR peaks was also reported by Sasikumar et al. (2015) for the PANI/CeO2 nanocomposite caused due to the hydrogen bonding between hydroxyl groups on the surface of the CeO2 nanoparticles and the polyaniline's imine groups.36
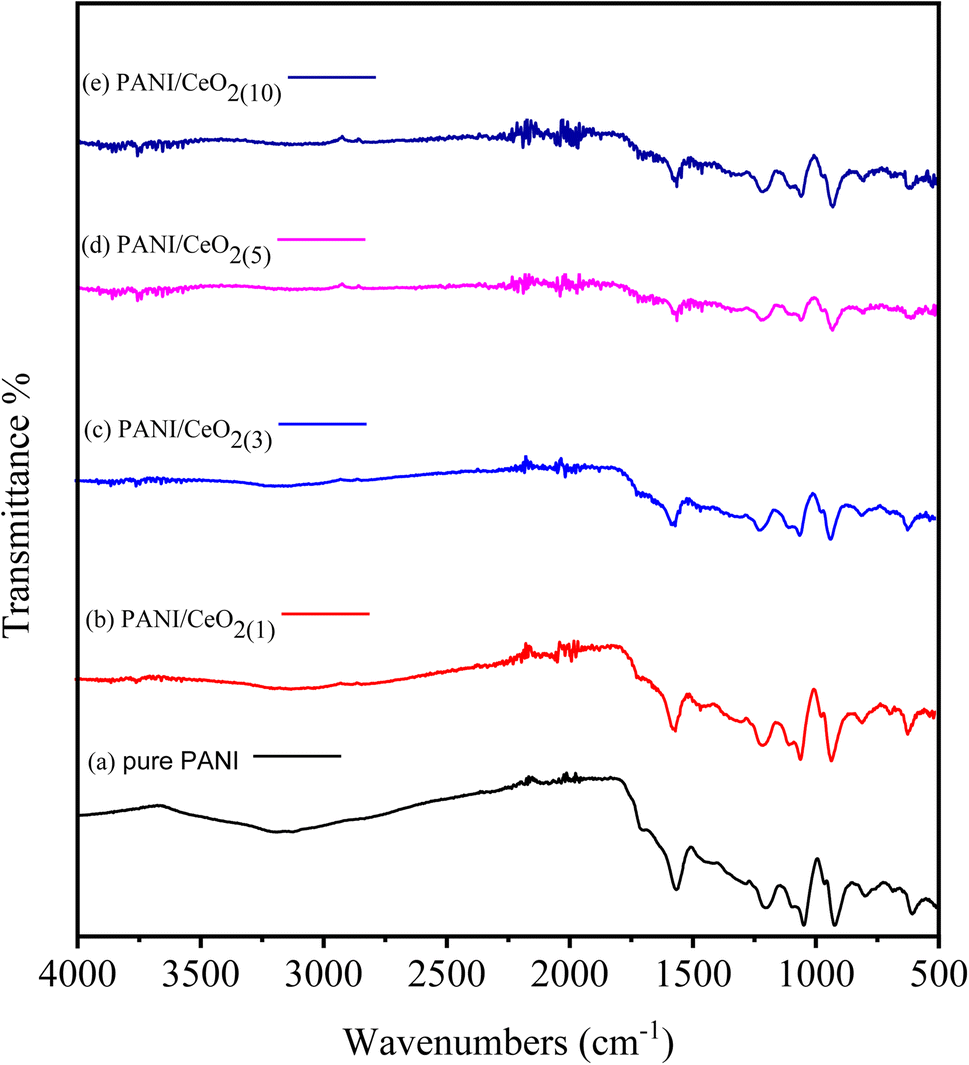 | ||
| Fig. 5 FTIR spectra of pure PANI (a) and PANI/CeO2(1,3,5,10) nanocomposites (b–e) with different loadings. | ||
3.2 Electrochemical performance of PANI/CeO2(1,3,5,10) nanocomposites
The cyclic voltammograms (CV) of the bare GCE, PANI/CeO2(1,3,5,10) nanocomposites-modified GCE in 0.1 M K3Fe(CN)6 (prepared in 0.1 M KCl) at the applied potential of −0.5 to 0.7 at the scan rate of 100 mV s−1 are shown in Fig. 6. The CV curves indicate that PANI/CeO2(1,3,5,10) nanocomposites-modified GCE with concentrations of 1% to 10% have larger electro-active area and high current density as compared to bare GCE. The surface area of the electrode has a significant role in the rate of reaction and it was found to be larger in the case of PANI/CeO2(1,5,10) nanocomposites-modified GCE than bare GCE, which produced a high CV current. Therefore, the PANI/CeO2(1,3,5,10) nanocomposites promote electron transfer using potassium ferricyanide as a supporting electrolyte. It was also observed that with increasing the concentration of cerium oxide, the value of the anodic peak current also increased (Fig. 6A). The CV curve of the PANI/CeO2(10) nanocomposites-modified GCE indicated that the further increase in the value of the anodic peak current may be due to feasible electron transfer among counter and working electrodes.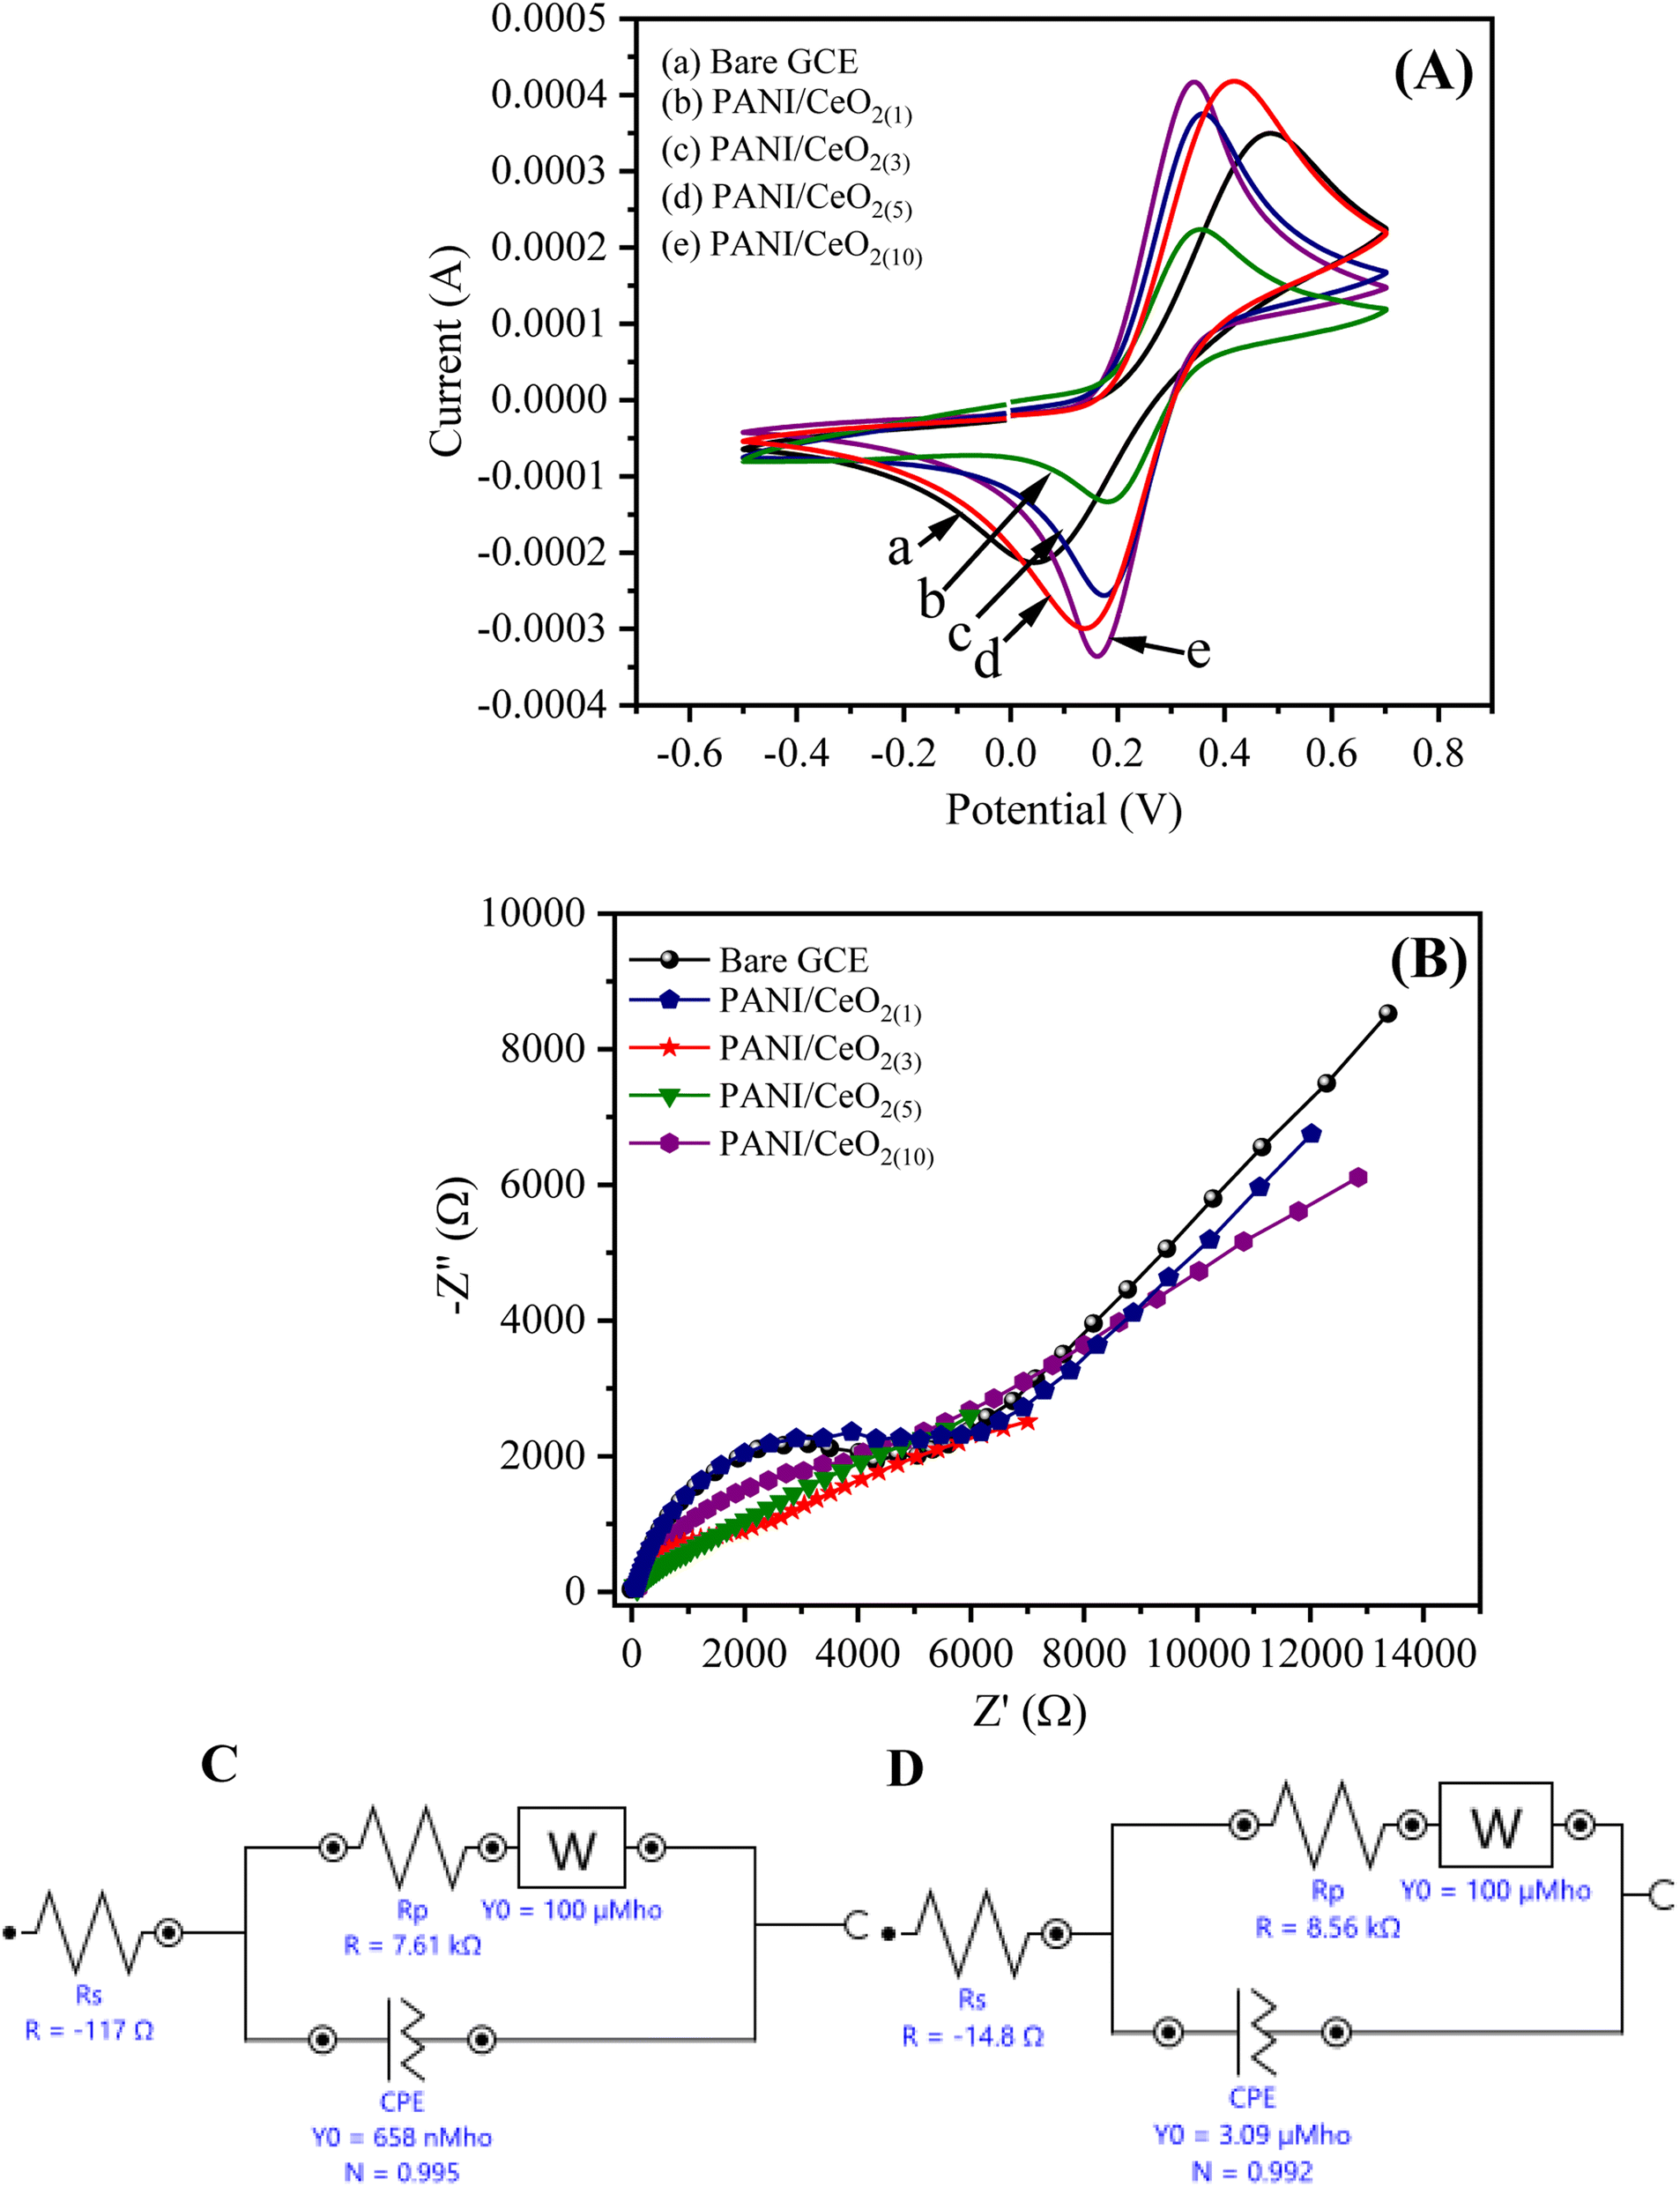 | ||
| Fig. 6 (A) The obtained cyclic voltammogram and (B) EIS curves of the bare GCE, and PANI/CeO2(1,3,5,10)-modified GCE response in 0.1 mM K3Fe(CN)6 and equivalent circuit models (C) for PANI/CeO2(1) (D) PANI/CeO2(10) nanocomposite GCE electrodes. | ||
EIS is considered a significant study for demonstrating the resistivity or conductance between the electrolyte interface and GCE. The value of the negative imaginary impedance can report this (−Z′′) vs. real impedance (Z′) in Nyquist plots. Fig. 6B shows the Nyquist plot for PANI/CeO2(1,3,5,10) nanocomposites-modified GCE. The EIS equivalent circuit models used for determining the values of charge transfer resistance (Rct), solution resistance (Rs), constant phase element (CPE), and Warburg impedance (W) for PANI/CeO2(1), and PANI/CeO2(10)-modified GCE are shown in Fig. 6C and D. The Nyquist plot of PANI/CeO2(10)-modified GCE showed a reduced diameter of the semi-circle in the lower frequency region. The shape of the semi-circular obtained in the higher frequency region indicated a limited electron transfer process for the reaction process while the diffusion process is allied with a diffusion-reaction process. The reduced shape of the semi-circle in the lower frequency region demonstrates a faster rate of electron transfer, therefore, less resistivity with improved conductivity.37 Fig. 6(C and D) show that Rct (Rp) values for the PANI/CeO2(10) and PANI/CeO2(1)-modified GCE were 7.61 and 8.56 kΩ, respectively. The lower value of Rct also confirmed the improved electron transfer rate for the PANI/CeO2(10)-modified electrode. The obtained results of both CV and EIS studies suggested the high anodic peak current and improved rate of electron transfer for the PANI/CeO2(10)-modified electrode in comparison to the other concentrations; therefore, further electrochemical characterizations were carried out with only a modified electrode having the PANI/CeO2(10) nanocomposite.
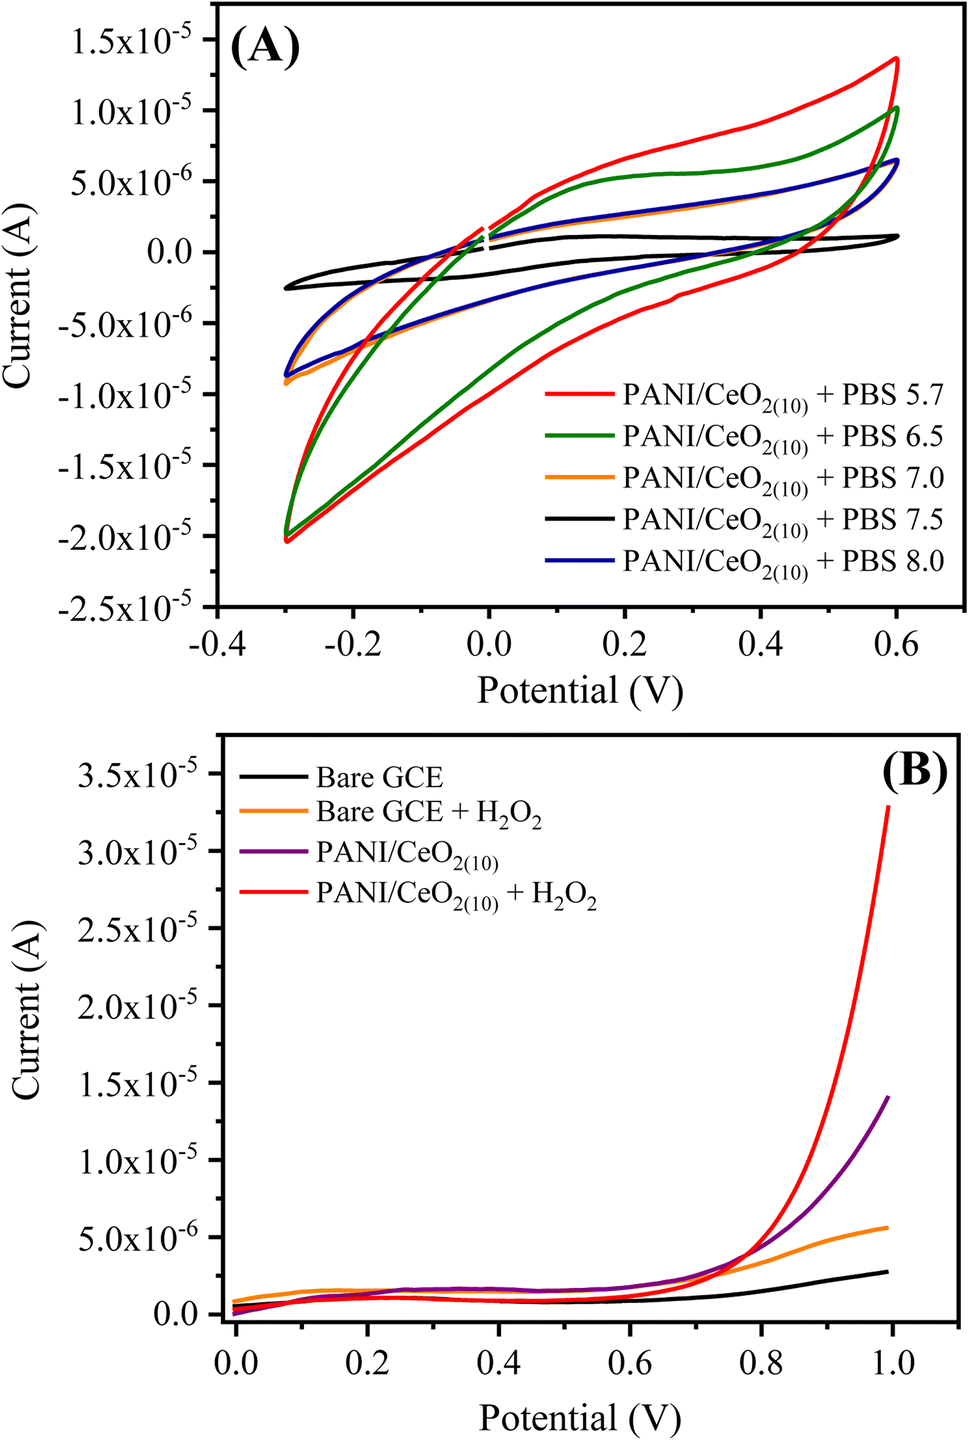 | ||
| Fig. 7 (A) CV response of the PANI/CeO2(10) nanocomposite GCE using phosphate buffer solutions in different pH ranges, and (B) the current responses of the bare and PANI/CeO2(10) nanocomposite GCE in the absence and presence of 0.1 mM H2O2 using PBS 5.7 at 100 mV s−1. | ||
| imax = 0.0000977 × V1/2 + 0.0000118 (R2 = 0.982) | (1) |
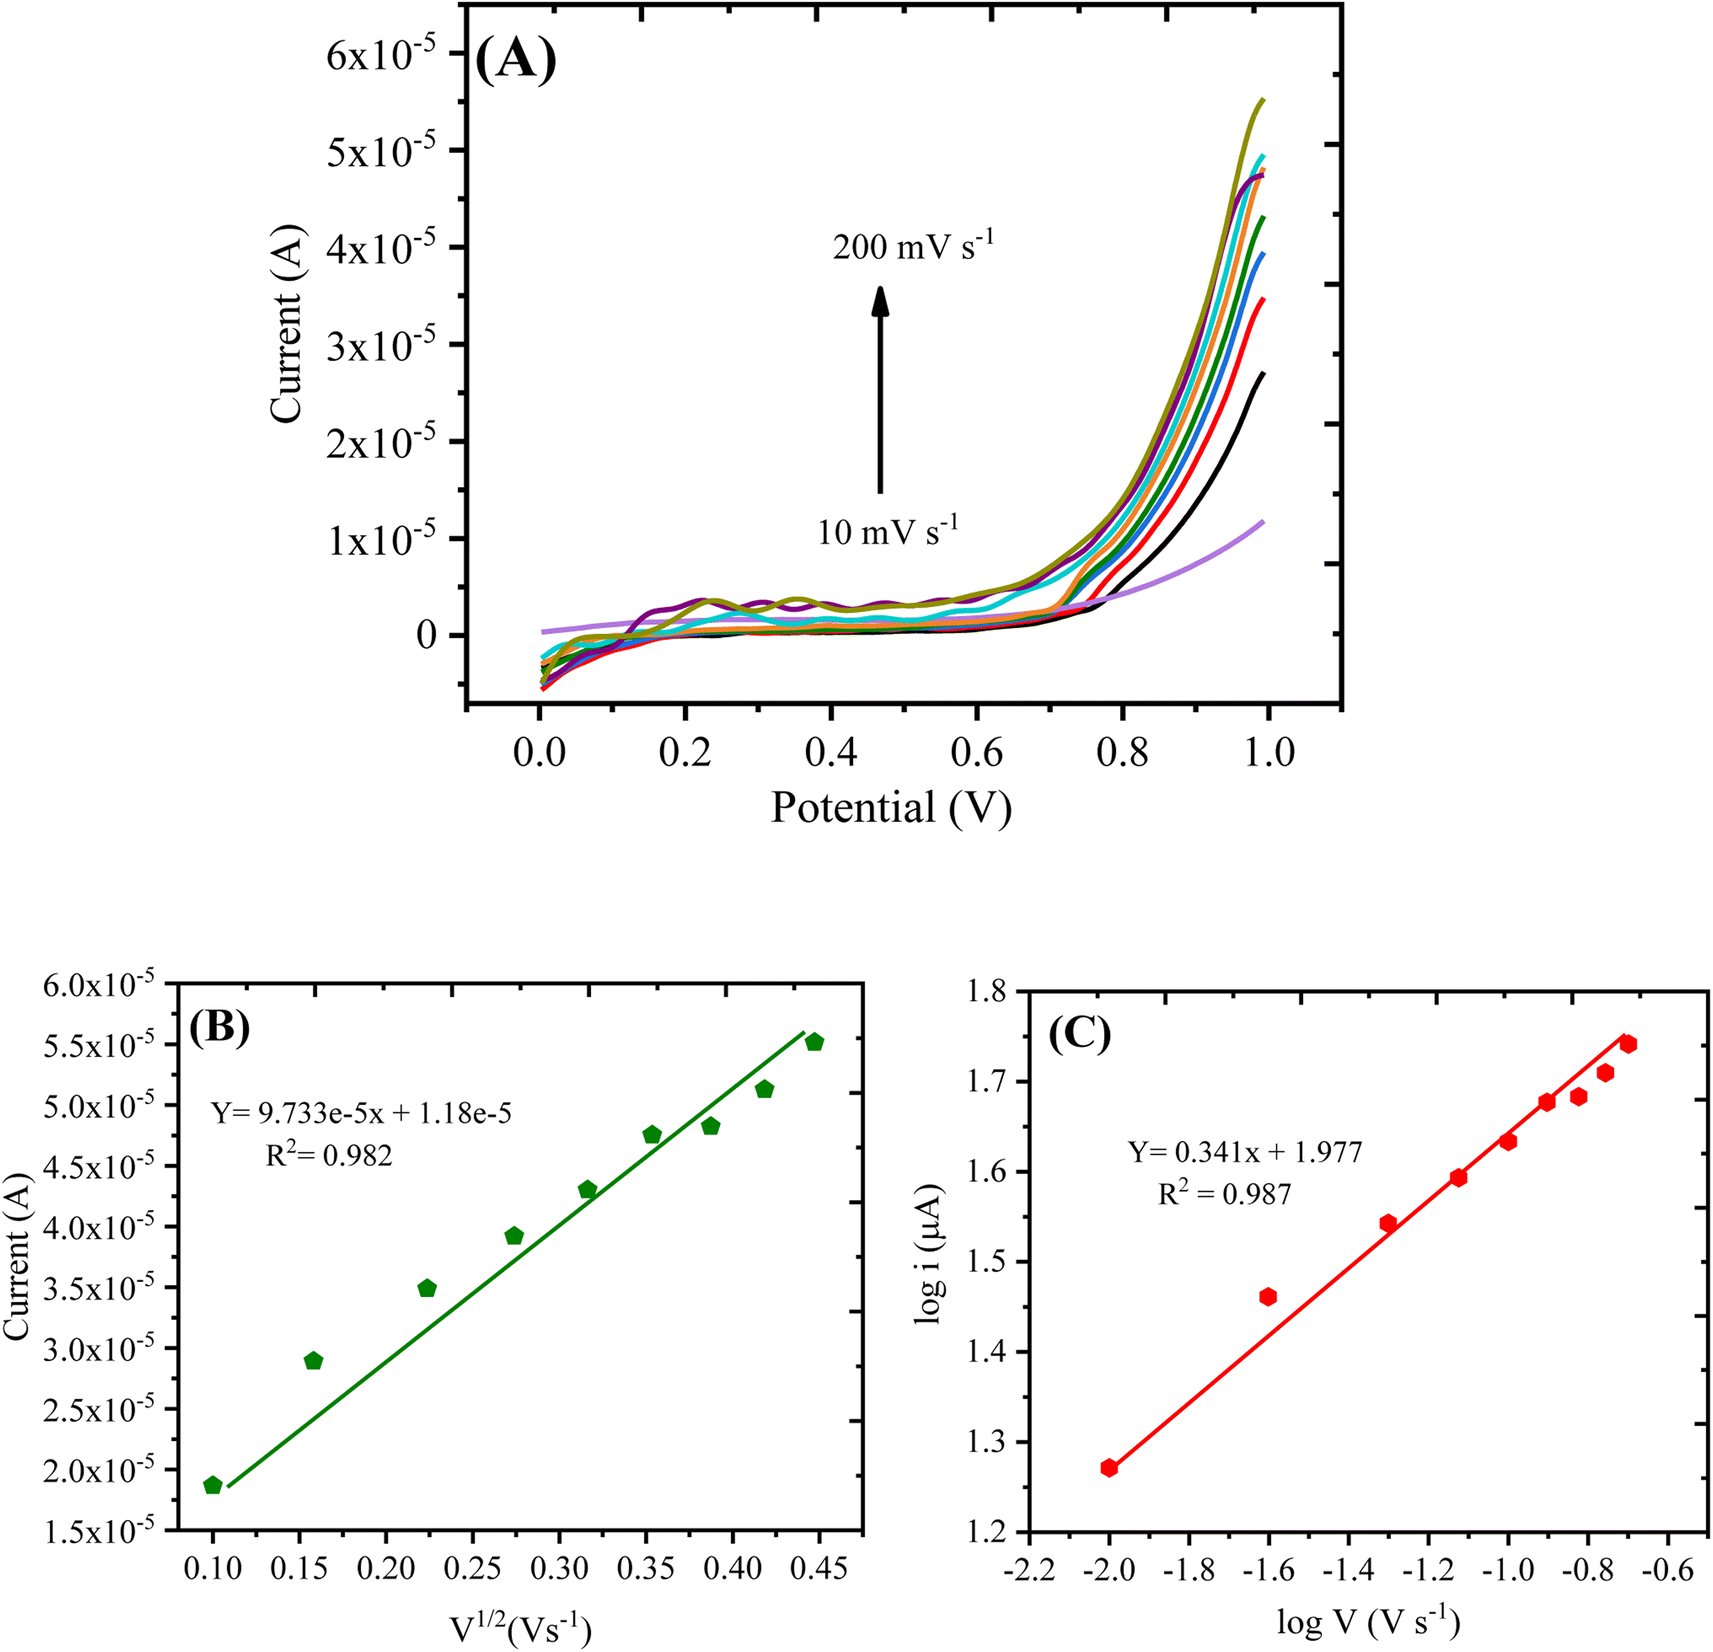 | ||
| Fig. 8 (A) LSV curve showing the scan rate effect on the oxidation current of 0.1 mM H2O2. (B) Oxidation current plotted against v1/2 and (C) the logarithm of the oxidation current plotted against the logarithm of the scan rate. | ||
The linear graph with varying scan rates suggested that the current was proportional to V1/2, which shows that the redox process was diffusion-controlled. Moreover, to demonstrate whether the oxidation reaction was adsorption or diffusion-controlled, another plot was obtained through the logarithm of anodic current vs. logarithm of the scan rate as shown in Fig. 8C, expressed by the following eqn (2):
log![[thin space (1/6-em)]](https://www.rsc.org/images/entities/char_2009.gif) imax = 0.341 × logv + 1.977 (R2 = 0.987) imax = 0.341 × logv + 1.977 (R2 = 0.987)
| (2) |
As per the previous reports,39,40 the slope of 0.5 is related to the diffusion-controlled process, and that centered around 1.0 denotes an adsorption-controlled reaction. For the current work, the obtained slope value (0.341) was close to 0.5; therefore, the oxidation of hydrogen peroxide on the surface of PANI/CeO2(10) nanocomposite-modified GCE can be assigned as a diffusion-controlled reaction.
| imax = 3e − 7 × c(μM) + 8e − 6 (R2 = 0.909) | (3) |
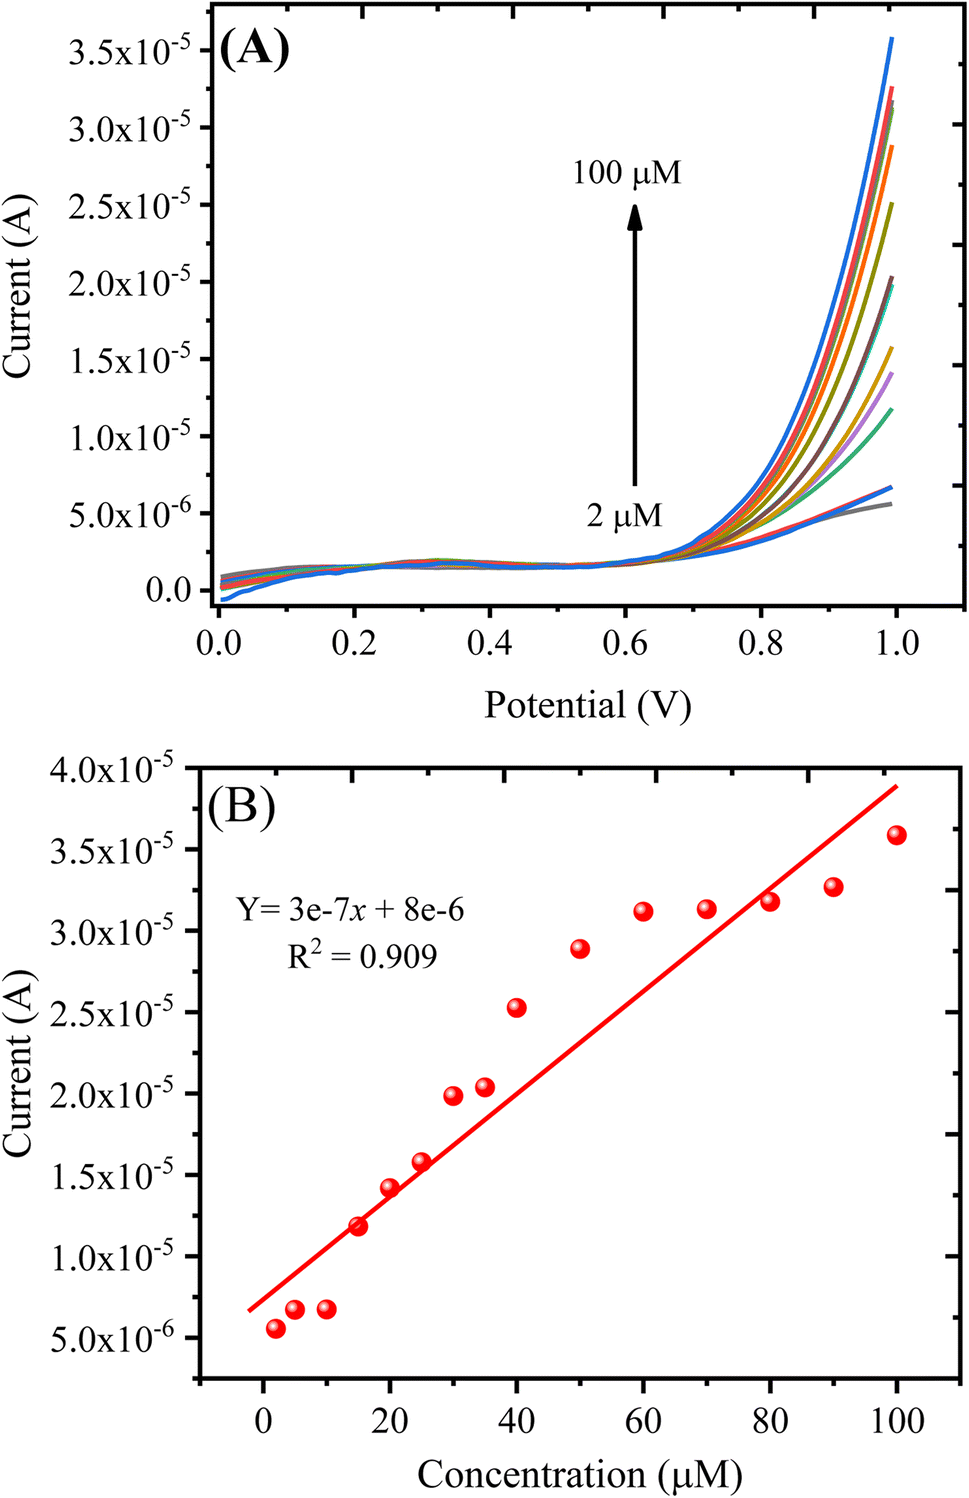 | ||
| Fig. 9 (A) LSV response obtained with the PANI/CeO2(10) nanocomposite-modified GCE in varying concentrations of H2O2. (B) A plot of oxidation current against the concentration of H2O2. | ||
The detection of limit (LOD) can be measured using the formula: LOD = 3S/b, where S represents the standard deviation of the intercept, and b represents the calibration plot slope. The estimated LOD value for the PANI/CeO2(10) nanocomposite-modified GCE towards H2O2 was 0.1484 μM. The quantification limit (LOQ) was measured using the formula: LOQ = 10S/b. The measured value for LOQ was 0.49 μM. The calibration plot was plotted up to the addition of 100.0 μM, which suggested the linear dynamic range for the proposed sensor was from 2 to 100.0 μM.
By applying the Randles-Sevcik equation,43 the EASA of the PANI/CeO2(10) nanocomposite-modified GCE was calculated by recording the CV (Fig. 6A(e)) in the [Fe(CN)6]3−/4− redox couple.
| Ip = 2.69 × 10⁵ × A × n3/2 × D1/2 × C × γ1/2 | (4) |
Ip is the peak current (Ampere), A refers to the electrochemically active surface area (cm2), and D is the diffusion coefficient of 0.5 mM [Fe(CN)6]3−/4− (6.70 × 10⁻⁶ cm2 s−1), C is the concentration of the [Fe(CN)6]3−/4− (mol L−1), n is the number of transferred electrons for the [Fe(CN)6]3−/4− redox couple (n = 1), and γ is the scan rate (V s−1). Accordingly, the EASA of the PANI/CeO2(10) nanocomposite-modified GCE was calculated to be 0.0387 cm2. The surface area of the commercially obtained bare GCE electrode was 0.0316 cm2 (as given by the manufacturer); upon the deposition of the PANI/CeO2(10) nanocomposite, the EASA of the modified GCE was enhanced. This increment in EASA is believed to have aided the modified GCE's electrocatalytic and conductive properties.
The electrocatalytic mechanism for detecting H2O2 using the PANI/CeO2(10) nanocomposite-modified GCE is based on the electrochemical oxidation of H2O2 to O2 under applied potential. As per previous reports, in CeO2 nanoparticles, the anti-oxidation behavior of the active centers can be demonstrated by surface Ce sites that can coordinate with the O2 sites.44,45 For the PANI/CeO2(10) nanocomposite-modified GCE, the probable active centers are Ce4+ and Ce3+ and O2 vacancies. As the H2O2 is incorporated into the working solution, ceria behaves like a nanozyme; the adsorption of H2O2 stimulates the electrochemical process under applied potential by sharing electrons. It was presumed that the mechanism of oxidation for H2O2 on the PANI/CeO2(10) nanocomposite-modified GCE can be represented by reaction 5.46
| H2O2 O2 + 2e− + 2H+ | (5) |
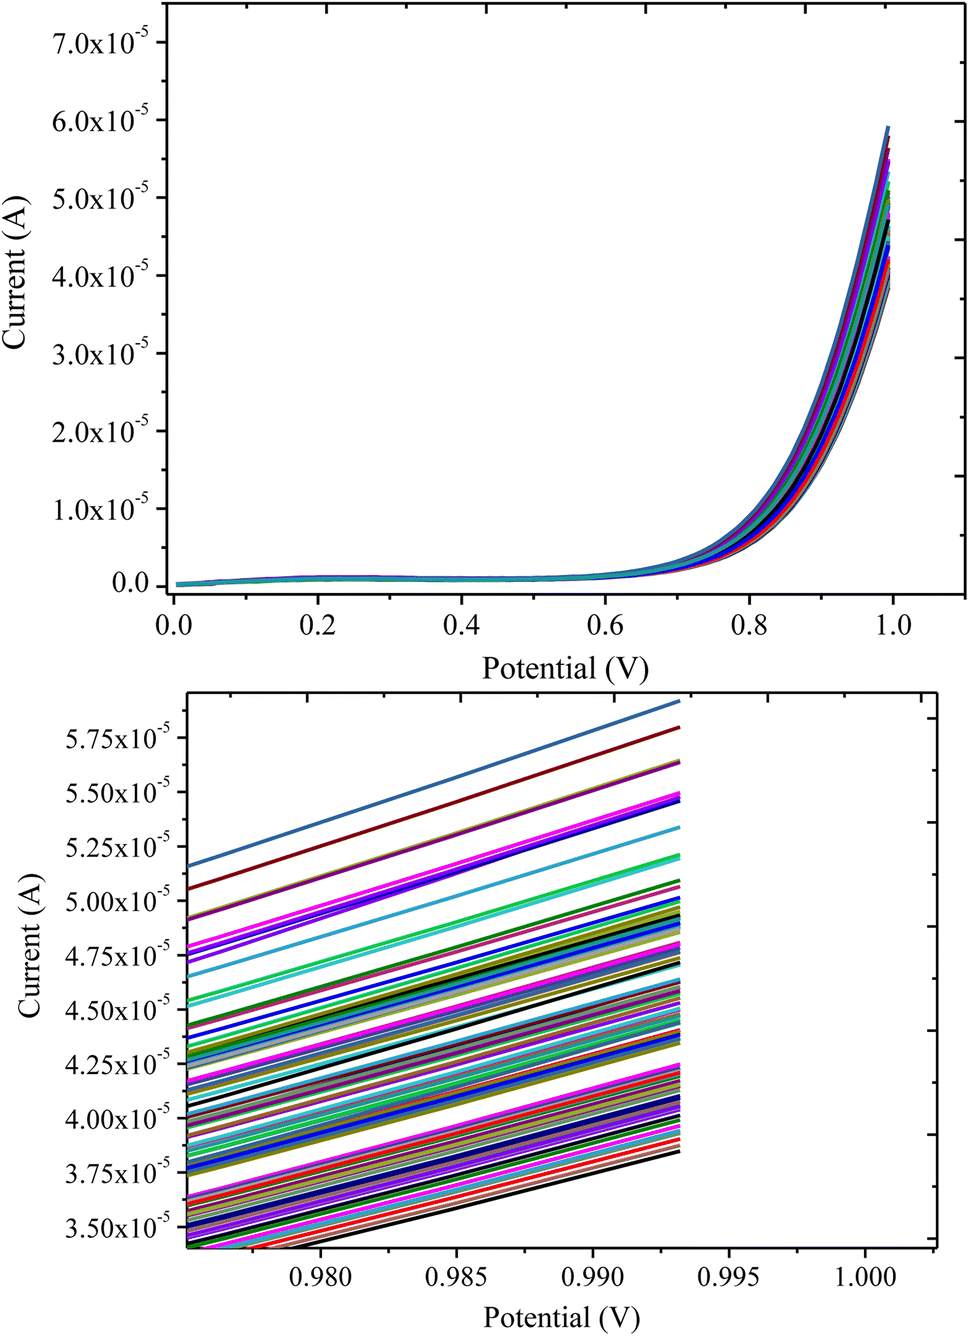 | ||
| Fig. 10 LSV response of the PANI/CeO2(10) nanocomposite-modified GCE in 0.1 mM H2O2 for multiple measurements. | ||
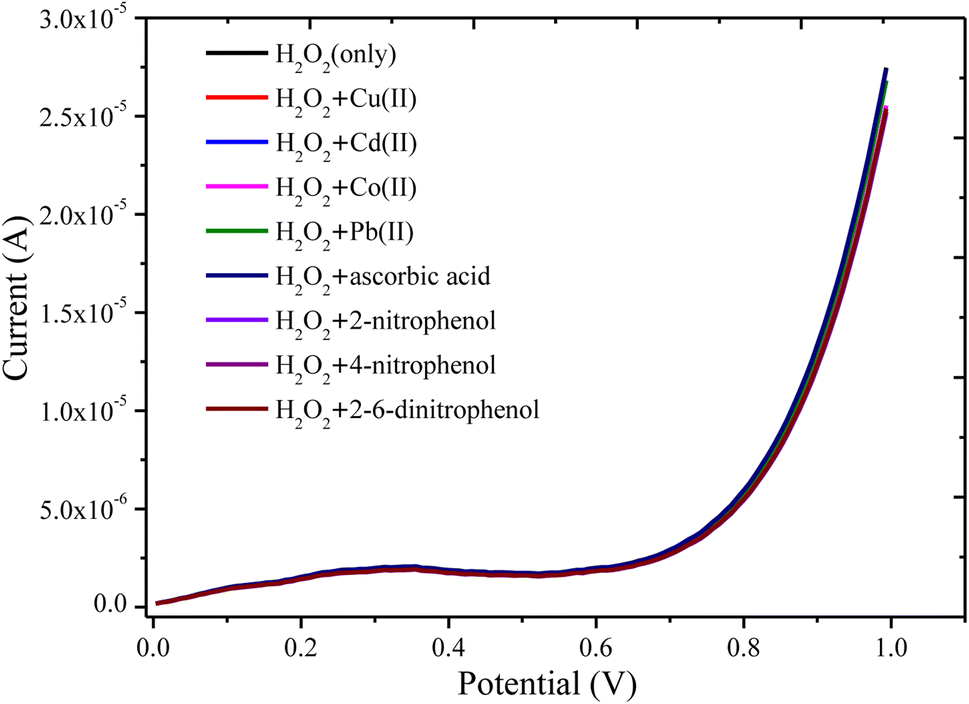 | ||
| Fig. 11 LSV response of the PANI/CeO2(10) nanocomposite-modified GCE in 50 μM of H2O2 and interferent inorganic ions and organic molecules such as Cu2+, Cr6+, Cd2+, Co2+, Pb2+, ascorbic acid, 2-nitrophenol, 4-nitrophenol, and 2,4 dinitrophenol. | ||
3.3 Real sample analysis
The applicability and suitability of the PANI/CeO2(10) nanocomposite-modified GCE for the detection of H2O2 in real samples were investigated through the standard addition method (spiking) as reported elsewhere.47 For this, 10 μM H2O2 was spiked into the milk and tap water samples, and the recovery analysis was carried out. For this investigation, 2.5 ml of real samples were diluted with 22.5 ml of 0.1 M PBS 5.7 for matrix matching. Percentage recovery was then measured using eqn (6). The recovery percentage of hydrogen peroxide in real samples (milk and tap water) ranges from 97 to 103, as presented in Table 1.| Samples | No. of Repeats | Added (μM) | Detected (μM) | Recovery (%) |
|---|---|---|---|---|
| Milk | 1 | 10 | 9.80 | 98 |
| 2 | 10 | 10.10 | 101 | |
| 3 | 10 | 10.30 | 103 | |
| Tap water | 1 | 10 | 9.70 | 97 |
| 2 | 10 | 9.90 | 99 | |
| 3 | 10 | 9.80 | 98 |
The method used was standard addition.
 | (6) |
Ci is the total concentration of analyte, Co stands for the concentration of analyte (before spike), and Cs indicate the concentration of the spiked H2O2.
Table 2 summarizes the sensing probabilities of the fabricated PANI/CeO2(10) nanocomposite-modified GC as compared to the other investigated electrode systems for detecting hydrogen peroxide.
| S.No. | Electrode materials | Linear range | Detection limit | Ref. |
|---|---|---|---|---|
| 1 | Chitosan/Au nanoparticle | 2.0–30.7 μM | 0.532 μM | 48 |
| 2 | PANI-CeO2 | 50–500 mM | 50 mM | 49 |
| 3 | Methylene blue/SiO2 | 0.01–1.2 mM | 4 μM | 50 |
| 4 | ZrO2 | 0.02–9.45 mM | 2 μM | 51 |
| 5 | Nb2O5 | 0.1–100 μM | 0.01 mM | 52 |
| 6 | Pt/carbon nanotube | 5–25000 μM | 1.5 μM | 53 |
| 7 | Ag-nanoparticle/graphene oxide | 100–20000 μM | 1.9 μM | 54 |
| 8 | Graphene-AuNPs | 20–280 μM | 6.0 μM | 55 |
| 9 | Cu2O microcubes | 5–1500 μM | 1.5 μM | 56 |
| 10 | PANI/CeO2(10) | 0.2–100 μM | 0.1484 μM | Present work |
4. Conclusion
We have reported the fabrication of PANI/CeO2(1,3,5,10), followed by deposition on GCE, for use as an electrochemical sensor for the sensitive detection of H2O2. CeO2 nanoparticles were prepared by a simple hydrothermal method at low temperatures. The detailed morphology of the synthesized nanoparticles was characterized by XRD, FESEM, FTIR, and UV-vis spectra and it was revealed that the synthesized nonmaterial are well-crystalline nanoparticles possessing a cubic structure. The CeO2 nanoparticles have been reinforced as a nanofiller to fabricate a set of PANI/CeO2(1,3,5,10) nanocomposites. To confirm the structures, the nanocomposites were structurally characterized by FTIR, XRD, and FESEM measurements. The electrochemical performance of the prepared materials was investigated in detail for hydrogen peroxide detection and determination. The CV results indicated that the increased concentration of CeO2 in the PANI polymer matrix from PANI/CeO2(1) to PANI/CeO2(10)-modified GCE improved the electron transfer rate and produced a high anodic peak current. The PANI/CeO2(10) nanocomposite-modified GCE demonstrated good performance in terms of relative standard deviation (6.36%) and good limit of detection (0.1484 μM), and showed a linear response in the range from 2 μM to 100 μM. The results confirmed that the proposed PANI/CeO2(10) nanocomposite-modified GCE has good stability and reproducibility with high sensitivity for the detection of H2O2 in real samples (milk).Conflicts of interest
There are no conflicts to declare.Acknowledgements
This research work was funded by Institutional Fund Projects under grant no. (IFPIP: 719-130-1442). Therefore, the authors gratefully acknowledge technical and financial support from the Ministry of Education and King Abdulaziz University, DSR, Jeddah, Saudi Arabia.References
- J. Seo, G. Jeon, Eu. S. Jang, S. Bahadar Khan and H. Han, J. Appl. Polym. Sci., 2011, 122, 1101–1108 CrossRef CAS.
- S. B. Khan, K. A. Alamry, H. M. Marwani, A. M. Asiri and M. M. Rahman, Composites, Part B, 2013, 50, 253–258 CrossRef CAS.
- K. A. Alamry, A. Khan and M. A. Hussein, Synth. Met., 2022, 285, 117023 CrossRef CAS.
- B. Tian, L. Zhao, R. Li, T. Zhai, N. Zhang, Z. Duan and L. Tan, Anal. Chem., 2020, 92, 15916–15926 CrossRef CAS PubMed.
- T. Wen, C. Xia, Q. Yu, Y. Yu, S. Li, C. Zhou, K. Sun and S. Yue, Analyst, 2022, 147, 2272–2279 RSC.
- T. Rasheed and K. Rizwan, Biosens. Bioelectron., 2022, 199, 113867 CrossRef CAS PubMed.
- S. B. Khan, K. A. Alamry, E. N. Bifari, A. M. Asiri, M. Yasir, L. Gzara and R. Z. Ahmad, J. Ind. Eng. Chem., 2015, 24, 266–275 CrossRef CAS.
- Z. Zhang and M. Wan, Synth. Met., 2003, 132, 205–212 CrossRef CAS.
- D. K. Rajak, D. D. Pagar, R. Kumar and C. I. Pruncu, J. Mater. Res. Technol., 2019, 8, 6354–6374 CrossRef CAS.
- D. Sazou, Synth. Met., 2001, 118, 133–147 CrossRef CAS.
- K. Sunderland, P. Brunetti, L. Spinu, J. Fang, Z. Wang and W. Lu, Mater. Lett., 2004, 58, 3136–3140 CrossRef CAS.
- T. Sen, S. Mishra and N. G. Shimpi, RSC Adv., 2016, 6, 42196–42222 RSC.
- A. G. MacDiarmid, Curr. Appl. Phys., 2001, 1, 269–279 CrossRef.
- D. Zhang, Z. Kang, X. Liu, J. Guo and Y. Yang, Sens. Actuators, B, 2022, 357, 131419 CrossRef CAS.
- R. Vinodh, R. S. Babu, S. Sambasivam, C. V. V. Muralee Gopi, S. Alzahmi, H. J. Kim, A. L. F. de Barros and I. M. Obaidat, Nanomater, 2022, 12, 1511 CrossRef CAS PubMed.
- V. Osuna, A. Vega-Rios, E. A. Zaragoza-Contreras, I. A. Estrada-Moreno and R. B. Dominguez, Biosens, 2022, 12, 137 CrossRef CAS PubMed.
- Y. Hu, M. Hojamberdiev and D. Geng, J. Mater. Chem. C, 2021, 9, 6970–6990 RSC.
- S. B. Khan, M. Faisal, M. M. Rahman and A. Jamal, Sci. Total Environ., 2011, 409, 2987–2992 CrossRef CAS PubMed.
- H. Jin, N. Wang, L. Xu and S. Hou, Mater. Lett., 2010, 64, 1254–1256 CrossRef CAS.
- M. Palard, J. Balencie, A. Maguer and J. F. Hochepied, Mater. Chem. Phys., 2010, 120, 79–88 CrossRef CAS.
- C. Sun, H. Li, Z. X. Wang, L. Chen and X. Huang, Chem. Lett., 2004, 33, 662–663 CrossRef CAS.
- S. Carrettin, P. Concepción, A. Corma, J. M. López Nieto and V. F. Puntes, Angew. Chem., Int. Ed., 2004, 43, 2538–2540 CrossRef CAS PubMed.
- S. Park, J. M. Vohs and R. J. Gorte, Nature, 2000, 404, 265–267 CrossRef CAS PubMed.
- Q. CUI, X. DONG, J. WANG and M. LI, J. Rare Earths, 2008, 26, 664–669 CrossRef.
- N. Tsud, T. Skála, K. Mašek, P. Hanyš, M. Takahashi, H. Suga, T. Mori, H. Yoshikawa, M. Yoshitake, K. Kobayashi and V. Matolín, Thin Solid Films, 2010, 518, 2206–2209 CrossRef CAS.
- L. Li, H. Liu, Y. Wang, J. Jiang and F. Xu, J. Colloid Interface Sci., 2008, 321, 265–271 CrossRef CAS PubMed.
- M. M. Rahman, M. A. Hussein, K. A. Alamry, F. M. Al-Shehry and A. M. Asiri, Nano-Struct. Nano-Objects, 2018, 15, 63–74 CrossRef CAS.
- T. Li, X. Wang, P. Liu, B. Yang, S. Diao and Y. Gao, Synth. Met., 2019, 258, 116194 CrossRef CAS.
- G. Xu, N. Wang, J. Wei, L. Lv, J. Zhang, Z. Chen and Q. Xu, Ind. Eng. Chem. Res., 2012, 51, 14390–14398 CrossRef CAS.
- B. Guo, Y. Zhao, W. Wu, H. Meng, H. Zou, J. Chen and G. Chu, Chem. Eng. Process., 2013, 70, 1–8 CrossRef CAS.
- J. X. Feng, S. Y. Tong, Y. X. Tong and G. R. Li, J. Am. Chem. Soc., 2018, 140, 5118–5126 CrossRef CAS PubMed.
- L. Ren, G. Zhang, Z. Yan, L. Kang, H. Xu, F. Shi, Z. Lei and Z. H. Liu, ACS Appl. Mater. Interfaces, 2015, 7, 28294–28302 CrossRef CAS PubMed.
- J. Zhang, J. Wang, J. Yang, Y. Wang and M. B. Chan-Park, ACS Sustainable Chem. Eng., 2014, 2, 2291–2296 CrossRef CAS.
- J. Xu, G. Li and L. Li, Mater. Res. Bull., 2008, 43, 990–995 CrossRef CAS.
- Y. He, Mater. Chem. Phys., 2005, 92, 134–137 CrossRef CAS.
- Y. Sasikumar, A. M. Kumar, Z. M. Gasem and E. E. Ebenso, Appl. Surf. Sci., 2015, 330, 207–215 CrossRef CAS.
- F. Kuralay, M. Dumangöz and S. Tunç, Talanta, 2015, 144, 1133–1138 CrossRef CAS PubMed.
- A. Karimi, S. W. Husain, M. Hosseini, P. A. Azar and M. R. Ganjali, Sens. Actuators, B, 2018, 271, 90–96 CrossRef CAS.
- J. Wu, Int. J. Electrochem. Sci., 2016, 5165–5179 CrossRef CAS.
- I. Tiwari, M. Gupta, P. Sinha and S. K. Aggarwal, Electrochim. Acta, 2012, 76, 106–111 CrossRef CAS.
- A. J. Bard and L. R. Faulkner, Electrochemical Methods: Fundamentals and Applications, Wiley, 2nd edn, 2000 Search PubMed.
- S. R. C. Douglas, A. Skoog, D. M. West, and F. James Holler, Fundamentals of analytical chemistry, Thomson-Brooks/Cole, Belmont, Calif, 9th edn, 2014 Search PubMed.
- W. A. Adeosun, A. M. Asiri, H. M. Marwani and M. M. Rahman, ChemistrySelect, 2020, 5, 156–164 CrossRef CAS.
- C. J. Neal, A. Gupta, S. Barkam, S. Saraf, S. Das, H. J. Cho and S. Seal, Sci. Rep., 2017, 7, 1324 CrossRef PubMed.
- T. Pirmohamed, J. M. Dowding, S. Singh, B. Wasserman, E. Heckert, A. S. Karakoti, J. E. S. King, S. Seal and W. T. Self, Chem. Commun., 2010, 46, 2736 RSC.
- S. Singh, M. Singh, K. Mitra, R. Singh, S. K. Sen Gupta, I. Tiwari and B. Ray, Electrochim. Acta, 2017, 258, 1435–1444 CrossRef CAS.
- K. A. Alamry, A. Khan, M. A. Hussein and S. Y. Alfaifi, Microchem. J., 2022, 172, 106902 CrossRef CAS.
- Q. Xu, C. Mao, N. N. Liu, J. J. Zhu and J. Shen, React. Funct. Polym., 2006, 66, 863–870 CrossRef CAS.
- A. A. Ansari, G. Sumana, R. Khan and B. D. Malhotra, J. Nanosci. Nanotechnol., 2009, 9, 4679–4685 CrossRef CAS PubMed.
- H. Yao, N. Li, S. Xu, J. Z. Xu, J. J. Zhu and H. Y. Chen, Biosens. Bioelectron., 2005, 21, 372–377 CrossRef CAS PubMed.
- Z. Tong, R. Yuan, Y. Chai, Y. Xie and S. Chen, J. Biotechnol., 2007, 128, 567–575 CrossRef CAS PubMed.
- X. Xu, B. Tian, S. Zhang, J. Kong, D. Zhao and B. Liu, Anal. Chim. Acta, 2004, 519, 31–38 CrossRef CAS.
- Z. Wen, S. Ci and J. Li, J. Phys. Chem. C, 2009, 113, 13482–13487 CrossRef CAS.
- W. Lu, G. Chang, Y. Luo, F. Liao and X. Sun, J. Mater. Sci., 2011, 46, 5260–5266 CrossRef CAS.
- J. Hu, F. Li, K. Wang, D. Han, Q. Zhang, J. Yuan and L. Niu, Talanta, 2012, 93, 345–349 CrossRef CAS PubMed.
- L. Zhang, H. Li, Y. Ni, J. Li, K. Liao and G. Zhao, Electrochem. Commun., 2009, 11, 812–815 CrossRef CAS.
| This journal is © The Royal Society of Chemistry 2022 |