
 Open Access Article
 This Open Access Article is licensed under a Creative Commons Attribution-Non Commercial 3.0 Unported Licence
Antibacterial activity of the micro and nanostructures of the optical material tris(8-hydroxyquinoline)aluminum and its application as an antimicrobial coating†
Abdu Saeed *abc,
Aysh Y. Madkhlid,
Rami Adel Pashameahe,
Noor M. Bataweelfg,
Mir Ali Razvi*a and
Numan Salah*c
*abc,
Aysh Y. Madkhlid,
Rami Adel Pashameahe,
Noor M. Bataweelfg,
Mir Ali Razvi*a and
Numan Salah*c
aDepartment of Physics, Faculty of Science, King Abdulaziz University, Jeddah 21589, Saudi Arabia. E-mail: Abdusaeed79@hotmail.com; Abdusaeed@tu.edu.ye; Tel: +966563190832
bDepartment of Physics, Thamar University, Thamar 87246, Yemen
cCenter of Nanotechnology, King Abdulaziz University, Jeddah 21589, Saudi Arabia
dDepartment of Physics, Faculty of Science, Jazan University, Jazan 45142, Saudi Arabia
eDepartment of Chemistry, Faculty of Applied Science, Umm Al-Qura University, Makkah 24230, Saudi Arabia
fDepartment of Biological Science, Faculty of Science, King Abdulaziz University, Jeddah 21589, Saudi Arabia
gKing Fahd Medical Research Centre, King Abdulaziz University, Jeddah 21589, Saudi Arabia
First published on 23rd September 2022
Abstract
Although tris(8-hydroxyquinoline)aluminum (Alq3), a fluorescent optical organometallic material, is known for its applications in optoelectronics, it has only few and limited applications in the biological field. In this study, the antibacterial activity of Alq3 micro and nanostructures was investigated. We prepared Alq3 nanostructures. We prepared nanosized Alq3 as rice-like structures that assembled into flower shapes with an α-crystal phase. Then, Alq3 micro and nanostructure antibacterial activities were estimated against seven human pathogenic bacterial strains. Besides, we compared their antibacterial activities with those of standard antibiotics. The minimal inhibitory concentration (MIC), minimum bactericidal concentration (MBC), and IC50 were evaluated. Alq3 micro and nanostructure antibacterial activity showed considerable values compared to standard antibiotics. Besides, the obtained data revealed that the antibacterial activity of Alq3 in nanostructures with a new morphology is more than that in microstructures. The antibacterial activity of Alq3 nanostructures was attributed to their more surface interactions with the bacterial cell wall. The molecules of 8-hydroxyquinoline in the Alq3 structure could play crucial roles in its antibacterial activity. To apply the achieved results, Alq3 was incorporated with polystyrene (PS) in a ratio of 2% to fabricate a PS/Alq3 composite and used to coat glass beakers, which showed inhibition in the bacterial growth reduced to 65% compared with non-coated beakers. The finding of this study showed that Alq3 could be used as a promising antimicrobial coating.
1. Introduction
Tris(8-hydroxyquinoline)aluminum (Alq3) is a well-known optical material that has been used in the manufacture and design of optoelectronic devices, especially in organic light-emitting diode (OLED) designs.1,2 It is an organometallic semiconductor, which is also considered one of the most widely used small molecules. It is a chelate complex with polymorph crystal structures.3–5 Where its crystal could be a meridional (mer) or facial (fac) isomer, it was proved that Alq3 could exist in five different crystal phases, namely, α, β, γ, ε, and δ.3–5 It has an efficient luminescence property with thermal stability at ≥350 °C. Although Alq3 has been utilized mainly in optoelectronic manufacturing, new applications have been performed; recently, it has been used in the direction of radiation detection as an X-ray6 and ultraviolet (UV) dosimeter.7 In the field of medical and bio-applications, it was used to recognize DNA.8 Besides, in a previous study, we have found that Alq3 can kill human colon cancer cell lines (HCT116); its fluorescence was also utilized to follow gelatin degradation.9 Recently, in more detail, Alq3 toxicity was investigated10 with HCT116, human cell line breast cancer (MCF7), and human foreskin fibroblasts cell line (HFF-1); besides, the Alq3 fluorescence was investigated to be used as a dye for in vitro bioimaging for the first time.10The presence of microorganisms that cause harms to human health is a great concern of societies, peoples, countries, and humanity in general. The diversity of infections and the emergence of new diseases further complicate the matter and exacerbates the issue. What is more, despite the existence and innovation of many antibiotics, these microorganisms are rapidly developing their resistance to antibiotics. Accordingly, bacterial contamination has become one of the serious threats to human health. It is there in all human activities and daily life; for instance, it can occur in food.11 Moreover, it occurs on surfaces in hospitals,12 where it may spread to the hands of caregivers as a result of direct contact with patients and people with multi-infection.13 Although many materials have been synthesized for antibacterial applications,14–25 finding new antimicrobial materials is essential in the light of emerging antibiotic resistance.
In our previous studies,9,10 we have found the effect of Alq3, especially its nanoparticles (NPs),9 in killing cancer cells, which could indicate the possibility of using it as an antibacterial material. Therefore, we conducted this study to investigate the antibacterial activity of Alq3 optical materials. To the best of our knowledge, despite many studies devoted to studying Alq3 and its properties and uses, no investigation has been dedicated to studying its antibacterial activity. In this study, we investigated the antibacterial activity of its micro and nanostructures. The antibacterial activity of Alq3 was studied on seven different types of Gram-positive and gram-negative bacteria to obtain a comprehensive and detailed study. We evaluated the antibacterial activity by an agar well diffusion (AWD) method and a resazurin assay. Furthermore, we added Alq3 to polystyrene (PS) to form a PS/Alq3 composite; then, we studied the bacterial growth in a glassware coated with a PS/Alq3 composite. Many details of the study and its results are included in the following sections.
2. Methodology
2.1. Materials
Alq3 was obtained from (Tokyo Chemical Industry Company Limited, Japan). Resazurin, phosphate-buffered saline (PBS), and gentamicin (GM) solution (50 mg ml−1) were purchased from (Sigma-Aldrich, Germany). Mueller-Hinton agar (MHA) (Condalab, Spain) and Mueller-Hinton broth (MHB) (Scharlau, Spain) were used as the bacteriological media. Commercially standard antibiotics (St. antibiotics) discs (Mast Group Ltd, UK) were used as control antibiotics. Petri dishes, glassware, and sterilized swap cotton were obtained from the local market (Jeddah, Saudi Arabia). Microtiter plates (96-Well with lid) were obtained from SPL Life Sciences Co. (SPL, South Korea). PS polymer was obtained from SABIC (SABIC Co., Saudi Arabia). The materials were used directly without further purification.2.2. Sampling and Alq3 nanoparticle (NP) preparation
Alq3 original powders were named (Alq3 as rec) sample. We used the original powders of Alq3 to prepare Alq3 NPs. We prepared the Alq3 NPs based on the published work with modifications if necessary. Briefly, we dissolved the original powders of Alq3 in chloroform (15 mM); chloroform is a preferred solvent over other solvents due to its excellent properties as a solvent for Alq3 with a reasonable boiling temperature (61.15 °C). Then, the Alq3 chloroform solution was placed in an ultrasonic bath for completely dissolving Alq3. After that, the solution was added dropwise into deionized water at a temperature of 60 °C under stirring. For chloroform to get volatilized, the stirring was continued at 60 °C for 15 minutes after the dropwise addition. Then, the Alq3-water solution was centrifuged, and the precipitate was dried at 70 °C. The obtained powders were named Alq3 NP sample. Finally, Alq3 as rec and Alq3 NP samples were used to perform characterizations and antibacterial activity experiments.2.3. Characterization techniques
We investigated the morphology and particle size of both Alq3 as rec and Alq3 NP samples using a field-emission scanning electron microscope (FESEM), model JSM-7600F (JEOL, Japan). We recorded their X-ray powder diffraction (XRPD) patterns to study their crystallinity and crystal phases using an X-ray diffractometer, model Ultima IV (Rigaku, Japan). The XRPD patterns of the Alq3 samples were scanned at room temperature and an angular range (2θ) of 5–28° in the step of 0.05° and a continuous mode (λ = 1.54 Å, I = 40 mA, and V = 40 kV). The chemical functional groups of Alq3 were verified and characterized using a Fourier transform infrared (FTIR) spectrometer, model Nicolet iS10 FTIR (Thermo Scientific, USA). We recorded their FTIR spectra using the attenuated total reflection (ATR) sampling technique in which the ATR occurred in a germanium crystal. We recorded both photoluminescence (PL) excitation and emission spectra of the Alq3 samples using a fluorescence spectrofluorophotometer, model RF-5301 PC (Shimadzu, Japan).2.4. Antibacterial activity tests
 | (1) |
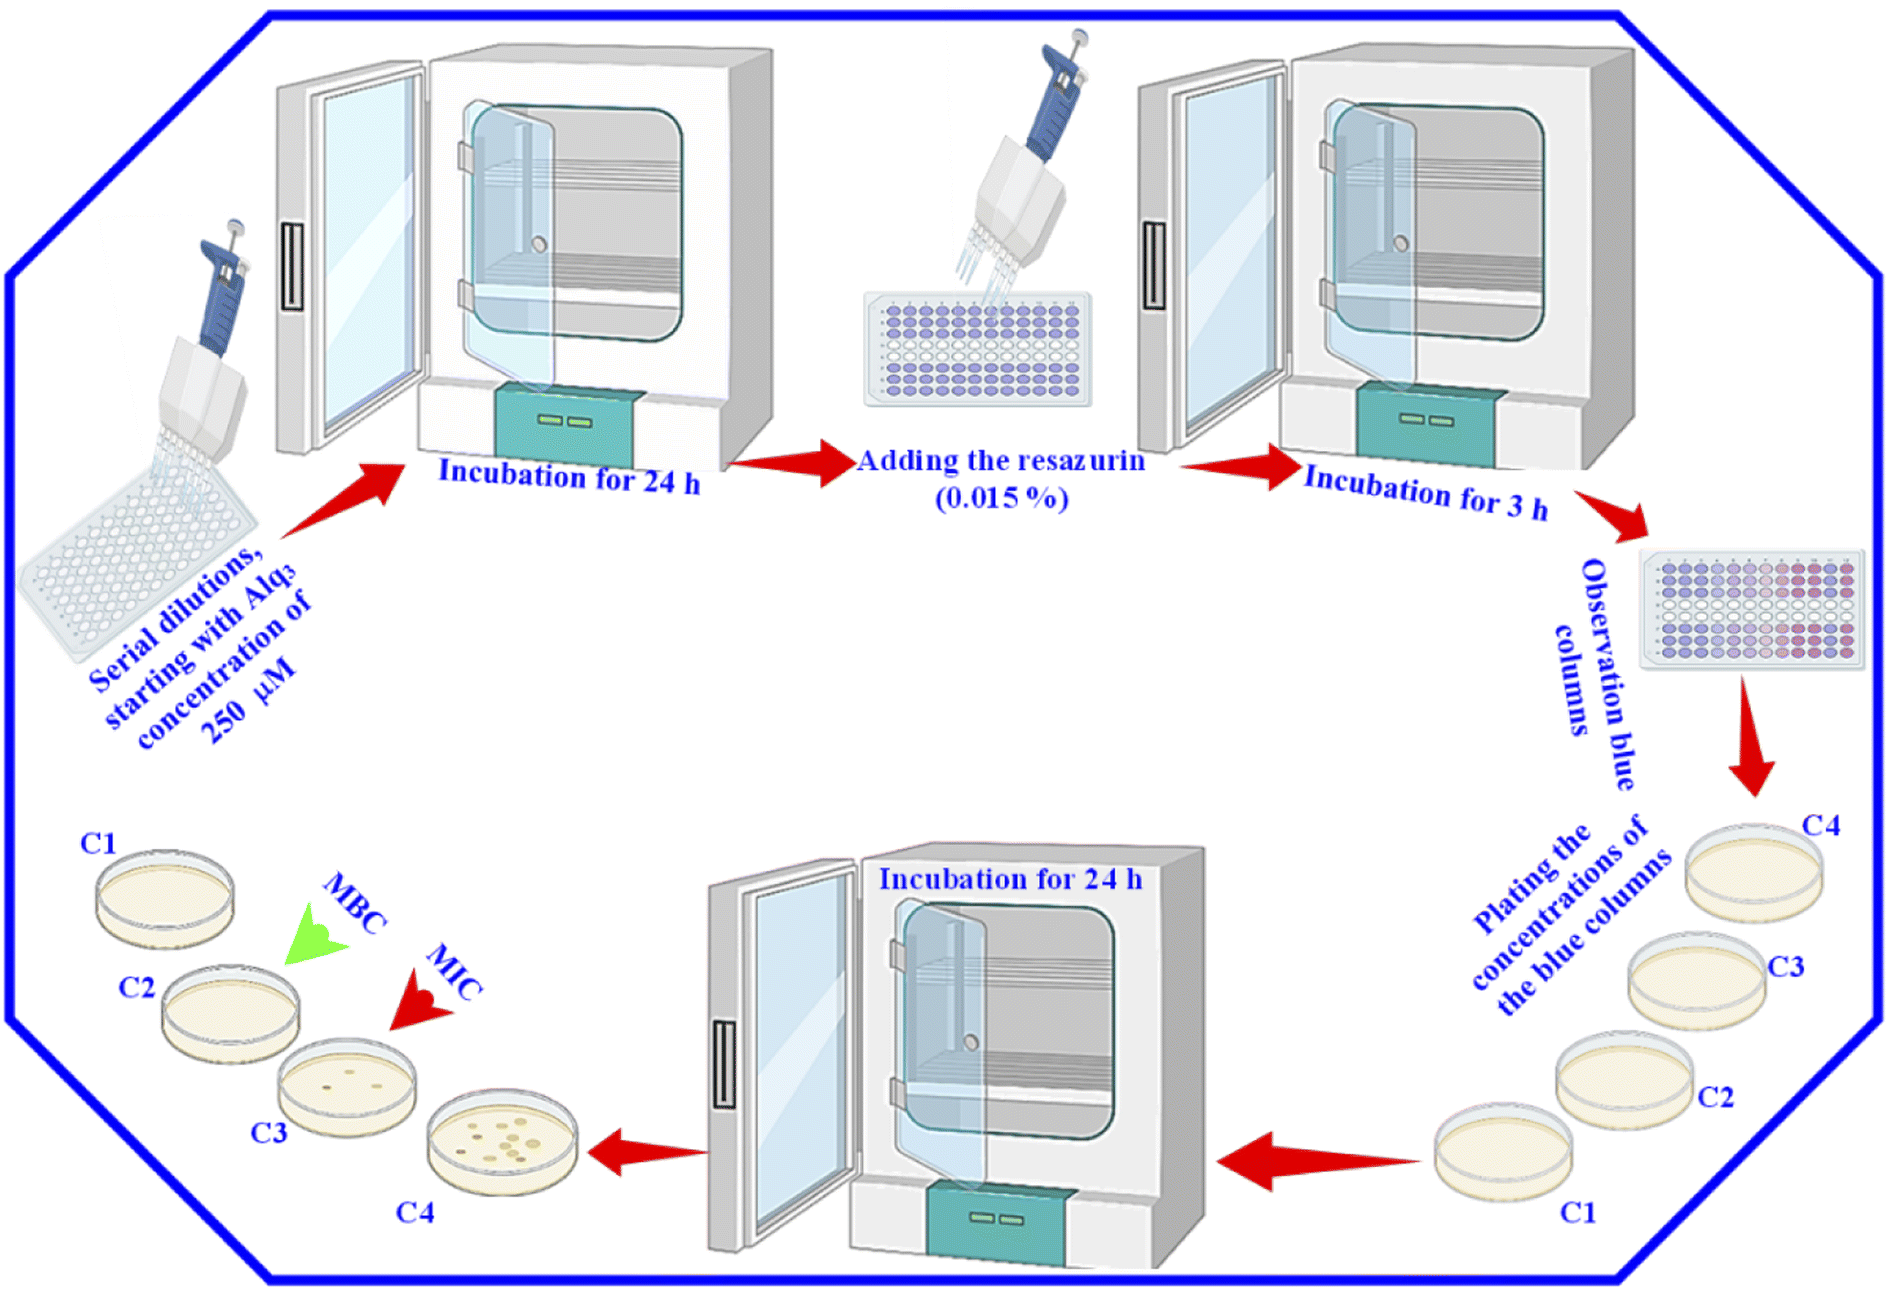 | ||
| Fig. 1 Illustration of the resazurin assay using 96-well microtiter plates. | ||
After that, for the estimation of MIC and MBC, 30 μl of resazurin (0.015%) was added to all wells, and the 96-well microtiter plates were again incubated for 3 h. Then, we observed the color change. We considered the columns with blue color (unchanged color) as above the MIC value; we plated the content of these columns to determine the MIC and MBC. Besides, we used GM as the St. antibiotic; the serial dilutions were performed with the GM to obtain the same concentrations of the Alq3 samples, and the same procedures were applied.
2.5. PS/Alq3 composite preparation
After we studied the effectiveness of Alq3 as an antimicrobial material, we incorporated it into a PS polymer to form an antibacterial composite; Fig. 2 shows a scheme that summarizes the fabrication of PS/Alq3 composites. The PS granules and the Alq3 powder were dissolved in chloroform separately under stirring at 40 °C to get solutions A and B; when they got completely dissolved in chloroform, we added the Alq3 chloroform solution (A) to the PS chloroform solution (B) to form solution (C). The stirring for solution C continued for 1 h till it became homogenous. Then, 10 ml glass beakers were coated with a PS polymer and a PS/Alq3 composite by immersing them in solutions B and C. Then, they were pulled out slowly from the solutions; they were dried in an air atmosphere at room temperature. The thickness of the coated layer was investigated by SEM.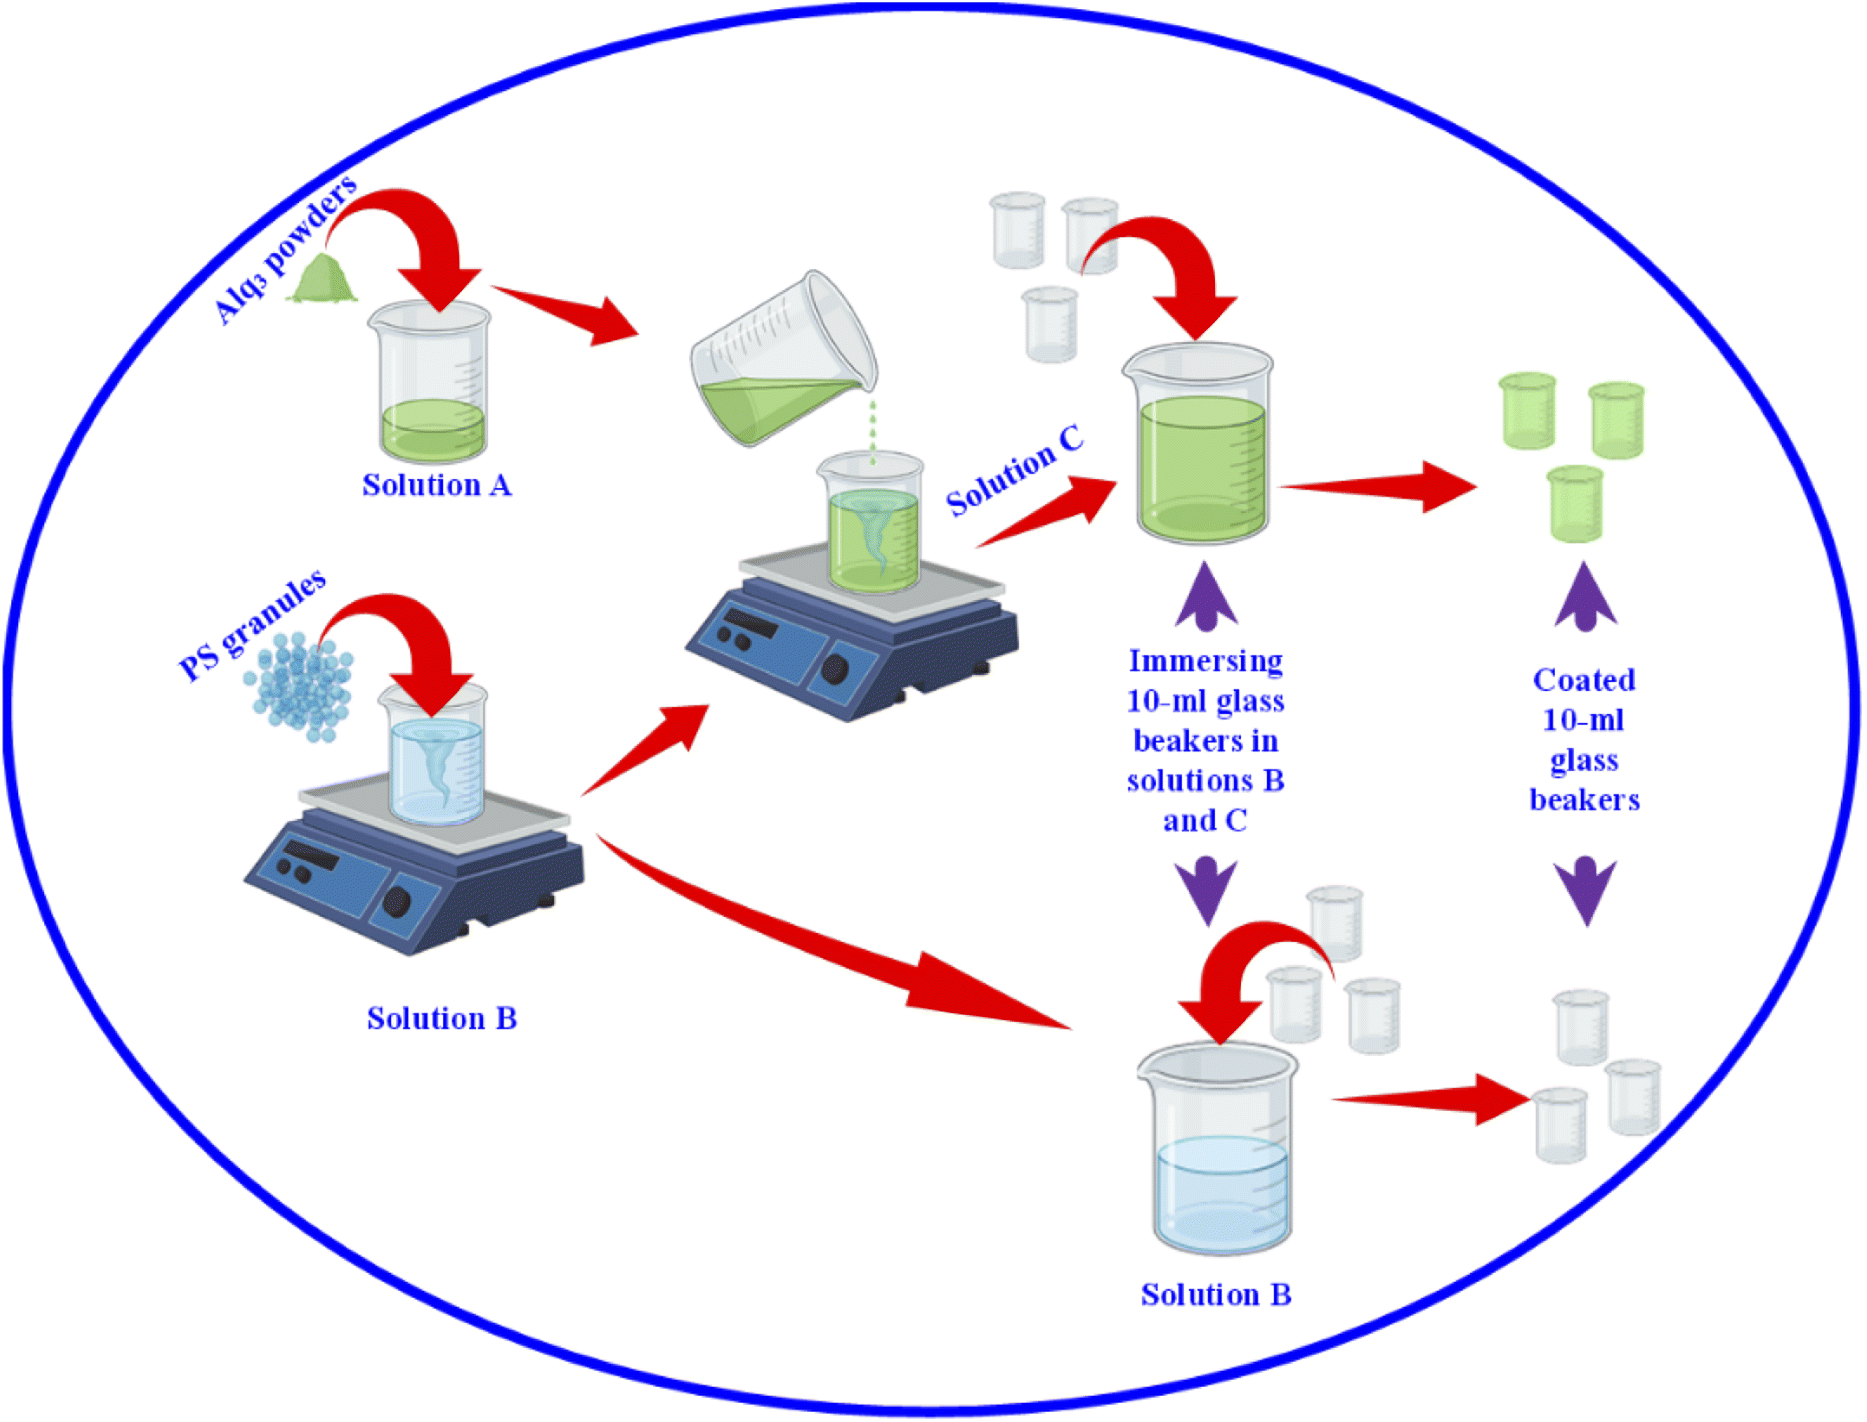 | ||
| Fig. 2 Schematic diagram showing the fabrication of PS/Alq3 as an antibacterial composite. | ||
After that, we grew bacterial suspensions in coated beakers (3 ml/beaker), and also in the non-coated beakers as NC; non-coated beakers that contained 5 μg ml−1 of St. antibiotic GM served as PC group. The turbidity was adjusted to be the same for all beakers. Then, the beakers were covered with parafilm; they were incubated in an air atmosphere at 37 °C inside the incubator. The turbidity was recorded by measuring the absorbance at 600 nm after incubation. The bacterial growth was calculated from the absorbance as follows:
 | (2) |
2.6. Statistical and data analysis
The experiments were repeated five times; then, the data were expressed as average values, standard deviation (SD). IC50s were extracted from dose–response curves by fitting the data measured during antibacterial activity tests. In this work, all statistical analyses and extraction of data were performed using OriginPro 2019b version 9.65.3. Results and discussion
3.1. Alq3 sample characterizations
We prepared the Alq3 nanostructures and investigated their morphology and sizes by SEM. Fig. 3a and 3b display the captured SEM images of both Alq3 as rec and Alq3 NP samples, respectively. Besides, we photographed the samples at a higher magnification, shown in Fig. 3c and d, to get a clear view of the particle size of the Alq3 samples. As we can observe in Fig. 3a and c, the Alq3 as rec sample appear to have rod shapes that are aggregative in bundles; the length of the rods is in the range between ∼500 nm and ∼2 μm with a diameter of ∼200 nm, whereas the prepared Alq3 NPs show small particles with a length up to ∼130 nm and a diameter less than ∼70 nm, which are nearly rice-like shapes, that are aggregative with flower-like shapes (Fig. 3b and d); hence, it can be said that the prepared Alq3 NPs are rice-like nanostructures aggregated into flower shapes. This result is in agreement with the published works9,30 reporting the preparation of Alq3 NPs. The change in morphology between the Alq3 as rec and Alq3 NP samples can be understood as the ratio of solvent (chloroform) to water playing a crucial role in controlling the particle growth, shape, and size, where the morphology transformation process is different because of the various chemical and physical properties, such as surface tension, viscosity, and density between the solvent and the water during Alq3 re-precipitation.9,30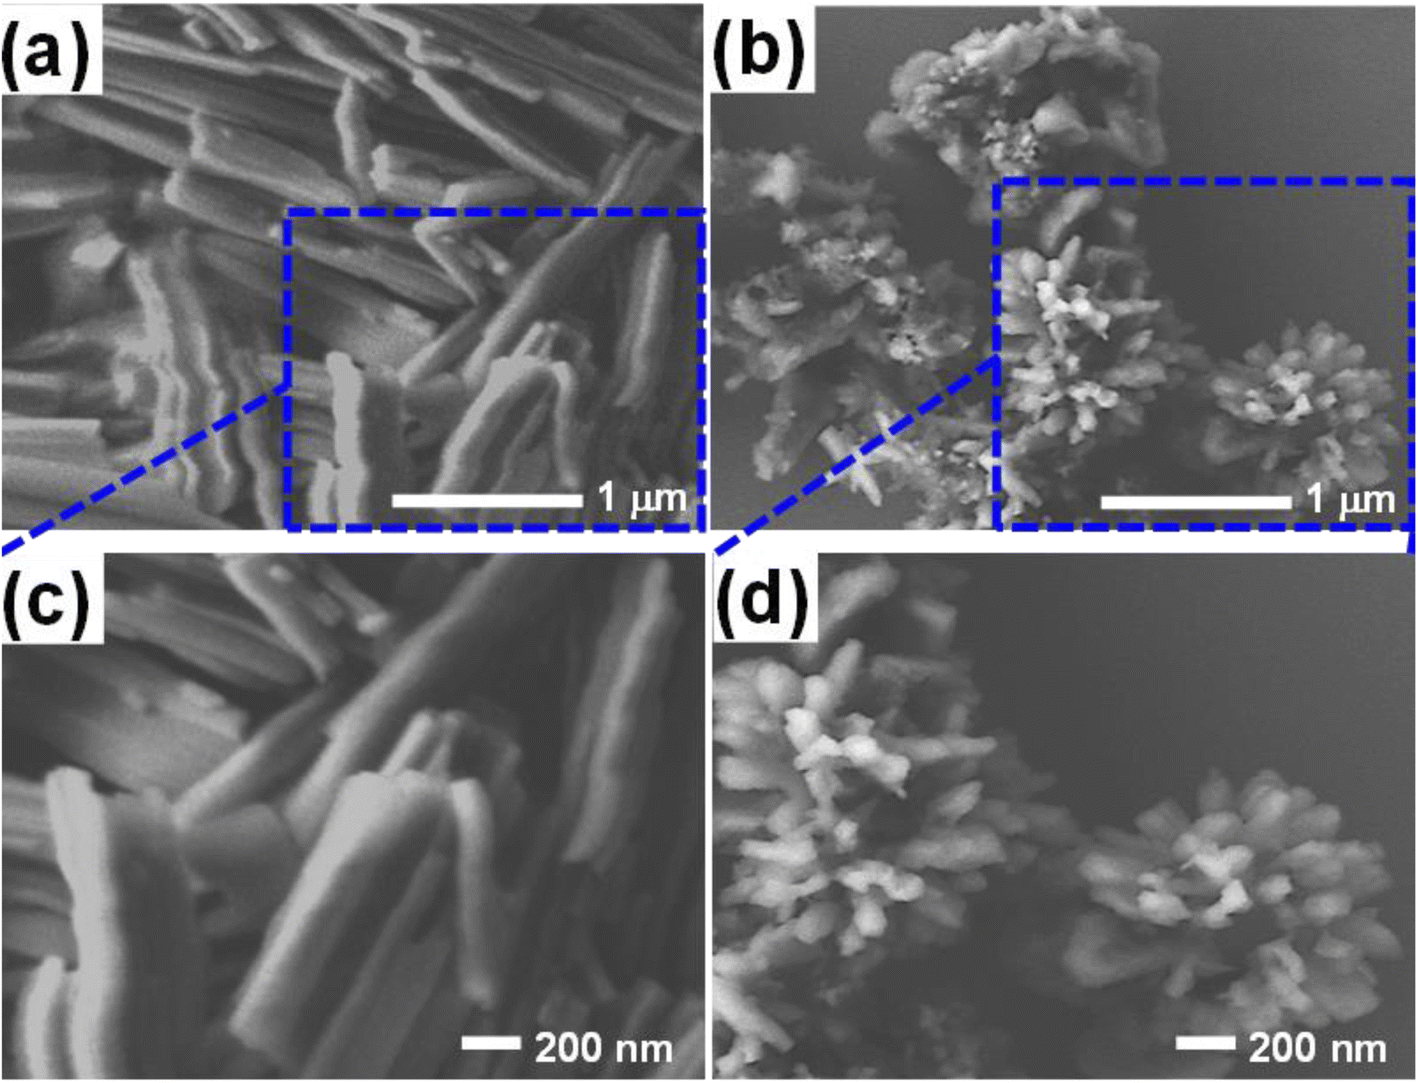 | ||
| Fig. 3 SEM images of the Alq3 samples: (a) and (b) images of Alq3 as rec and Alq3 NP samples, respectively; (c) and (d) their images at a higher magnification. | ||
The XRPD patterns of the Alq3 as rec and Alq3 NP samples' powders are shown in Fig. 4a, which displays different diffraction peaks for both samples, indicating the samples' crystallization. The diffracted peaks (Miller indices) were indexed based on ICDD PDF card no. 00-026-1550 and published works.30–32 All diffracted peaks in the XRPD patterns of both Alq3 as rec and Alq3 NP samples' powders matched with the α-Alq3 crystal phase. The difference that can be observed between the two samples is that the intensities of the diffracted peaks of the Alq3 as rec sample's powder are higher than those of the diffracted peaks of the Alq3 NP powder sample. This observation points out the differences in the crystallite size; it could also indicate that the crystallinity degree of the Alq3 as rec sample is greater than that of the Alq3 NP sample. This result was observed in a published study,32 in which the Alq3 NPs prepared without adding surfactants showed a lower degree of crystallization. During the preparation of Alq3 nanoparticles, we avoided adding any other material as a surfactant to prevent the influence on the results of the antibacterial activity experiments.
 | ||
| Fig. 4 (a) XRPD patterns and (b) FTIR spectra of the Alq3 as rec and Alq3 NP samples' powders. | ||
The infrared spectra of both Alq3 as rec and Alq3 NP samples' powders were recorded; Fig. 4b displays the FTIR absorbance spectra recorded in the spectral range between 1650 and 600 cm−1. Both samples have the same spectral features, indicating that the chemical bonds did not change during the preparation of the nanostructures. In general, and based on the published works,9,33,34 the FTIR spectral peaks can be divided into four spectral regions resulting from the vibration of chemical bonds between the atoms that make up the Alq3 molecule. The peaks in the spectral range starting from 1650 to1400 cm−1 could be ascribed to the stretching vibration of the aromatic C![[double bond, length as m-dash]](https://www.rsc.org/images/entities/char_e001.gif) C bonds, while the peaks in the spectral range of 1400–1200 cm−1 were assigned to the vibration of the aromatic amine resonances C–N–C bonds. The peaks between 1200 and 700 cm−1 were attributed to the in-plane bending/out-of-plane wagging vibrations of the aromatic C–H bonds, besides the CCCC torsional motions of the quinoline skeleton. The FTIR absorbance peaks in the spectral range 700–600 cm−1 belonged to the stretching vibration modes of the metal–ligand bonds (Al–N and Al–O).
C bonds, while the peaks in the spectral range of 1400–1200 cm−1 were assigned to the vibration of the aromatic amine resonances C–N–C bonds. The peaks between 1200 and 700 cm−1 were attributed to the in-plane bending/out-of-plane wagging vibrations of the aromatic C–H bonds, besides the CCCC torsional motions of the quinoline skeleton. The FTIR absorbance peaks in the spectral range 700–600 cm−1 belonged to the stretching vibration modes of the metal–ligand bonds (Al–N and Al–O).
Alq3 is an optical material well known for its excellent electroluminescence and fluorescence; therefore, we recorded the PL of the Alq3 as rec and Alq3 NP samples. The PL spectra of both samples are shown in Fig. 5; the PL excitation spectra recorded in the spectral range of 250–470 nm (λem = 500 nm) show two peaks: one peak at 380, which is in the UV region, and the other at 419 nm, which is in the visible region (Fig. 5a). These two PL peaks result from the ligands' electronic π–π* transitions.35,36 The PL emission spectra of the samples, in the spectral range of 400–750 nm (λex = 380 nm), are shown in Fig. 5b; the spectra show a broadband peak centered at 495 nm. This peak results from the electronic π–π* transitions in the quinolinolate ligands,35,36 in which the electrons predominantly at the phenoxide ring transit to the pyridyl ring.37 The Alq3 NP sample shows a significantly lower intensity than that of the Alq3 as rec sample. This observation could be due to the higher crystallinity32 in the microrods of the Alq3 as rec (see XRPD results), where the PL originates from Alq3 molecules' effective π–π interactions, which increase with the increase in crystallinity. These results agree with those reported in the published work.32
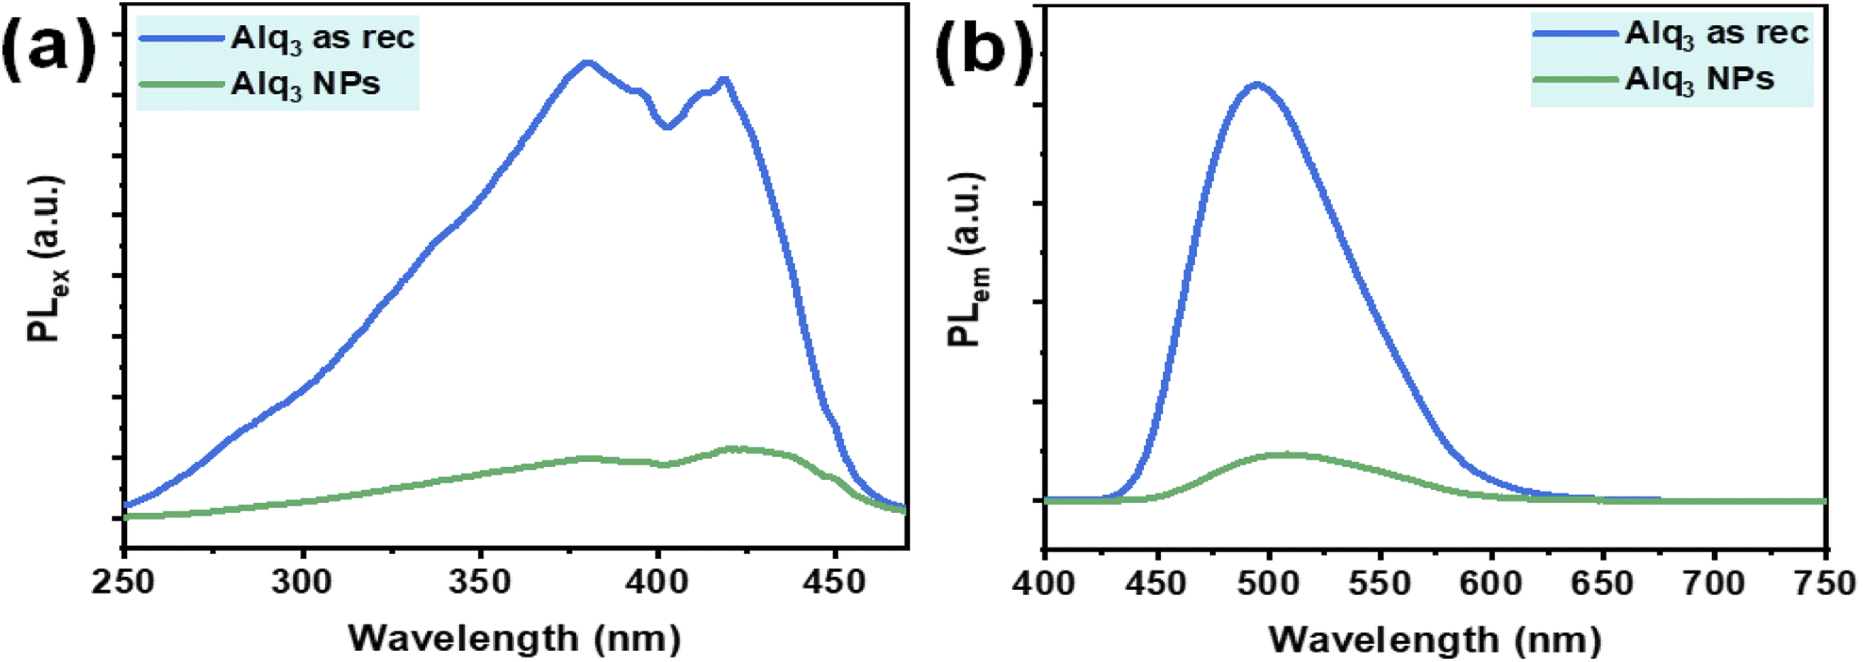 | ||
| Fig. 5 PL spectra of the Alq3 as rec and Alq3 NP samples: (a) excitation spectra (λem = 500 nm) and (b) emission spectra (λex = 380 nm). | ||
3.2. Alq3 antibacterial activity
We prepared Alq3 colloids at concentrations of 120, 240, 360, and 480 μg ml−1. Fig. S1† shows these concentrations for the Alq3 NP sample, where an optical image in visible light (Fig. S1a†) and a fluorescence image under UV irradiation at an excitation wavelength of 385 nm (Fig. S1b†). The fluorescence image shows the expected observation, where the fluorescence shining increased with the concentration of Alq3 NPs as the fluorescence material.We have studied these concentrations on seven different types of human pathogenic bacterial strains (HPBS), gram-positive and gram-negative, and compared them with six types of St. antibiotics. Fig. S2† shows the antibacterial activity performed by the AWD against the bacteria of EC, EF, KP, MRSA, PA, SA, and ST, besides the St. antibiotics. Fig. S2† includes seven rows representing the seven types of HPBS. The first column represents the Alq3 as rec sample antibacterial activity, the second column represents the Alq3 NP sample antibacterial activity, and the third column represents the St. antibiotic antibacterial activity. The bacterial growth inhibition zones for the Alq3 NP sample (Fig. S2,† second column) are larger than those for the Alq3 as rec sample (Fig. S2,† first column). Interestingly, the bacterial growth inhibition zones for the Alq3 NP sample at a concentration of 480 μg ml−1 (Fig. S2,† second column) are larger than those for the St. antibiotics (Fig. S2,† third column) in KP, MRSA, and SA.
To quantitatively evaluate the results of the AWD method, we measured the diameter of the bacterial growth inhibition zones for each concentration of the Alq3 as rec and Alq3 NP samples against each bacterial strain as well as the St. antibiotics. Table 1 summarizes the inhibition zone diameters for Alq3 as rec and Alq3 NP samples at 120, 240, 360, and 480 μg ml−1, besides the St. antibiotics AP 10 μg per disc, AU 30 μg per disc, GM 10 μg per disc, FOX 30 μg per disc, KF 30 μg per disc, and TS 25 μg per disc against the EC, EF, KP, MRSA, PA, SA, and ST. It can be seen that the Alq3 NP sample showed better bacterial activity than the Alq3 as rec sample against most of the seven bacterial strains. Besides, the sample Alq3 NPs showed bacterial activity similar to St. antibiotics. Moreover, they showed even better than the activity of the St. antibiotics tested against bacteria, especially at 360 and 480 μg ml−1. For instance, the Alq3 NPs antibacterial activity at 480 μg ml−1 was the best (inhibition zone diameter ∼27 mm) against KP, followed by GM 10 μg per disc, TS 25 μg per disc (inhibition zone diameter ∼24 mm), and then the Alq3 NPs at a concentration of 360 μg ml−1 (inhibition zone diameter ∼23 mm). The Alq3 NP sample at 240, 360, and 480 μg ml−1 concentrations recorded the best antibacterial activity against the bacterial strain MRSA (inhibition zone diameter ∼22, 27, and 31 mm, respectively) compared with the Alq3 as rec sample and all the St. antibiotics. Against the bacterial strain PA, although the six St. antibiotics showed the best antibacterial activity, the Alq3 NP sample showed good antibacterial activity (inhibition zone diameter ∼18 to 30 mm). The recorded antibacterial activity of the Alq3 NP sample at a concentration of 480 μg ml−1 against the SA and ST (inhibition zone diameter > 27 mm) was better than those recorded with the six St. antibiotics (inhibition zone diameter ∼25 mm). Generally, the antibacterial activity of the Alq3 NP sample showed better results than those of the Alq3 as rec sample; besides, its antibacterial activity was excellent compared with those of the St. antibiotics. A histogram in Fig. S3† represents the data listed in Table 1.
| Tested bacteria | Alq3 | St. antibiotics | ||||||||||||
|---|---|---|---|---|---|---|---|---|---|---|---|---|---|---|
| Alq3 as rec | Alq3 NPs | AP | AU | GM | FOX | KF | TS | |||||||
| 120 μg ml−1 | 240 μg ml−1 | 360 μg ml−1 | 480 μg ml−1 | 120 μg ml−1 | 240 μg ml−1 | 360 μg ml−1 | 480 μg ml−1 | 10 μg per disc | 30 μg per disc | 10 μg per disc | 30 μg per disc | 30 μg per disc | 25 μg per disc | |
| EC | 0 | 0 | 0 | 0 | 0 | 11 ± 3.1 | 15 ± 1.9 | 22 ± 1.5 | 14 ± 2.1 | 16 ± 3.33 | 19 ± .1.9 | 23 ± 2.6 | 12 ± 1.7 | 23 ± 1.1 |
| EF | 0 | 0 | 10 ± 2.9 | 11 ± 1.8 | 11 ± 3.2 | 12 ± 4.0 | 14 ± 2.1 | 15 ± 1.3 | 22 ± 2.1 | 23 ± 1.7 | 17 ± 1.1 | 20 ± 2.9 | 21 ± 3.3 | 25 ± 1.1 |
| KP | 0 | 10 ± 2.0 | 11 ± 3.0 | 12 ± 2.9 | 15 ± 3.0 | 20 ± 2.5 | 23 ± 2.4 | 27 ± 2.1 | 0 | 20 ± 2.1 | 24 ± 0.1 | 21 ± 1.9 | 21 ± 2.1 | 24 ± 1.9 |
| MRSA | 0 | 0 | 0 | 16 ± 0.9 | 19 ± 1.1 | 22 ± 0.9 | 27 ± 0.3 | 31 ± 0.2 | 9 ± 3.9 | 15 ± 0.9 | 21 ± 1.6 | 0 | 7 ± 4.9 | 20 ± 2.9 |
| PA | 12 ± 3.9 | 13 ± 1.1 | 16 ± 2.1 | 16 ± 1.1 | 18 ± 1.0 | 22 ± 0.7 | 26 ± 0.2 | 30 ± 0.8 | >35 | >35 | 25 ± 1.4 | >35 | >35 | >35 |
| SA | 11 ± 4.1 | 12 ± 1.7 | 14 ± 3.9 | 15 ± 1.9 | 18 ± 2.1 | 23 ± 1.3 | 26 ± 0.8 | 30 ± 1.4 | 0 | 21 ± 1.4 | 25 ± 0.7 | 24 ± 0.4 | 24 ± 0.9 | 26 ± 0.9 |
| ST | 0 | 0 | 10 ± 3.5 | 11 ± 1.1 | 15 + 2.5 | 19 + 2.1 | 23 ± 0.9 | 28 ± 1.5 | 25 ± 0.9 | 26 ± 1.4 | 22 ± 1.6 | 25 ± 0.9 | 26 ± 2.1 | 28 ± 0.3 |
We found that the best antibacterial activity recorded via the AWD method is for the Alq3 NP sample, which showed larger inhibition zones than those of the Alq3 as rec sample. The AWD method results indicated that the best results of the antibacterial activity were against MRSA and PA. Fig. S4† presents the optical image and the fluorescence image by photographing the agar plates with wells filled with Alq3 NP sample concentrations and cultured with bacteria of MRSA (Figs. S4a and S4b†) and PA (Figs. S4c and S4d†) under the visible light and UV irradiation (λ = 385 nm). As seen in the optical and fluorescence images, the inhibition zones resulting from the Alq3 NP sample increased with the increase in the concentration of the sample. The fluorescence images clearly show the increase in the fluorescence glow with the increase in the concentration of the sample.
MIC and MBC are among the most important parameters to know to study the antibacterial activity of any material. That is why we used the resazurin assay to identify them. We performed a resazurin assay by serial dilutions for both Alq3 as rec and Alq3 NP samples, besides GM as St. antibiotic. The serial dilutions started at 120 μg ml−1 concentration in 96-well microtiter plates; the resulting serial dilution concentrations are 120, 60, 30, 15, 7.50, 3.75, 1.88, 0.94, 0.47, and 0.23 μg ml−1, diluted in 10 columns of 96-well microtiter plates in addition to the PC and NC in columns 11 and 12. After incubation for 24 hours, the absorbance reading of the 96-well microtiter plates was measured to calculate the IC50, which will be discussed later. Fig. S5† shows the 96-well microtiter plates where the wells were stained pink and blue. The wells that appear pink in color contain active bacteria and indicate that the samples' concentrations were not enough to kill bacteria. In contrast, the wells with blue color in which there was no bacterial activity indicate that the wells included samples' concentrations that reduced the activity of bacteria and killed them. Therefore, the more the number of blue columns, the more the efficiency of the antibacterial activity and the more the material effectiveness at lower concentrations. As shown in Fig. S5,† both the Alq3 as rec and Alq3 NP samples showed antibacterial activity, noting that the Alq3 NP sample showed more antibacterial activity than that of the Alq3 as rec sample. This figure also pointed out that the best antibacterial activity for both samples was against MRSA and PA. This result is consistent with those obtained by the AWD method (Fig. S2†). Besides, as shown in Fig. S5,† the concentrations in the columns colored in blue were considered the concentrations in which MIC and MBC could be. The obtained MIC values are summarized in Table 2. We did not find the MIC for both the Alq3 as rec and Alq3 NP samples against the bacterial strains EC, EF, and ST, while testing all the diluted concentrations, including the concentration of 120 μg ml−1, which means that the values of MIC are higher than 120 μg ml−1 (Table 2). At the same time, the MIC values for GM against EC, EF, and ST were 15, 15, and 3.75, respectively. The values of MIC in units of μg ml−1 for Alq3 as rec, Alq3 NPs, and GM against KP, MRSA, PA, and SA were (60, 30, 3.75), (30, 15, 7.5), (30, 15, 3.75), and (60, 30, 3.75), respectively. It can noticed that the MIC for both the Alq3 as rec and Alq3 NP samples against MRSA and PA recorded the lowest concentrations. These results indicated that antibacterial activities against MRSA and PA for Alq3 nanostructures (MIC ∼15 μg ml−1) were higher than those of the microstructures (MIC ∼30 μg ml−1). At the same time, they showed the lowest antibacterial activities against EC, EF, and ST (MIC > 120 μg ml−1). Besides, by comparing with St. antibiotic GM, the Alq3 nanostructures recorded good values of the antibacterial activity against MRSA and PA (Table 2). The MBC values of both the Alq3 as rec and Alq3 NP samples, besides St. antibiotic against tested, were determined, and are listed in Table 2. We found that the MBC values showed the same tendency as the MIC values.
| Tested bacteria | MIC (μg ml−1) | MBC (μg ml−1) | IC50 (μg ml−1) | ||||||
|---|---|---|---|---|---|---|---|---|---|
| Alq3 as rec | Alq3 NPs | GM | Alq3 as rec | Alq3 NPs | GM | Alq3 as rec | Alq3 NPs | GM | |
| EC | >120 | >120 | 15 | >120 | >120 | 30 | — | — | 5.07 |
| EF | >120 | >120 | 15 | >120 | >120 | 30 | — | — | 6.24 |
| KP | 60 | 30 | 3.75 | 120 | 60 | 7.5 | 34.88 | 21.69 | 1.65 |
| MRSA | 30 | 15 | 7.5 | 60 | 30 | 15 | 9.25 | 3.85 | 1.91 |
| PA | 30 | 15 | 3.75 | 60 | 30 | 7.5 | 9.41 | 3.96 | 1.43 |
| SA | 60 | 30 | 3.75 | 120 | 60 | 7.5 | 19.74 | 7.21 | 1.57 |
| ST | >120 | >120 | 7.5 | >120 | >120 | 15 | 52.15 | 22.91 | 2.48 |
The IC50s of both samples against human pathogenic bacterial strains EC and EF have not been extracted because the fitted curves were not performed, the tested concentrations being lower than that required to produce enough inhibition to achieve the entire fitted curve (Fig. 6a and b). In contrast, the IC50s of the St. antibiotic GM were obtained against all tested human pathogenic bacterial strains (Table 2). The IC50 of the microstructure of the Alq3 as rec sample against human pathogenic bacterial strains KP, MRSA, PA, SA, and ST were 34.88, 9.25, 9.41, 19.74, and 52.15 μg ml−1, respectively. In contrast, for the nanostructures of the Alq3 NP sample, IC50s were 21.69, 3.85, 3.96, 7.21, and 22.91 μg ml−1. At the same time, the IC50s of the microstructure of the Alq3 as rec sample against human pathogenic bacterial strains EC, EF, KP, MRSA, PA, SA, and ST were 5.07, 6.24, 1.65, 1.91, 1.43, 1.57, and 2.48 μg ml−1, respectively (Table 2), where we could obtain the dose–response curves for the St. antibiotic against all tested human pathogenic bacterial strains (Fig. 6).
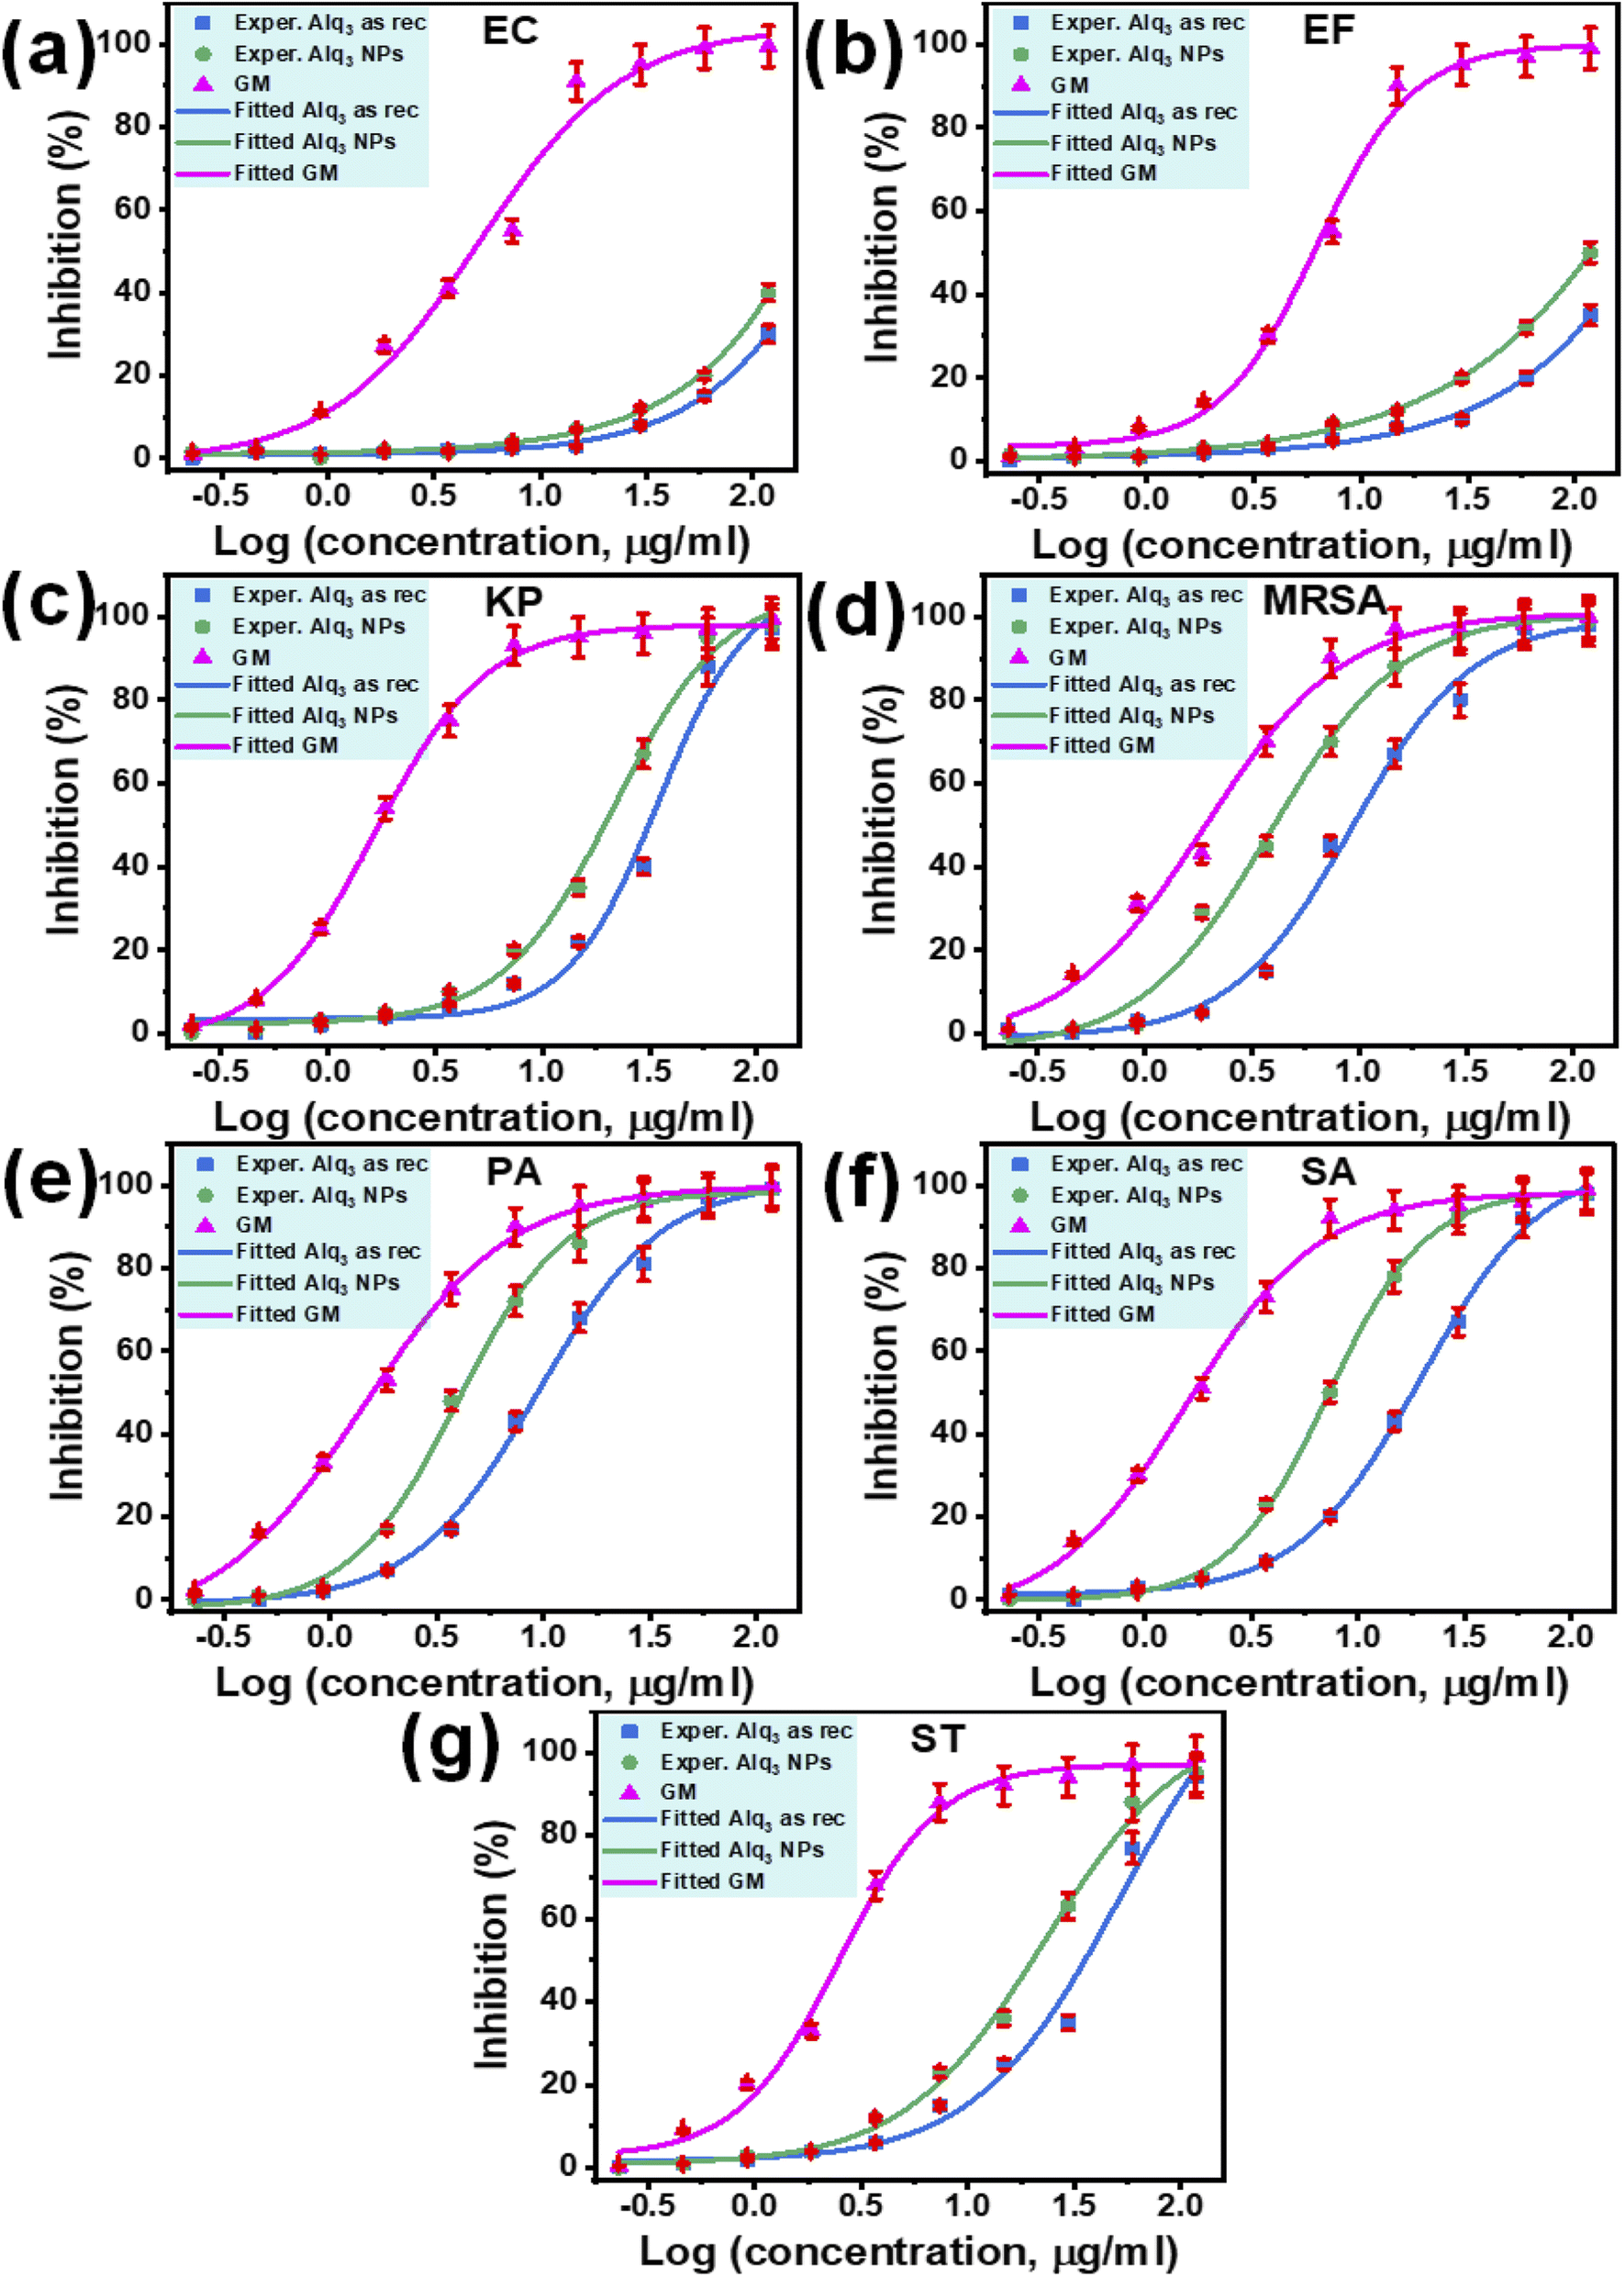 | ||
| Fig. 6 Bacterial growth inhibition experimentally from the Alq3 as rec sample, Alq3 NP sample, and St. antibiotic GM versus common logarithms of the concentrations of 120, 60, 30, 15, 7.5, 3.75, 1.88, 0.94, 0.47, and 0.23 μg ml−1 against (a) EC, (b) EF, (c) KP, (d) MRSA, (e) PA, (f) SA, and (g) ST. The lines are the fitted dose–response curves. | ||
Although the IC50s were not extracted against bacterial strains of EC and EF, the number of blue columns can be used as an indicator to compare the samples of Alq3 as rec and Alq3 NPs. Figs. S5a and S5b† show that the number of blue columns when Alq3 nanostructures were used as the antimicrobial material is higher than that of blue columns when using Alq3 microstructures. These obtained results indicated that the antibacterial activities of Alq3 nanostructures against all tested human pathogenic bacterial strains are more than those of the microstructures.
3.3. Antimicrobial activity mechanism
We found that the Alq3 NP sample showed a higher antibacterial activity than that of the Alq3 as rec sample through the AWD method and resazurin assay results. To explain this result, we put a possible scenario for the interaction of the two tested samples with bacterial strains, as shown in Fig. 7. Here, Fig. 7a and b represent the samples Alq3 as rec and Alq3 NPs, respectively; the Alq3 as rec sample has microstructures, while the Alq3 NP sample has nanostructures. At the same time, Fig. 7c and d represent the coccus and bacillus bacteria, respectively. Fig. 7c depicts coccus strains such as EC, EF, MRSA, and SA, while Fig. 7d represents bacillus bacterial strains such as KP, PA, and ST. When the bacterial strains are incubated with the sample Alq3 as rec, which has a microstructure, the contact area between the sample and the cell walls of the bacteria is less because of the particle sizes of the sample Alq3 as rec in microstructures, which cannot completely cover the cell walls of the bacteria that leads to an area with no contact (Fig. 7e), subsequently reducing the interaction between the sample's particles and the bacteria.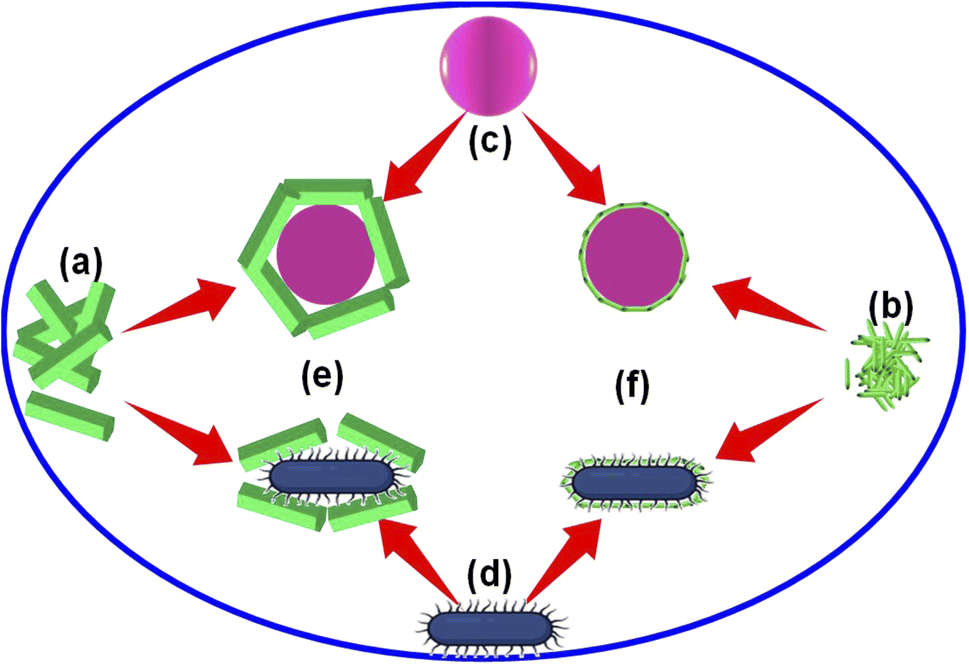 | ||
| Fig. 7 Schematic diagram presenting the antimicrobial activity mechanism of the Alq3 samples: (a) Alq3 as rec, (b) Alq3 NPs, (c) coccus bacteria, (b) bacillus bacteria, (e) cross-section of bacteria surrounded by the microparticles of the sample Alq3 as rec and (f) cross-section of bacteria surrounded by the nanoparticles of the sample Alq3 NPs. | ||
We think that the interaction between particles and bacteria could depend on direct contact, whereas in the case of sample Alq3 NPs, whose particles have nanostructures, they allow for complete connection between them and the bacteria walls (Fig. 7f), leading to an increase in the interaction between the particles of the sample Alq3 NPs and the bacteria, and thus an increase in the efficiency of the antibacterial activity of the Alq3 NP sample. Hence, the surface area of the nanostructures increases as one of the features of the nanostructures, leading to an increase in the efficiency of the nanostructures during interactions. Although the increase in the contact between Alq3 and the bacteria (surface interactions) could interpret why Alq3 nanostructures have more antibacterial activity than the microstructures, this not answer why Alq3 stops the bacteria from growing; in other words, why Alq3 kills the bacteria. The chemical structure of the Alq3 could be the key to answering this question; where Alq3 is an organometallic material, every Alq3 molecule contains three molecules of 8-hydroxyquinoline. Herein, 8-hydroxyquinoline derivatives were reported to treat a microbial infection.38 Moreover, it was reported that 8-hydroxyquinoline rapidly inhibits RNA synthesis.39 Many studies40–42 also demonstrated that its derivatives inhibit the methionine aminopeptidases, which remove the amino-terminal methionine residue from newly synthesized proteins. Accordingly, inhibiting the bacterial RNA synthesis and methionine aminopeptidase by 8-hydroxyquinoline could inhibit the growth of the bacteria and kill them.
To test the hypothesis illustrated in Fig. 7, we carried out an experiment in which three groups of MRSA were grown in the MHB media for 3 h; one group was grown in MHB only; the other two groups were grown in MHB with Alq3 as rec and Alq3 NPs at 20 μg ml−1. Then, 100 μl was placed on the silicon wafer from each group to obtain SEM images. The captured SEM images are shown in Fig. 8, including the SEM images of the powders Alq3 as rec (Fig. 8a) and Alq3 NPs (Fig. 8b). While at two magnifications, Fig. 8c and d show the SEM images of MRSA without the addition of Alq3 samples into their MHB. Fig. 8e and f display the SEM images at two magnifications for MRSA grown in MHB with the Alq3 as rec sample at 20 μg ml; these two images show the contact between MRSA cells and Alq3 in microstructures, where they cannot contact the cell surface completely; this result is in agreement with the hypothesis illustrated in Fig. 7e. While Fig. 8g and h display the SEM images at two magnifications for MRSA grown in MHB with Alq3 NPs at 20 μg ml−1, it can be seen that the nanostructures of Alq3 surrounded the MRSA cells and more point contact between the Alq3 and the cells; this result could confirm the hypothesis in Fig. 7f. It can also be seen that the shapes of the MRSA cells somewhat changed, which could be attributed to the killing of MRSA by Alq3 NPs.
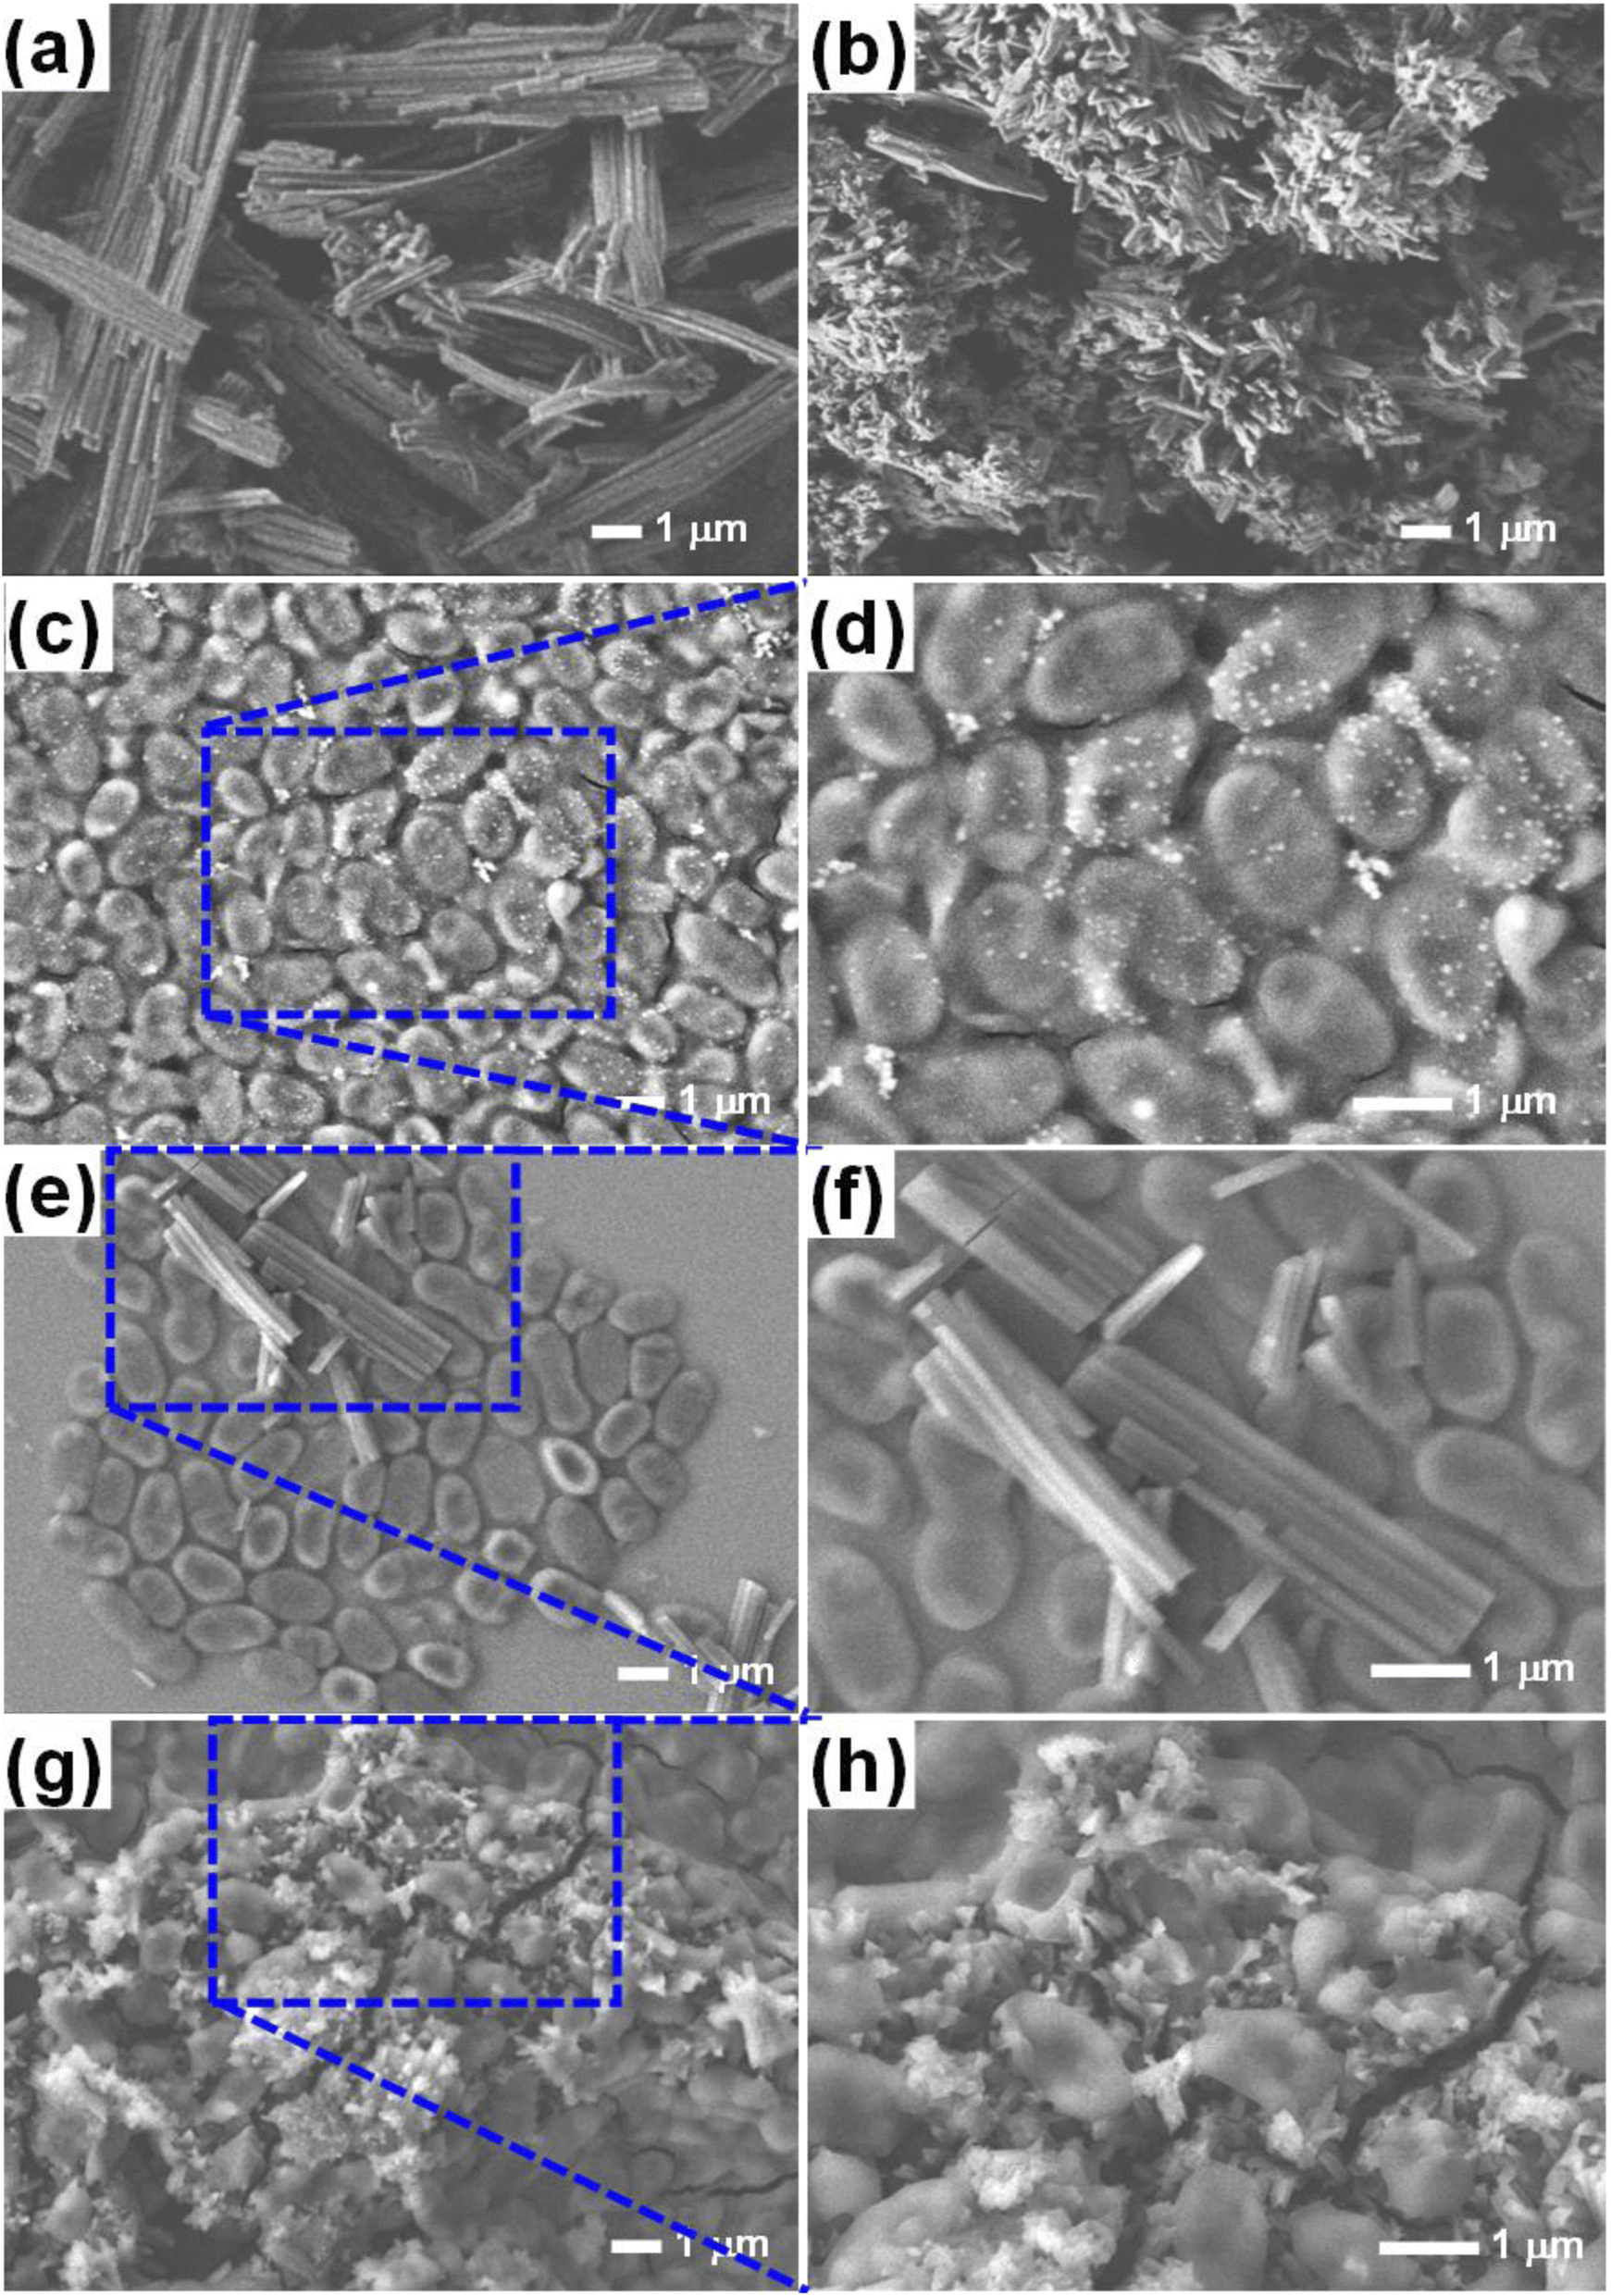 | ||
| Fig. 8 SEM images of (a) Alq3 as rec, (b) Alq3 NP, (c and d) MRSA growth in MHB without treatment with Alq3, (e and f) MRSA growth in MHB including 20 μg ml−1 of Alq3 as rec, and (g and h) MRSA growth in MHB including 20 μg ml−1 of Alq3 NPs. | ||
3.4. PS/Alq3 as an antibacterial coating
The results of the Alq3 as rec and Alq3 NP samples tested against EC, EF, KP, MRSA, PA, SA, and ST showed antibacterial activity, particularly in MRSA and PA strains, which indicates the possible use of Alq3 in new biological applications. In applying these results, we prepared the PS/Alq3 composite, where Alq3 constituted 2% of the content of the entire composite. We tested the PS/Alq3 composite as an antibacterial composite against the strain of bacteria MRSA because this strain of bacteria was the one in which the Alq3 samples showed the best antibacterial activity. The composite was used to coat the 10 ml glass beakers. The MRSA strain was grown in four groups of 10 ml glass beakers: the negative control group (NC), a group coated with a PS polymer only, a group coated with a PS/Alq3 composite, and a group with St. antibiotic GM (5 μg ml−1) as the positive control (see 2.5. subsection). Fig. 9a presents the image of the 10 ml glass beakers coated with a PS polymer and a PS/Alq3 composite under visible light irradiation. At the same time, Fig. 9b shows the fluorescence image under UV irradiation at an excitation wavelength of 385 nm. It can be observed that 10 ml glass beakers coated with a PS/Alq3 composite appear to glow green, which belongs to Alq3. Fig. 9c presents the SEM image of the coated 10 ml glass beaker cross-sections, where the coating thickness is 3 μm. Fig. 9d shows the histogram of the bacterial growth ratio for MRSA incubated for 24 h in the four groups of beakers, where it shows that the bacterial growth ratio in the beakers coated with the PS polymer did not change compared with the control group. In contrast, the percentage of bacteria growth in the beakers coated with a PS/Alq3 composite decreased to 65% compared with the NC group. The percentage of bacteria growth in the PC (5 μg ml−1 of GM) group decreased to 24% compared with that in the NC group. The results indicated that the presence of Alq3 in the PS/Alq3 composite inhibited bacterial activity and could be used as a coating antimicrobial composite.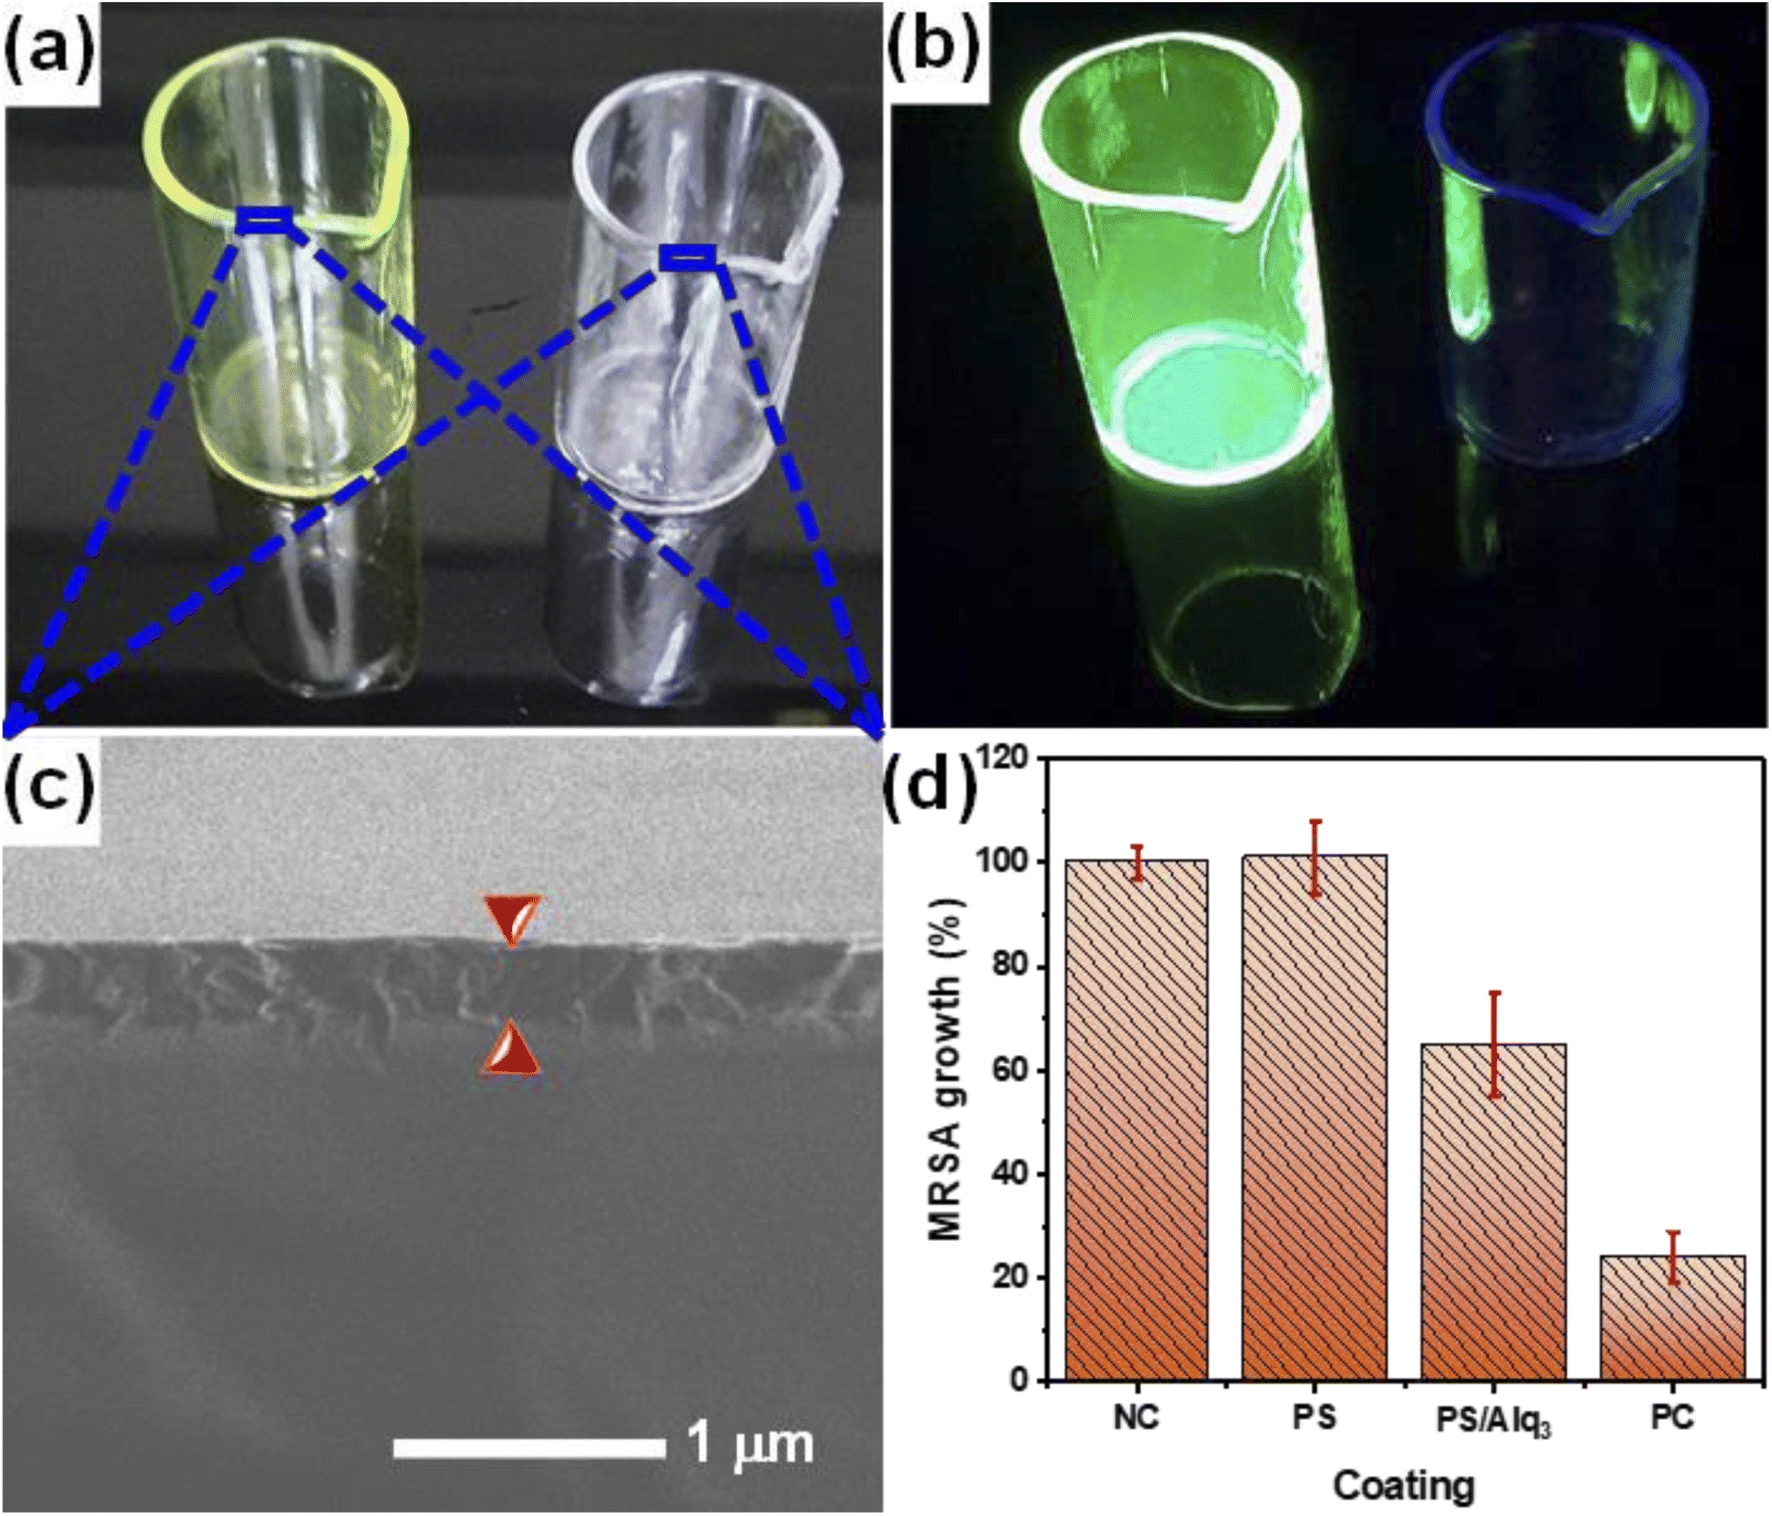 | ||
| Fig. 9 PS/Alq3 as an antibacterial composite: (a) and (b) 10 ml glass beaker coated with a PS polymer and a PS/Alq3 composite under visible light and UV irradiation (λ = 385 nm), respectively; (c) SEM image of the cross-sections of the coated beakers; and (d) histogram demonstrating the MRSA growth ratio after incubation for 24 h in the NC, PS, PS/Alq3 (2% Alq3), and PC (5 μg ml−1) group beakers. | ||
4. Conclusion
The antibacterial activity of Alq3 has been extensively studied in its micro and nanostructures, where it was tested against seven different types of HPBS and compared with six kinds of standard antibiotics. The results indicated that the Alq3 as the rec sample in microrod shapes and nanostructures in rice-like shapes that assembled into flower shapes have inhibition properties against bacterial growth. However, the nanostructures with a new morphology revealed more activity against the bacterial growth than the microstructures, even revealing an activity similar to the standard antibacterial activity. To apply these results, Alq3 was added to PS to form an antimicrobial composite coating, which showed a reduction in bacterial growth to 65% in the glass beakers coated with this fabricated composite. From the results of this study, we can conclude that Alq3 can be used as a promising antimicrobial material; it can also be added to polymers to form composites as an antimicrobial coating.Conflicts of interest
There are no conflicts of interest to declare.Abbreviations
| Alq3 | Tris(8-hydroxyquinoline)aluminum |
| AP | Ampicillin |
| AU | Augmentin |
| AWD | Agar well diffusion |
| CFU | Colony-forming units |
| EC | Escherichia coli ATCC 11775 |
| EF | Enterococcus faecalis ATCC 29212 |
| fac | Facial isomer |
| FOX | Cefoxitin |
| FTIR | Fourier transform infrared |
| GM | Gentamicin |
| HCT116 | Human colon cancer cell lines |
| HFF-1 | Human foreskin fibroblasts cell line |
| HPBS | Human pathogenic bacterial strains |
| IC50 | Half-maximal inhibitory concentration |
| KF | Cephalothin |
| KP | Klebsiella pneumoniae ATCC 13883 |
| MBC | Minimum bactericidal concentration |
| MCF7 | Human breast cancer cell line |
| mer | Meridional isomer |
| MHA | Mueller-Hinton agar |
| MHB | Mueller-Hinton broth |
| MIC | M inimal inhibitory concentration |
| MRSA | Methicillin-resistant Staphylococcus aureus ATCC 33591 |
| NC | Negative control |
| OLED | Organic light-emitting diode |
| PA | Pseudomonas aeruginosa ATCC 9027 |
| PBS | Phosphate-buffered saline |
| PC | Positive control |
| PL | Photoluminescence |
| PS | Polystyrene |
| SA | Staphylococcus aureus ATCC 12600 |
| SD | Standard deviation |
| SEM | Scanning electron microscopy |
| ST | Salmonella Typhimurium ATCC 14028 |
| St. antibiotics | Standard antibiotics |
| TS | Cotrimoxazole |
| UV | Ultraviolet |
| XRPD | X-ray powder diffraction |
References
- A. Saeed, A. Alshahrie and N. Salah, J. Mater. Sci.: Mater. Electron., 2020, 31, 22179–22189 CrossRef CAS.
- N. Salah, A. S. Alshahrie and A. Saeed, US Pat., US11289664B1, 2022 Search PubMed.
- M. Cölle and W. Brütting, Phys. Status Solidi A-Appl. Res., 2004, 201, 1095–1115 CrossRef.
- A. Saeed, M. S. Al-Buriahi, M. A. N. Razvi, N. Salah and F. E. Al-Hazmi, J. Mater. Sci.: Mater. Electron., 2021, 32, 2075–2087 CrossRef CAS.
- A. Saeed, M. A. N. Razvi and N. Salah, Results Phys., 2021, 24, 104162 CrossRef.
- S. Abdullahi, A. Aydarous and N. Salah, J. Lumin., 2022, 242, 118588 CrossRef CAS.
- S. Abdullahi, A. Aydarous, A. Saeed and N. Salah, Opt. Mater., 2022, 128, 112402 CrossRef CAS.
- S. H. Back, J. H. Park, C. Cui and D. J. Ahn, Nat. Commun., 2016, 7, 10234 CrossRef CAS PubMed.
- A. Saeed, N. Salah, A. Alshahrie, N. Baghdadi, K. Gauthaman and A. Memic, Mater. Chem. Phys., 2021, 259, 124080 CrossRef CAS.
- A. Saeed, M. A. Razvi, A. Y. Madkhli, S. Abdullahi, F. Aljoud, T. A. Zughaibi, S. F. Aboushoushah, A. Alshahrie, A. Memic, F. E. Al-Hazmi and N. Salah, Opt. Mater., 2022, 127, 112260 CrossRef CAS.
- M. Maruthupandy and J. Seo, Mater. Sci. Eng. C, 2019, 105, 110016 CrossRef CAS PubMed.
- E. E. Mann, D. Manna, M. R. Mettetal, R. M. May, E. M. Dannemiller, K. K. Chung, A. B. Brennan and S. T. Reddy, Antimicrob. Resist. Infect. Control, 2014, 3, 28 CrossRef PubMed.
- V. Russotto, A. Cortegiani, S. M. Raineri and A. Giarratano, J. Intensive Care, 2015, 3, 54 CrossRef PubMed.
- X. Lei, J. Wang, J. Chen, J. Gao, J. Zhang, Q. Zhao, J. Tang, W. Fang, J. Li, Y. Li and Y. Zuo, J. Mat. Chem. B, 2021, 9, 1370–1383 RSC.
- X. Nie, F. Gao, F. Wang, C. Liu and Y.-Z. You, J. Mat. Chem. B, 2021, 9, 4006–4014 RSC.
- A. u. R. Khan, K. Huang, Z. Jinzhong, T. Zhu, Y. Morsi, A. Aldalbahi, M. El-Newehy, X. Yan and X. Mo, J. Mat. Chem. B, 2021, 9, 1452–1465 RSC.
- Q. Sun, M. Duan, W. Fan and B. Fan, J. Mat. Chem. B, 2021, 9, 2200–2211 RSC.
- C. Yin, Z. Wang, X. Ding, X. Chen, J. Wang, E. Yang, W. Wang, L. L. Martin and D. Sun, J. Mat. Chem. B, 2021, 9, 3808–3825 RSC.
- F. A. Qais, I. Ahmad, M. Altaf, S. Manoharadas, B. F. Al-Rayes, M. S. Ali Abuhasil and Y. A. Almaroai, RSC Adv., 2021, 11, 13700–13710 RSC.
- M. Altaf, M. T. Zeyad, M. A. Hashmi, S. Manoharadas, S. A. Hussain, M. S. Ali Abuhasil and M. A. M. Almuzaini, RSC Adv., 2021, 11, 19248–19257 RSC.
- S. Manoharadas, M. Altaf, A. F. Alrefaei, R. M. Devasia, A. Y. M. Badjah Hadj and M. S. A. Abuhasil, RSC Adv., 2021, 11, 1420–1429 RSC.
- P. Singh, K. R. B. Singh, J. Singh, S. N. Das and R. P. Singh, RSC Adv., 2021, 11, 18050–18060 RSC.
- P. Singh, K. R. B. Singh, J. Singh, P. Prasad and R. P. Singh, RSC Adv., 2021, 11, 25752–25763 RSC.
- S. M. Abdellatif Soliman, M. F. Sanad and A. E. Shalan, RSC Adv., 2021, 11, 11541–11548 RSC.
- R. Eivazzadeh-Keihan, H. A. Moghim Aliabadi, F. Radinekiyan, M. Sobhani, k. Farzane, A. Maleki, H. Madanchi, M. Mahdavi and A. E. Shalan, RSC Adv., 2021, 11, 17914–17923 RSC.
- K. Almashhori, T. T. Ali, A. Saeed, R. Alwafi, M. Aly and F. E. Al-Hazmi, New J. Chem., 2020, 44, 562–570 RSC.
- S. Tabassum, T. H. Suresha Kumara, J. P. Jasinski, S. P. Millikan, H. S. Yathirajan, P. S. Sujan Ganapathy, H. B. V. Sowmya, S. S. More, G. Nagendrappa, M. Kaur and G. Jose, J. Mol. Struct., 2014, 1070, 10–20 CrossRef CAS.
- M. Elshikh, S. Ahmed, S. Funston, P. Dunlop, M. McGaw, R. Marchant and I. M. Banat, Biotechnol. Lett., 2016, 38, 1015–1019 CrossRef CAS PubMed.
- M. Rautenbach, G. D. Gerstner, N. M. Vlok, J. Kulenkampff and H. V. Westerhoff, Anal. Biochem., 2006, 350, 81–90 CrossRef CAS PubMed.
- W. Xie, J. Fan, H. Song, F. Jiang, H. Yuan, Z. Wei, Z. Ji, Z. Pang and S. Han, Physica E, 2016, 84, 519–523 CrossRef CAS.
- M. Cölle, J. Gmeiner, W. Milius, H. Hillebrecht and W. Brütting, Adv. Funct. Mater., 2003, 13, 108–112 CrossRef.
- S. Kim, D. H. Kim, J. Choi, H. Lee, S.-Y. Kim, J. W. Park and D. H. Park, Materials, 2018, 11, 472 CrossRef.
- I. C. Radu, S. Polosan, I. Enculescu and H. Iovu, Opt. Mater., 2012, 35, 268–273 CrossRef CAS.
- S.-Y. Hung, R.-L. Kao, K.-Y. Lin, C.-C. Yang, K.-S. Lin, Y.-C. Chao, J.-S. Wang, J.-L. Shen and K.-C. Chiu, Mater. Chem. Phys., 2015, 154, 100–106 CrossRef CAS.
- H. Jianbo, Z. Tingting, C. Yongjing, Z. Yuanyuan, Y. Weiqing and M. Menglin, J. Fluoresc., 2018, 28, 1121–1126 CrossRef CAS.
- R. Ballardini, G. Varani, M. T. Indelli and F. Scandola, lnorg. Chem., 1986, 25, 3858–3865 CrossRef CAS.
- H. D. Burrows, M. Fernandes, J. Seixas de Melo, A. P. Monkman and S. Navaratnam, JACS, 2003, 125, 15310–15311 CrossRef CAS PubMed.
- A. R. Joaquim, M. P. Gionbelli, G. Gosmann, A. M. Fuentefria, M. S. Lopes and S. Fernandes de Andrade, J. Med. Chem., 2021, 64, 16349–16379 CrossRef CAS PubMed.
- R. S. Fraser and J. Creanor, Biochem. J., 1975, 147, 401–410 CrossRef CAS.
- O. Olaleye, T. R. Raghunand, S. Bhat, C. Chong, P. Gu, J. Zhou, Y. Zhang, W. R. Bishai and J. O. Liu, Tuberculosis, 2011, 91, S61–S65 CrossRef CAS PubMed.
- M. Paolino, M. Brindisi, A. Vallone, S. Butini, G. Campiani, C. Nannicini, G. Giuliani, M. Anzini, S. Lamponi, G. Giorgi, D. Sbardella, D. M. Ferraris, S. Marini, M. Coletta, I. Palucci, M. Minerva, G. Delogu, I. Pepponi, D. Goletti, A. Cappelli, S. Gemma and S. Brogi, ChemMedChem, 2018, 13, 422–430 CrossRef CAS PubMed.
- P. Wangtrakuldee, M. S. Byrd, C. G. Campos, M. W. Henderson, Z. Zhang, M. Clare, A. Masoudi, P. J. Myler, J. R. Horn, P. A. Cotter and T. J. Hagen, ACS Med. Chem. Lett., 2013, 4, 699–703 CrossRef CAS PubMed.
Footnote |
| † Electronic supplementary information (ESI) available. See https://doi.org/10.1039/d2ra04750k |
| This journal is © The Royal Society of Chemistry 2022 |