 Open Access Article
Multi-scale hybrid spherical graphite composites: a light weight thermal interface material with high thermal conductivity and simple processing technology†
Dingbang Yana,
Zexian Lib,
Nizao Konga,
Min Huanga,
Yexin Tiana,
Chong Yeac,
Liqin Fua,
Bingjie Wena,
Jinshui Liua,
Ruixuan Tan*a and
Fei Han *a
*a
aHunan Province Key Laboratory for Advanced Carbon Materials and Applied Technology, College of Materials Science and Engineering, Hunan University, Changsha 410082, P. R. China
bSchool of Mathematics, Hunan University, Changsha 410082, P. R. China
cHunan Province Engineering Research Center for High Performance Pitch-based Carbon Materials, Hunan Toyi Carbon Material Technology Co., Ltd, Changsha 410000, P. R. China
First published on 13th October 2022
Abstract
In consideration of low density and high intrinsic thermal conductivity, spherical graphite powders can act as promising fillers for light weight thermal interface materials. Herein, spherical artificial graphite derived composites exhibit a similar thermal conductivity and significantly reduced bulk density compared with traditional Al2O3-derived composites. Further, based on the particle packing theory, an innovatively optimized calculation method has been proposed by introducing the quadratic programming method into the traditional calculation method to acquire the optimum formulation of multi-scale spherical graphite particles. The thermal conductivity of the optimum formulation-derived composites attains 1.994 W m−1 K−1, which is 1.72 times higher than that of the single particle size-derived composites (1.156 W m−1 K−1), accompanied by a low density of 1.812 g cm−3 vs. the 2.31 g cm−3 of the traditional Al2O3-derived composites. Besides, the relationships between the tap density of the graphite powders, thermal conductivity and maximum filling content of the composites are creatively established, which are available for predicting the thermal conductivities of composites by simply testing the tap density of the fillers. This present work provides an instructional strategy to optimize spherical filler particles for thermal management of electronic devices.
1 Introduction
With electronics technology developing rapidly, extraordinarily the arrival of 5G, the calorific value and heat flux density of electronic components has increased sharply.1–3 A large amount of heat generated by these electronic components must be released in time, or else the heat will seriously interfere with the operation of the electronic components and even damage the electronics.4 Consequently, heat dissipation becomes crucial.5–8 Because the interfaces of electronics and radiators are generally incompletely flat with vast gaps, it is difficult to dissipate the heat efficiently if only depending on a direct contact between the electronics and the radiators.9 These gaps are filled with air with poor thermal conductivity (0.0267 W m−1 K−1), which severely impedes the heat dissipation of the electronic components. The air-gaps between electronics and radiators can be eliminated by introducing thermal interface materials (TIMs) with excellent thermal conductivities, which greatly accelerates the removal of heat.10–13 Most TIMs are based on polymeric materials such as silicone rubber14 and epoxy resin,15 but the thermally conductive performance of pure polymers is incredibly inferior, generally <0.3 W m−1 K−1. Hence, high thermal conducting fillers as heat transfer media are generally added to the pure polymers to improve their heat conduction capacity.16–18For high thermal conductivity fillers, the commonest morphologies are spherical,19 fibrous20–22 and flaky.23 Among these three types of fillers, fibrous and flaky fillers can form well thermal conduction paths at low filling content. But they were difficult to achieve high filling content, leading to the limited thermal conductivity. Furthermore, fibrous fillers are characteristic high aspect ratios fillers. In order to attain excellent thermal conductivities, the filler is necessary to realize orientational arrangement in polymer matrix,24,25 which makes the processing technology of TIMs more complicated. For spherical fillers, although it has no advantage in low filling content, it can form more thermal conductive chains through high filling content, thus realizing fast heat transfer and dissipation.26,27 In addition, the processing technology of preparing TIMs with spherical fillers is simple. Therefore, spherical fillers are the most widely used fillers in industrial production. Spherical Al2O3 particles have high thermal conductivity and low price, which are the most widely used spherical fillers. However, Al2O3 particles have a high density of about 3.9 g cm−3, resulting in the heavy mass of the prepared composites, which makes the TIMs prepared with Al2O3 particles as fillers unsuitable in some occasions requiring low density.28,29 Thus, searching for a type of thermal conductive filler with excellent thermal conductivities and low densities have been highly concerned by material scientists. At this time, carbon allotrope fillers30 show the great potential as thermal conductive fillers, such as spherical graphite. Spherical graphite has the advantages of excellent thermal conductivities (>300 W m−1 K−1) and low density (<2.25 g cm−3).31,32 More importantly, the good spherical morphology is beneficial to realize the high filling content in a simply processing technology. Therefore, the spherical graphite will show great application potential as a promising thermal conductive filler in the field of TIMs.
In this study, spherical artificial graphite is acted as thermal conductive fillers and add into silicone rubber matrix to prepare composites. Firstly, the surface morphology, crystal phase structures, particle size distributions and tap densities of three kinds of spherical graphite are characterized. The thermal conductivity and density of spherical graphite-derived composites with different filling contents are systematically studied and compared with Al2O3-derived composites. Then, in order to maximize the advantages of spherical graphite, three kinds of spherical graphite with different particle sizes are mixed. Based on the particle packing theory,33–35 the traditional calculation method is innovatively optimized by introducing the quadratic programming method, and the optimum formulation of multi-scale spherical graphite particles has been successfully obtained through the optimized calculation method. Afterwards, the tap density and maximum filling content of different formulations, the density and thermal conductivity of composites under the maximum filling content are systematically examined. Besides, the relationships between the tap density, maximum filling content and thermal conductivity of different mixing systems are investigated in detail. Using this correlation law, the thermal conductivity of different composite systems under the maximum filling content can be predicted by simply testing the tap density of fillers, thus simplifying the selection of spherical filler formulation. In short, this work prepares a kind of thermal conductive composite with excellent thermal conductivities and low densities by using multi-scale spherical graphite particles as filler, which provides a guiding scheme for the selection of fillers in TIMs.
2 Experimental section
2.1 Raw materials
Three spherical artificial graphite powders with particle sizes of 3, 13 and 31 μm (which were named G-3, G-13, G-31) were prepared by the graphitization of homemade meso-carbon microbeads from the mesophase pitch as a precursor in Hunan University. Vinyl terminated polydimethylsiloxane, polymethylhydrosiloxane, acetylene cyclohexanol and platinum complexing agent were provided by Jiangxi Bluestar Xinghuo Silicones Co. Ltd.2.2 Preparation of thermal conductive composites
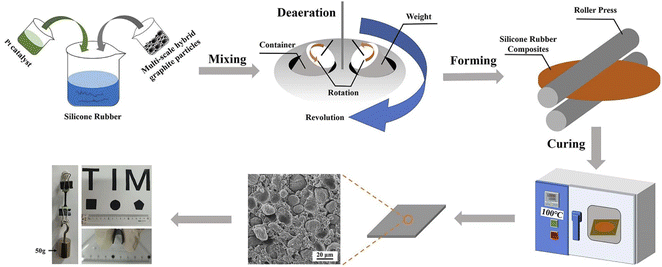
Firstly, three spherical graphite powders with different particle sizes were placed into a V-type mixer in proportion (The total mass of the three graphite powders was 1000 g), and mixed for 30 min to obtain the homogeneous multi-scale hybrid fillers, named as formulation No. 1 to No. 10. Then, the silicone rubber basal body were prepared by mixing the following components: vinyl silicone oil (100.0 g), hydrogen containing silicone oil (6.0 g) and acetylene cyclohexanol (0.2 g) were successively added to a planetary vacuum mixer, and stirred for 20 min to obtain uniform silicone rubber matrix. Afterwards, as shown in Fig. 1, 3.0 g of platinum complexing agent and multi-scale hybrid graphite particles were successively added into the uniform silicone-rubber basal body in the vacuum mixer. The mixtures were poured into two release films, and then placed it into the double-roll machine to rolling for 3 times repeatedly. The thickness of the thermal conductive pads was determined by the roll distance, the roll distance was 1.0 mm in this work. Finally, the obtained sample was heat-treated in a drying box at 100 °C for 0.5 h under vacuum condition to solidify the sample. After the consolidation process, tore off the release film on the surface of the sample, the spherical graphite/silicone rubber composites were obtained.2.3 Characterizations
Scanning electron microscope (Tescan Mira 3) was used to observe the surface morphology of three graphite fillers. Particle size distribution of three graphite powders were revealed by a particle size distribution apparatus (Mastersizer 3000, Malvern). X-ray diffractometer (Panalytical, Empyrean) was used to analysis the phase composition and structures with the scanning rate of 2° min−1.Among them, the graphitization degree g was calculated by Mering and Maire formula based on Franklin model, and the simplified form was
 | (1) |
3 Results and discussion
Using three kinds of spherical graphite powders as raw materials, and mixing them in different proportion (seen in 3.3), 10 kinds of multi-scale hybrid fillers were obtained, named as formulation No. 1 to No. 10. Then, as shown in Fig. 1, the multi-scale hybrid fillers were mixed with silicone rubber matrix and Pt catalyzer, after forming and curing, 10 kinds of spherical graphite/silicone rubber composites were obtained, named as No. 1 to No. 10 composites.3.1 Characterization of three spherical graphite powders
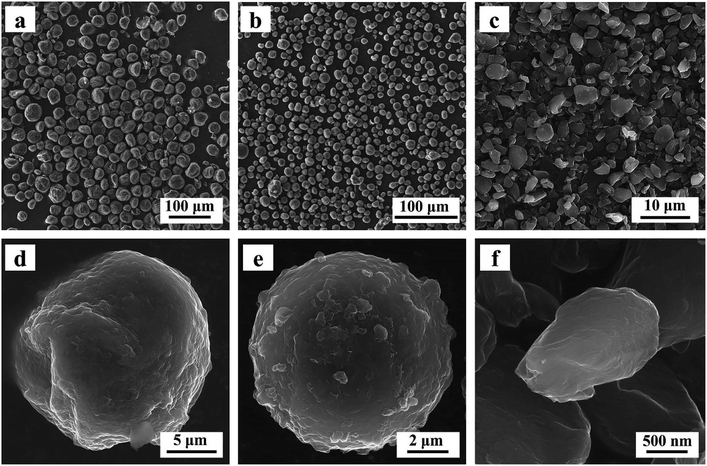
The shape and the size of fillers show significant effects on thermal conductivities of composite.37,38 Firstly, the shape and size of three kinds of spherical graphite were observed by scanning electron microscopy. As shown in Fig. 2, the particle sizes of three spherical graphite powders are quite different. Two graphite powders with larger particle size (G-31 and G-13) are almost spherical, and the average particle size is 31 μm and 13 μm, separately. The graphite powders with smallest particle size (G-3) have poor sphericity with an average grain diameter of approximately 3 μm.The crystal phase structure of three spherical graphite powders was tested by laser Raman spectrometer and wide-angle X-ray diffractometer. As seen in Fig. 3a, there are two principal peaks around 1350 and 1580 cm−1 in three spherical graphite samples, corresponding to the D peak and G peak of graphite, separately. The intensity ratio of D peak to G peak (ID/IG) of three samples are calculated, to be 0.067 for G-31, 0.070 for G-13 and 0.142 for G-3. Abundant studies have shown that, for carbon materials, the smaller value of ID/IG means the better the graphitization degree. The result of ID/IG shows that the graphitization degree of G-31 and G-13 is higher than G-3. In the XRD patterns of spherical graphite (Fig. 3b), the diffraction peaks at 2θ = 26.4°, 42.3°, 44.4°, 54.6° and 77.3° can be indexed to the standard graphite phase (JCPDS: 41-1487). No other peaks can be observed, indicating the high purity of the spherical graphite samples. Meanwhile, the characteristic peak intensity of G-31 and G-13 samples are significantly higher than G-3 samples. Through the calculation of eqn (1), the three spherical graphite samples had high graphitization degree, to be 86.51% for G-31, 86.36% for G-13 and 83.03% for G-3. This is in well agreement with the result of Raman spectroscopy. As a result, the three spherical graphite samples have high graphitization degrees, exhibiting great application potential as heat transfer mediums.
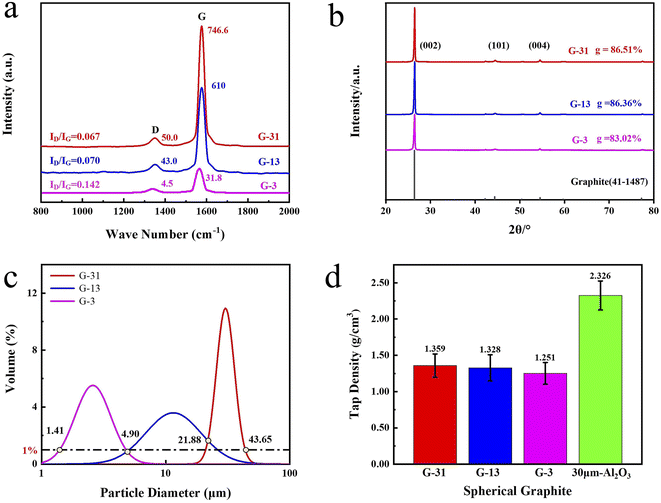 | ||
| Fig. 3 Three kinds of spherical graphite: (a) Raman spectra, (b) wide-angle XRD patterns, (c) particle size distribution curves, (d) tap density. | ||
The particle diameter distribution curves (shown in Fig. 3c) of three spherical graphite powders were further tested by a particle diameter distribution apparatus. The particle diameter distribution of three graphite powders is lognormal distribution. Table 1 exhibits the Dv(50) of spherical graphite particles, to be 30.34 μm for G-31, 11.56 μm for G-13 and 2.58 μm for G-3, respectively. These are consistent to the particle diameter results revealed by SEM. Fig. 3d exhibits the tap density of three kinds of spherical graphite. Fig. 3d exhibits the tap density of G-31, G-13, G-3 and 30 μm Al2O3, which are 1.359, 1.328, 1.251 and 2.326 g cm−3, respectively. The low tap density of spherical graphite shows great potential in the field of lightweight TIMs.
| G-31 | G-13 | G-3 | |
|---|---|---|---|
| Dv(10) (μm) | 24.5 ± 0.07 | 6.00 ± 0.08 | 1.68 ± 0.07 |
| Dv(50) (μm) | 30.34 ± 0.07 | 11.56 ± 0.06 | 2.58 ± 0.05 |
| Dv(90) (μm) | 37.65 ± 0.06 | 22.28 ± 0.08 | 4.04 ± 0.06 |
3.2 The thermal conductivity and density of G-31 composites
In order to further reveal the low density and excellent thermal conductivity of spherical graphite, G-31 and silicone rubber were mixed into composites. Fig. 4a exhibits the thermal conductivities and densities of G-31 derived composites under different filling contents. The thermal conductivities of G-31 derived composites are only 0.155 W m−1 K−1 at the filling content of only 50 phr (“phr” means parts per hundreds of rubbers (by mass). For example, “50 phr” means add 50 parts of fillers to 100 parts of rubbers (by mass)), which do not show significant improvement compared with pure silicone rubber (0.150 W m−1 K−1). This is because the filler particles are surrounded by the matrix in the form of isolated islands at the low filling content, so that the filler particles cannot contact and form continual thermal conductive chains. Also, the thermal conductivity of G-31 derived composites raises linearly as the raise of filling contents. The G-31 derived composite under the maximum filling content of 430 phr exhibits excellent thermal conductivities of 1.156 W m−1 K−1, which is 7.7 times higher than pure silicone rubber. Additionally, the density of G-31 derived composite increases nonlinearly with the raise of the filling contents. The density of G-31 derived composites is only 1.616 g cm−3 under the maximum filling contents.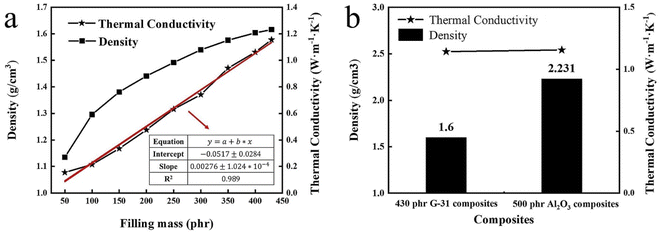 | ||
| Fig. 4 (a) The density and thermal conductivity of G-31 filled composite under different filling contents, (b) the density relationships of the two composites under the same thermal conductivity. | ||
To prove that spherical graphite composites are potential TIMs with high thermal conductivity and low density, the traditional Al2O3 derived composites are prepared for comparison. Fig. S1† shows the density and thermal conductivity of Al2O3 filled composite under different filling contents. The variation trends of densities and thermal conductivities of Al2O3 derived composites with the filling contents are similar to that of G-31 derived composites. The thermal conductivities of the spherical Al2O3 derived composite are 1.802 W m−1 K−1 under the maximum filling content of 730 phr, the higher thermal conductivity is primarily ascribed to the higher filling content of Al2O3 filler. However, the density of the Al2O3 derived composite is high to 2.536 g cm−3, which is significantly higher than G-31 derived composite. In order to intuitively reflect the low density of spherical graphite filled composites, the density relationships of the two composites under the same thermal conductivity were presented in Fig. 4b. When the thermal conductivity is stationary to be 1.14 W m−1 K−1, the density of the G-31 derived composite is only 1.616 g cm−3, which is 0.64 times that of the Al2O3 derived composite with 2.333 g cm−3. All above results indicated that spherical graphite is a kind of very potential thermal conductive fillers in the field of lightweight TIMs.
3.3 Calculation of multi-scale hybrid formulations
For spherical fillers, mixing of multi-scale particles are the simplest and favorite method to further increase the thermal conductivity of TIMs.39,40 Particle packing theory, which firstly proposed by Andreasen41 in 1929 and modified by Dinger and Funk,42 has been widely applied to increase the comprehensive properties of ceramics, concrete and other materials. Lin Mao et al.43 first used the particle packing theory to solve particle diameter matching problems of multiscale particle in TIMs. Before that, there is almost no theoretical direction for particle diameter matching problems of thermal conductive filler. They introduced a method of using particle packing theory to obtain the best proportion of fillers with different particle diameters detailly, and explained specific calculation process. However, the overlapping part between fillers with different particle diameters are ignored in the calculation process of the above article (named calculation method No. 1), this inspires us to further improve and perfect the calculation process.
 | (2) |
 | (3) |
In this work, three kinds of spherical graphite with completely different particle diameter distribution (G-3, G-13, and G-31) are used for multiscale mixing. Based on particle packing theory, this paper introduced two different calculation methods to calculate the percentage ratio of three spherical graphite powders.
| DP/μm | U(DP)/% |
|---|---|
| 43.65 | 100 |
| 21.88 | 68.65 |
| 4.90 | 22.86 |
| 1.41 | 0 |
However, in the above algorithm No. 1, the abscissa of the truncation points is approximately regarded as the maximum and minimum values of the corresponding powder particle size. If the variance of the three particle size distribution curves varies greatly or the truncated positions are close to the center of particle diameter distribution curve, the computational results of powder percentage will be very different from the optimum proportion based on the closest packing model.
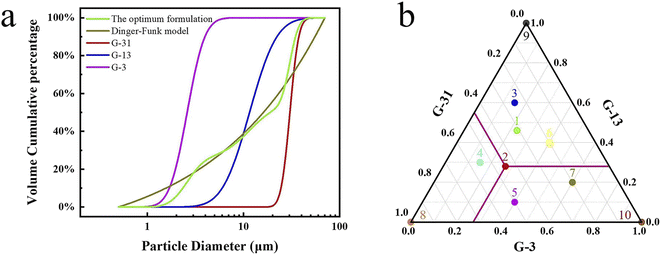 | ||
| Fig. 5 (a) Diagram of calculation method No. 2, (b) the percentage ratio of G-3, G-13 and G-31 in different formulations. | ||
To further demonstrate the advantages of calculation method No. 2 for the mixing of multi-scale spherical particles. Some other formulations No. 3 to No. 10 have been designed to compare with No. 1 and No. 2. The design idea of No. 3 to No. 10 is shown in a ternary phase diagram (Fig. 5b). No. 3 to No. 7 represent multi-scale hybrid particles, whose percentage ratio of G-3, G-13, and G-31 are randomly selected. No. 8 to No. 10 are on behalf of single sized particles. Table S1† gives the specific percentage ratio of different formulations.
3.4 Thermal conductivity of multi-scale hybrid filling composites
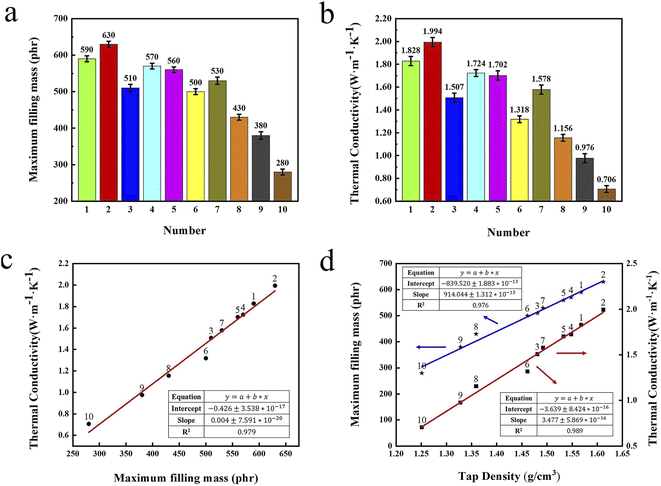
Numerous studies have proven that the thermal conductivity of composite raises linearly as the raise of filling contents for a specific spherical filler.44 Firstly, the maximum filling content of the 10 set formulations in the silicone gel matrix are explored. Meanwhile, the graphite/silicone rubber composites with the maximum filling content are prepared and named as No. 1 to No. 10 composites.Fig. 6a exhibits the maximum filling contents of 10 set formulations in composites. The composite from the formulation No. 2 has the largest value of the maximum filling content of 630 phr, which higher than that from formulation No. 1 with 590 phr and formulation No. 9 with 280 phr. Tap density tester was used to probe the tap density of the mixed graphite powders from the 10 set formulations and the results were presented in Fig. S2.† The tap density of the mixed graphite powders from formulation No. 2 is highest among these mixed powders. Moreover, the maximum filling contents and tap densities from the formulations with multi-scale hybrid particles (No. 1 to No. 7) are higher than those from single sized particles (No. 8 to No. 10). This is because that the small particle in the multi-scale hybrid systems can fill into gaps between big particle, significantly decreasing void volume of the systems.
Fig. 6b shows the thermal conductivities of No. 1 to No. 10 composites at 30 °C. The thermal conductivities of No. 2 composite are 1.994 W m−1 K−1, which is largest in all composites. Also, the thermal conductivities of No. 2 composite are about 2.82 times as high as that of No. 10 composites. As seen, the thermal conductivities of the composites prepared by multi-scale hybrid particles (No. 1 to No. 7) are higher than those prepared by single diameter fillers (No. 8 to No. 10), which is highly coincident with the test results of the maximum filling content and tap density. The comprehensive analysis find that the composite filled from formulation No. 2 has the highest maximum filling content and thermal conductivity because of the optimum combination of three kinds of graphite powders, which forms rich thermal conductive network.
Fig. 6c and d exhibit the relationships between the tap densities, the maximum filling contents of ten set formulations and the thermal conductivities of composite prepared by these formulations. In Fig. 6c, the thermal conductivities of these composite raise linearly as the raise of maximum filling contents. Notably, the maximum filling contents of the fillers and the thermal conductivities of the composites also raise linearly as the increase of the tap densities of the fillers. Based upon the results of data analysis, the maximum filling content of fillers and the thermal conductivities of composite can be accurately predicted by simply testing the tap densities of fillers, which will greatly simplify the follow-up experiments.
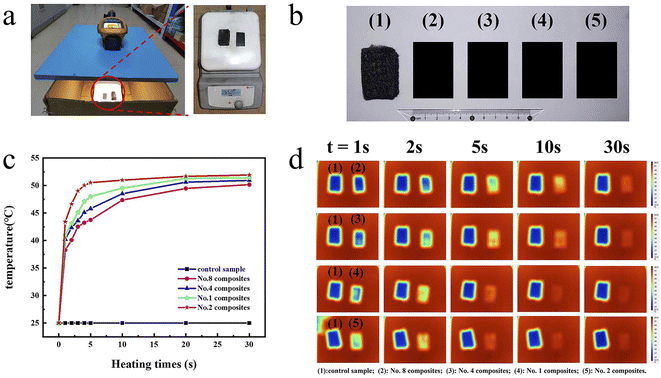
To intuitively explore the thermal management applications of the No. 2 formulation derived composite, its alteration of the composite surface temperature with heating time were captured by an infrared thermograph. The composite filled from the formulation No. 1, No. 4 and No. 8 are taken as controls. Fig. 7a and b show the optical photos of the experimental device and the prepared thermal conducting pads. To assess the heat conduction effect of these pads, one thermally conductive pad and one control sample are horizontally located on the heating stage after the temperature of the heating table stabilized in 55 °C, and the other three samples are tested in the same way. The four thermal conductive pads had similar size (35 mm × 20 mm) and thickness (1.0 mm).
In Fig. 7c, the surface temperature of composite under different heating time are exhibited. The temperature of No. 2 composites rapidly increases to 50.5 °C after only 5 seconds due to its excellent thermal conductivity. Conversely, the temperatures of No. 1, No. 3, No. 7 composites only rise to 48.0, 45.8 and 43.7 °C after 5 seconds, respectively. After 35 seconds, the temperature of No. 2 composites raises to 51.9 °C, which is the highest among the four pads, signifying outstanding heat-conduction performances. Simultaneously, the temperature variation of these thermal conductive composites during the heating were intuitively observed by infrared thermal cameras. In Fig. 7d, the superior heat transport performance of No. 2 composites is clearly illustrated by infrared thermography. During heating, four thermal conductive pads have obviously discrepant temperature distribution. No. 2 composite shows the fastest temperature response, which specifically shows the most obvious color change in infrared thermal images. Evidently, No. 2 composites exhibit the best thermally conductive properties compared with No. 1, No. 4 and No. 7 composites, demonstrating advantage of the optimal formulation of No. 2 based on a modified calculation method. All above results indicate that spherical graphite powders are considerably promising thermally conducting fillers and calculation method No. 2 is a valuable method for multiscale spherical particle mixing.
4 Conclusions
In this work, three types of spherical graphite with different particle size distribution are employed and show high graphitization degree, high intrinsic thermal conductivity and low tap density. As heat conductive filler, spherical graphite derived composites demonstrate the excellent thermal conductivity and evidently reduced density compared with traditional Al2O3-derived composites. Based on the particle packing theory, an innovative optimization calculation method has been proposed by introducing the quadratic programming method into the traditional calculation method to obtain the optimum formulation of multi-scale spherical graphite particles. The thermal conductivity of the optimum multi-scale hybrid formulation derived composites reaches 1.994 W m−1 K−1, which is 1.72 and 13.3 times of the single particle size-derived composites (1.156 W m−1 K−1) and pure silicone rubber (0.15 W m−1 K−1), accompanying with a low density of 1.812 g cm−3 vs. the 2.31 g cm−3 of the Al2O3-derived composites. In addition, the relationships between the tap density of the graphite powders, maximum filling content and thermal conductivities of the composite are creatively established, which are available for predict the thermal conductivities of composite by simply testing the tap density of fillers. This present work provides an instructional strategy to optimize spherical filler particles for thermal management of the electricals.Author contributions
Dingbang Yan: conceptualization, investigation, methodology, data curation, writing-original draft, writing-review & editing. Zexian Li: software, validation. Nizao Kong: investigation, formal analysis. Min Huang: investigation, formal analysis. Yexin Tian: investigation, data curation. Chong Ye: supervision, funding acquisition. Liqin Fu: investigation, formal analysis. Bingjie Wen: data curation. Jinshui Liu: supervision, funding acquisition. Ruixuan Tan: conceptualization, supervision, funding acquisition. Fei Han: conceptualization, supervision, writing-review & editing, funding acquisition.Conflicts of interest
There are no conflicts to declare.Acknowledgements
The project was supported by the Key Research and Development Program of Hunan Province (No. 2022GK2034), the Young Talent Research Program of Hunan Province (No. 2020RC3023), the Key Project of Science and Technology of Changsha (No. kq2102005) and the funding of State Key Laboratory of Advanced Design and Manufacturing for Vehicle Body in Hunan University (No. 51965010).References
- W. Dai, L. Lv, J. Lu, H. Hou, Q. Yan, F. E. Alam, Y. Li, X. Zeng, J. Yu, Q. Wei, X. Xu, J. Wu, N. Jiang, S. Du, R. Sun, J. Xu, C. Wong and C. Lin, ACS Nano, 2019, 13, 1547–1554 CAS.
- X. Hou, Y. Chen, W. Dai, Z. Wang, H. Li, C.-T. Lin, K. Nishimura, N. Jiang and J. Yu, Chem. Eng. J., 2019, 375, 121921 CrossRef CAS.
- H. Yu, Y. Feng, C. Chen, Z. Zhang, Y. Cai, M. Qin and W. Feng, Carbon, 2021, 179, 348–357 CrossRef CAS.
- R. Prasher, Phys. Rev. B, 2008, 77, 075424 CrossRef.
- X. Hu, M. Huang, N. Kong, F. Han, R. Tan and Q. Huang, Composites, Part B, 2021, 227, 109398 CrossRef CAS.
- M. Wang, T. Zhang, D. Mao, Y. Yao, X. Zeng, L. Ren, Q. Cai, S. Mateti, L. H. Li, X. Zeng, G. Du, R. Sun, Y. Chen, J. Xu and C. Wong, ACS Nano, 2019, 13, 7402–7409 CrossRef CAS PubMed.
- S. Xu, T. Cheng, Q. Yan, C. Shen, Y. Yu, C. Lin, F. Ding and J. Zhang, Adv. Sci., 2022, 9, 2200737 CrossRef CAS PubMed.
- Q. Yan, F. E. Alam, J. Gao, W. Dai, X. Tan, L. Lv, J. Wang, H. Zhang, D. Chen, K. Nishimura, L. Wang, J. Yu, J. Lu, R. Sun, R. Xiang, S. Maruyama, H. Zhang, S. Wu, N. Jiang and C. Lin, Adv. Funct. Mater., 2021, 31, 2104062 CrossRef CAS.
- K. M. F. Shahil and A. A. Balandin, Nano Lett., 2012, 12, 861–867 CrossRef CAS PubMed.
- J. Due and A. J. Robinson, Appl. Therm. Eng., 2013, 50, 455–463 CrossRef CAS.
- Q. Hu, X. Bai, C. Zhang, X. Zeng, Z. Huang, J. Li, J. Li and Y. Zhang, Composites, Part A, 2022, 152, 106681 CrossRef CAS.
- X. Tan, J. Ying, J. Gao, Q. Yan, L. Lv, K. Nishimura, Q. Wei, H. Li, S. Du, B. Wu, R. Xiang, J. Yu, N. Jiang, C. Lin and W. Dai, Compos. Commun., 2021, 24, 100621 CrossRef.
- L. Zhang, Q. Wei, J. An, L. Ma, K. Zhou, W. Ye, Z. Yu, X. Gan, C. Lin and J. Luo, Chem. Eng. J., 2020, 380, 122551 CrossRef CAS.
- W. Zhou, S. Qi, C. Tu, H. Zhao, C. Wang and J. Kou, J. Appl. Polym. Sci., 2007, 104, 1312–1318 CrossRef CAS.
- M. Harada, D. Morioka and M. Ochi, J. Appl. Polym. Sci., 2018, 135, 46186 CrossRef.
- J. Gao, Q. Yan, L. Lv, X. Tan, J. Ying, K. Yang, J. Yu, S. Du, Q. Wei, R. Xiang, Y. Yao, X. Zeng, R. Sun, C. Wong, N. Jiang, C. Lin and W. Dai, Chem. Eng. J., 2021, 419, 129609 CrossRef CAS.
- C. Liu, W. Yu, J. Yang, Y. Zhang and H. Xie, Int. Commun. Heat Mass Transfer, 2021, 127, 105553 CrossRef CAS.
- X. Yang, L. Tang, Y. Guo, C. Liang, Q. Zhang, K. Kou and J. Gu, Composites, Part A, 2017, 101, 237–242 CrossRef CAS.
- L. Yu, D. Yang, Q. Wei and L. Zhang, Compos. Sci. Technol., 2021, 209, 108786 CrossRef CAS.
- Q. Wu, J. Miao, W. Li, Q. Yang, Y. Huang, Z. Fu and L. Yang, Materials, 2022, 15, 735 CrossRef CAS.
- G. Yuan, X. Li, J. Yi, Z. Dong, A. Westwood, B. Li, Z. Cui, Y. Cong, J. Zhang and Y. Li, Carbon, 2015, 95, 1007–1019 CrossRef CAS.
- X. Zhang, X. Li, G. Yuan, Z. Dong, G. Ma and B. Rand, Carbon, 2017, 114, 59–69 CrossRef CAS.
- H. He, Y. Zhang, X. Zeng, Z. Ye, C. Zhang, T. Liang, J. Li, Q. Hu and P. Zhang, Compos. Commun., 2021, 27, 100795 CrossRef.
- M. Li, Z. Ali, X. Wei, L. Li, G. Song, X. Hou, H. Do, J. C. Greer, Z. Pan, C. Lin, N. Jiang and J. Yu, Composites, Part B, 2021, 208, 108599 CrossRef CAS.
- X. Zhang, S. Zhou, B. Xie, W. Lan, Y. Fan, R. Hu and X. Luo, Compos. Sci. Technol., 2021, 213, 108922 CrossRef CAS.
- Z. Gao and L. Zhao, Mater. Des., 2015, 66, 176–182 CrossRef CAS.
- S. Liu, B. Zhao, L. Jiang, Y.-W. Zhu, X.-Z. Fu, R. Sun, J.-B. Xu and C.-P. Wong, J. Mater. Chem. C, 2018, 6, 257–265 RSC.
- Y. Feng, C. He, Y. Wen, X. Zhou, X. Xie, Y. Ye and Y. Mai, Compos. Sci. Technol., 2018, 160, 42–49 CrossRef CAS.
- Z. Huang, W. Wu, D. Drummer, C. Liu, Y. Wang and Z. Wang, J. Appl. Polym. Sci., 2021, 138, 50899 CrossRef.
- F. An, X. Li, P. Min, P. Liu, Z. Jiang and Z. Yu, ACS Appl. Mater. Interfaces, 2018, 10, 17383–17392 CrossRef CAS PubMed.
- Y. Zhang, Y. Heo, Y. Son, I. In, K. An, B. Kim and S. Park, Carbon, 2019, 142, 445–460 CrossRef CAS.
- H. Liu, S. Gu, H. Cao, X. Li and Y. Li, Compos. Commun., 2010, 19, 25–29 CrossRef.
- F. Lange, H. Mörtel and V. Rudert, Cem. Concr. Res., 1997, 27, 1481–1488 CrossRef CAS.
- J. William, KONA, 2003, 21, 133–142 CrossRef.
- S. Lu, J. Xu, E. Bai and X. Luo, J. Mater. Civ. Eng., 2017, 29, 04017127 CrossRef.
- X. Guo, S. Cheng, W. Cai, Y. Zhang and X.-a. Zhang, Mater. Des., 2021, 209, 109936 CrossRef CAS.
- F. Ren, P. Ren, Y. Di, D. Chen and G. Liu, Polym.-Plast. Technol. Eng., 2011, 50, 791–796 CrossRef CAS.
- J. Yu, H. K. Choi, H. S. Kim and S. Y. Kim, Composites, Part A, 2016, 88, 79–85 CrossRef CAS.
- T. Zhang, B. G. Sammakia, Z. Yang and H. Wang, J. Electron. Packag., 2018, 140, 031006 CrossRef.
- M. M. Rueda, M. C. Auscher, R. Fulchiron, T. Périé, G. Martin, P. Sonntag and P. Cassagnau, Prog. Polym. Sci., 2017, 66, 22–53 CrossRef CAS.
- A. H. M. Andreasen, Colloid Polym. Sci., 1929, 48, 175–179 CrossRef CAS.
- D. R. Dinger and J. E. Funk, MRS Bull., 1997, 22, 19–23 CrossRef CAS.
- L. Mao, J. Han, D. Zhao, N. Song, L. Shi and J. Wang, ACS Appl. Mater. Interfaces, 2018, 10, 33556–33563 CrossRef CAS PubMed.
- D. Mao, J. Chen, L. Ren, K. Zhang, M. M. F. Yuen, X. Zeng, R. Sun, J.-B. Xu and C.-P. Wong, Composites, Part A, 2019, 123, 260–269 CrossRef CAS.
Footnote |
| † Electronic supplementary information (ESI) available. See https://doi.org/10.1039/d2ra04633d |
| This journal is © The Royal Society of Chemistry 2022 |

