 Open Access Article
Contrast enhanced sonothrombolysis using streptokinase loaded phase change nano-droplets for potential treatment of deep venous thrombosis†
Usama Masooda,
Ramish Riaza,
Saeed Ullah Shahb,
Ayesha Isani Majeedc and
Shah Rukh Abbas *a
*a
aDepartment of Industrial Biotechnology, Atta-Ur-Rahman School of Applied Biosciences (ASAB), National University of Sciences and Technology, Islamabad, Pakistan. E-mail: sabbas@asab.nust.edu.pk
bDepartment of Cardiology, Shifa International Hospitals Ltd., Islamabad, Pakistan
cDepartment of Radiology, Pakistan Institute of Medical Sciences, Islamabad, Pakistan
First published on 20th September 2022
Abstract
Current thrombolytic therapies for deep venous thrombosis are limited due to the wide side effect profile. Contrast mediated sonothrombolysis is a promising approach for thrombus treatment. The current study examines the effectiveness of in vitro streptokinase (SK) loaded phase-change nanodroplet (PCND) mediated sonothrombolysis at 7 MHz for the diagnosis of deep venous thrombosis. Lecithin shell and perfluorohexane core nanodroplets were prepared via the thin-film hydration method and morphologically characterized. Sonothrombolysis was performed at 7 MHz at different mechanical indexes of samples i.e., only sonothrombolysis, PCND mediated sonothrombolysis, sonothrombolysis with SK and SK loaded PCND mediated sonothrombolysis. Thrombolysis efficacy was assessed by measuring clot weight changes during 30 min US exposure, recording the mean gray intensity from the US images of the clot by computer software ImageJ, and spectrophotometric quantification of the hemoglobin in the clot lysate. In 15 minutes of sonothrombolysis performed at high mechanical index (0.9 and 1.2), SK loaded PCNDs showed a 48.61% and 74.29% reduction of mean gray intensity. At 0.9 and 1.2 MI, 86% and 92% weight loss was noted for SK-loaded PCNDs in confidence with spectrophotometric results. A significant difference (P < 0.05) was noted for SK-loaded PCND mediated sonothrombolysis compared to other groups. Loading of SK inside the PCNDs enhanced the efficacy of sonothrombolysis. An increase in MI and time also increased the efficacy of sonothrombolysis. This in vitro study showed the potential use of SK-loaded perfluorohexane core PCNDs as sonothrombolytic agents for deep venous thrombosis.
1. Introduction
The deep vein thrombosis (DVT) is a widespread disease with complicated pathophysiology and a significant economic cost. DVT often starts without any symptoms, but it frequently leads to pulmonary emboli, which is one of the common causes of mortality in hospitalized patients.1 Short-term anticoagulation along with heparin is the standard method of treatment, accompanied by long term usage of oral anticoagulants (3 to 6 months).2,3 Nevertheless, this mode of treatment frequently fails to recanalize veins, leading to post-thrombotic syndrome and venous valve dysfunction.4 Rapid recanalization of the vessels, according to studies, helps sustain valve competency.5 To assure long-term stability of the affected vessel, a treatment that stimulates active disintegration of the blockage is desired. In the more serious conditions of DVT, thrombolytic drugs (e.g., streptokinase, urokinase, rt-PA) are employed, although they come with a risk of significant bleeding.6 Mechanical thrombectomy and catheter-directed thrombolytics are also options, although they come with the same risks of pulmonary embolism and bleeding if not properly filtered.7Energy of ultrasonics has been extensively studied as a means of promoting thrombolysis.8,9 In most previous studies, ultrasonography was utilized to increase the efficacy of a thrombolytic drug or as a means of mechanical thrombectomy utilizing a catheter-based device.10 In vitro and in vivo models have been used to demonstrate the feasibility of these approaches.11 Clinical studies have also shown the efficacy of ultrasound-enhanced thrombolysis, which uses low-power transcutaneous or catheter-delivered ultrasound in combination with thrombolytic medicines to treat ischemic stroke.12,13 Along with an extracorporeal positioning, ultrasound can be targeted to a higher intensity within internal organs or vessels. Ultrasound-induced the shear forces or cavitation bubbles can increase thrombolytic drug distribution and penetration into the clot, increasing potency.14 However, the prolonged presence of substantial adverse effects associated with thrombolytic medicines or catheter-based mechanical thrombectomy are limits of these techniques.
Targeted transcutaneous ultrasonography is also employed in histotripsy, but no thrombolytic drugs are used. Conversely, histotripsy uses short, high-intensity ultrasound pulse to create acoustic cavitation, which causes a controlled mechanical breakup of the thrombus.15,16 Cavitation bubbles grow and contract in response to ultrasonic pressure at the focal. The thrombus is mechanically ruptured as a result of this action, which causes high localized pressure in the thrombus.17 Above a certain pressure threshold, a cloud of cavitation bubbles occurs near the transducer’s focus,18 inducing mechanical breakup of the thrombus in acellular detritus.19 In vitro, histotripsy resulted in full disintegration of 300 mg thrombi in under 2 minutes. Approximately most of the procedure’s debris had a diameter of 100 μm. The bubble cloud might be seen as a dynamic, hyperechoic zone on ultrasound imaging, providing real-time feedback on therapeutic progress and efficacy.20 The technique has been employed in treatment of deep venous thrombosis also. Maxwell et al. conducted a study and utilized 1 MHz focused transducer and used 14 to 19 MPa waves for treatment DVT in porcine model and visualized it via 8 MHz probe.21
Catheter directed thrombolysis is also an effective way of treating deep venous thrombosis. In catheter directed thrombolysis, catheter is advanced to the blocked vessel and thrombolytic drug is directly infused to the affected area. Catheter mediated sonothrombolysis is more advanced technique merging sonothrombolysis via forward looking intravascular transducers and administration of anticoagulants.22 The efficacy is further enhanced by microbubble/nanodroplet administration. Use of microbubble contrast agents lowers the threshold of cavitation.23 They accelerate the thrombolysis by creating localized mechanical stress in thrombus. Loading of microbubbles with anti-thrombolytic agents can further increase the thrombolytic efficiency while decreasing the systemic side effects of anti-thrombolytic therapy by local release of drug.24 Multiple in vivo studies on microbubble mediated sonothrombolysis has shown its potential in treating thrombosis of different regions including illio-femoral arteries, coronary arteries and cerebral vessels.25–27
Compared to microbubbles phase convertible nanodroplets are proved to be safer and more effective in sonothrombolysis. Due to their small size they are able to penetrate more in clots compared to microbubble. Also they create debris of smaller size resulting in less chanced of embolism.28 Recently Goel et al. studied the effect of nanodroplets mediated catheter directed sonothrombolysis for retracted clots and founds significantly high lysis effect for phase change nanodroplets compared to microbubbles.29
The diagnostic frequency range utilized for imaging DVT of extremities lie between 5 and 10 MHz frequency with mechanical index (MI) range of 0.1 to 1.5.30 The FDA approved limit for safe use of ultrasound allows MI of 1.9 corresponding to 5 MPa. Therefore, majority of clinical scanner have MI range of 0.1 to 1.5 MI corresponding to 0.81 MPa to 5 MPa at 7.5 MHz frequency. Currently studies are focused on designing such constructs which break clot in diagnostic MI range especially for middle cerebral artery (MCA).24 Commercially available contrast agents are designed for low frequency applications and usually respond best between 2 and 5 MHz frequency range and are in study for sonothrombolysis of MCA. For theragnostic application of DVT, microbubbles must be able to perform at higher frequencies as diagnosis of both upper and lower extremity DVT is usually done via linear probes having frequency range of 5 to 10 MHz.23
Herein, we synthesized perfluorohexane loaded PCNDs and used them for contrast mediated sonothrombolysis due to its higher acoustic droplet vaporization (ADV) and ability to perform at higher frequencies.31 We built an in vitro model of DVT and intended to cure thrombi by diagnostic ultrasound at mechanical indices ranging from 0.1 to 1.2 corresponding to 0.83 to 4.05 MPa. Clots were produced in the polyurethane tube for our research model, simulating human thrombi, and the thrombus was detected and targeted fully through ultrasonic imaging at 7.5 MHz.
2. Experimental
Study was approved by NUST Ethical Review Committee. Blood from healthy volunteers was taken after informed verbal consent for making in vitro thrombus model. None of the experiments involved any in vivo experimentation.2.1. Materials
Chloroform and Tween 80 were purchased from Sigma Aldrich, cholesterol from Scharlau, and perfluorohexane (PFH) from Shanghai Tianfu. SK (Streptase® 1.5M IU) was provided as a gift from Shifa International Hospital solely for research purposes.2.2. Synthesis of PCNDs
Firstly, perfluorohexane emulsion was prepared by taking 10 ml of 2.5% solution of Tween 80 in PBS and adding 0.5 ml of PFH drop by drop on a magnetic stirrer until the PFH is dissolved. PCNDs were prepared by the method of thin-film hydration. For this 50 mg of the soy lecithin and 10 mg of the cholesterol were dissolved in chloroform. Chloroform was evaporated under the vacuum at a temperature of 50 °C in the rotary evaporator until the thin film was deposited at the round bottom flask. Thin film was dried for 1 hour under the vacuum. Deposited film was rehydrated with the 10 ml of prepared PFH emulsion and heated above the transition temperature of the soy lecithin (Tm = 50 °C) for encapsulation of PFH within soya lecithin. For SK loaded PCNDs, thin film was rehydrated with the SK containing emulsion. SK emulsion was prepared via dropwise addition of both SK and PFH in solution of 2.5% Tween 80 and PBS upon continuous stirring. The PCNDs suspension was than extruded three times to reduce the size of the PCNDs followed by centrifugation at 6000 rpm. For extrusion, PCNDs were passed through 0.4 μm membrane filter under vacuum filtration.2.3. Drug encapsulation efficiency
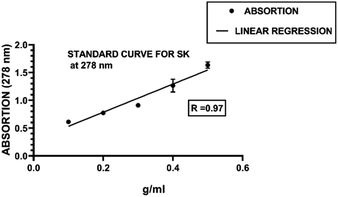
UV visible spectrophotometer (Analytik Jena Germany, Model: SPECORD 200 Plus) was used for measuring the SK content in lecithin PCNDs at a specific wavelength of 278 nm. Blank utilized in the procedure was 95% ethanol to ensure the quality of results. For the quantification of the SK, the suspension should be free first from the free drug that was present in the medium. For disruption of the lecithin PCNDs, 2 ml ethanol should be added into the medium which ultimately led to drug release. Then the sample was subjected to vigorous vortex and centrifugation at 4000 rpm for 10 min to separate the lipid precipitates. Lipid was settled as pallet while the drug was collected from supernatant which was further subjected to spectrophotometric studies.32To find out the SK quantity in the lecithin PCNDs, a calibration curve was drawn for SK. For this SK was dissolved in the dextrose water and make dilutions i.e., range 0.1–0.5 g ml−1 with linear equation (y = 2.57x + 0.265) and used to find out the concentration of the SK in the lecithin PCNDs and to find out the encapsulation efficiency of the SK in the lecithin PCNDs, to quantify the amount of the SK in the PCNDs UV absorption of the sample was recorded and compared with the calibrated curve of the SK and that experiment was performed three times and the average result values were put in the formula given below to calculate the encapsulation efficiency of SK in the PCNDs.
2.4. Preparation of in vitro thrombus model
For in vitro clot model, urinary bag tubes made up of poly urethane were used to mimic deep veins. The size of tube was 24 fr i.e., 8 mm in diameter and length of 10 cm resembling femoral veins. Poly urethane tubes were chosen because of their visibility under ultrasound. The material has speed of 1700 m s−1, density of 1.04 g cm−3 and acoustic impedance of 1.80 MRayls. Water was injected inside the tubes form both ends. Clot was developed in the center with an approx. size of 2–3 cm. PCNDs were injected from single end of tube. Tubes were clamped in container filled with water. Since water has acoustic impedance of 1.48 MRayls. Mismatch between both made the tubes and clot visible. The tubes allowed the transmission of ultrasound beam as speed of sound in both water and tube lie within soft tissue ranges of speed of sound.A blood clot was prepared according to the method reported in the literature.33 For this volume of 2.5 ml of 100 mM molarity of calcium, chloride solution was taken, and mixed in the 1 ml of anticoagulated human blood that was collected from the volunteer. After 5 minutes, the mixture was injected into the poly urethane tubes while taking care to avoid the injection of air bubbles in the poly urethane tube. Then, blood containing polyurethane tubes were incubated at 37 °C for the duration of 3 hours followed by refrigeration for 3 days to allow proper retraction of the clot.
2.5. Physiochemical characterization of microbubble constructs
2.6. Acoustic setup for sonothrombolysis
The prepared clot model was subjected to the process of the sonothrombolysis under diagnostic ultrasound (Toshiba Applio 500, Japan) with PLT 805 11L4 Linear array probe (5 to 11 MHz). Following parameters were used:• Central frequency of transducer = 7.5 MHz.
• Mechanical index of produced ultrasound (MI) = 0.1, 0.3, 0.6, 0.9 and 1.2.
• Depth = 5 cm.
• PRF-15.4 kHz.
• Frame rate = 60 fps.
• Gain = 85.
• Focus: 2 cm exactly in line with clot.
Imaging: performed in longitudinal direction with probe hanged 2 cm above clot (ESI Fig. 1†).
In this study blood clot model was exposed to ultrasound waves for 30 minutes with under different conditions i.e., sonothrombolysis only (US only), PCND mediated sonothrombolysis (US + PCNDS), sonothrombolysis with iv SK administration (US + SK), SK loaded PCNDs contrast mediated sonothrombolysis (US + SK loaded PCNDS). Sonothrombolysis of these samples was analyzed by mean gray intensity analysis of ultrasound images of the blood clot, pre and post percentage weight loss of the blood clot, and hemoglobin analysis in the clot lysate that we collected after 30 minutes of the process of the sonothrombolysis by absorption at UV visible spectrophotometer analysis.
3. Results and discussion
3.1. Physicochemical analysis of PCNDs
The average size of the lecithin PCNDs was 357.8 nm ± 124 in zeta sizing analysis as shown in the table. For lecithin PCNDs, the zeta potential was found to be −28.3 (mV) as shown in Table 1.
| Sample | SEM size (nm) | Zeta size (nm) | Zeta potential | PDI |
|---|---|---|---|---|
| Lecithin PCNDs | 366.761 ± 7 | 357.8 ± 124 | −28.5 | 0.149 |
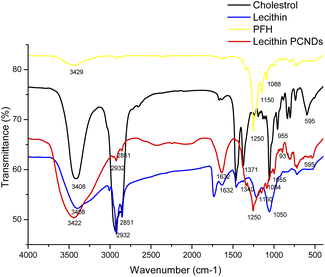
![[double bond, length as m-dash]](https://www.rsc.org/images/entities/char_e001.gif) O between 1200 and 1146 cm−1 and P–O–C, 1446 cm−1 to 788 cm−1. The dominant bands located at 3412 cm−1 to 593 cm−1 correspond to the pure cholesterol spectrum Fig. 2(c). The presence of OH stretches is due to the strong vibration band observed at 3408 cm−1. Fig. 2, red curve shows a strong band at 3440 cm−1 of PFH loaded lecithin PCNDS due to its stretching of OH (strong hydrogen bonding). CH degree of absorption is due to the absorption peaks 2932-1 and 2851-1. The C
O between 1200 and 1146 cm−1 and P–O–C, 1446 cm−1 to 788 cm−1. The dominant bands located at 3412 cm−1 to 593 cm−1 correspond to the pure cholesterol spectrum Fig. 2(c). The presence of OH stretches is due to the strong vibration band observed at 3408 cm−1. Fig. 2, red curve shows a strong band at 3440 cm−1 of PFH loaded lecithin PCNDS due to its stretching of OH (strong hydrogen bonding). CH degree of absorption is due to the absorption peaks 2932-1 and 2851-1. The C![[double bond, length as m-dash]](https://www.rsc.org/images/entities/char_e001.gif) C band can be measured at 1632 cm−1 suggesting binding of lecithin and cholesterol. Appearance of 1250 cm−1 peak in PCNDs shows successful incorporation of PFH in these PCNDs. All these peaks correspond with the peaks of PCNDs reported in the literature.34
C band can be measured at 1632 cm−1 suggesting binding of lecithin and cholesterol. Appearance of 1250 cm−1 peak in PCNDs shows successful incorporation of PFH in these PCNDs. All these peaks correspond with the peaks of PCNDs reported in the literature.34
3.2. SK encapsulation efficiency
For the standard curve for SK, a graph was generated between the absorbance of the UV spectrophotometer and the concentrations Fig. 3. The concentration of the free SK in the supernatant was determined through this curve using the following equation.| y = mx + b |
Therefore.
According to this, SK loading efficiency was found to be 64.71%.
3.3. Analysis of sonothrombolytic efficiency
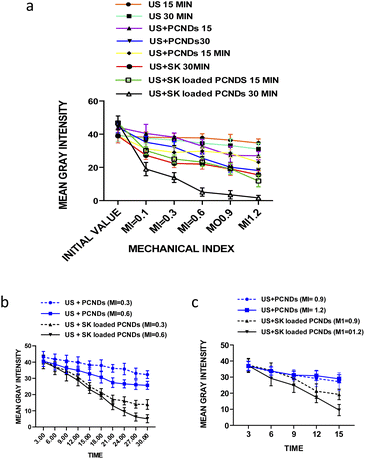
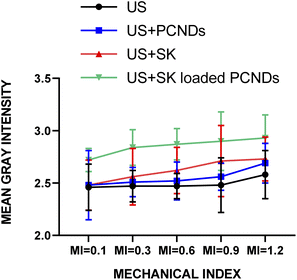
Fig. 4(a) is showing the gradual decrease of mean gray intensity at all mechanical index (0.1, 0.3, 0.6, 0.9 and 1.2) for sonothrombolysis performed for 15 and 30 minutes with all samples. Significant difference (P-value < 0.01, ESI Table 12†) was found between 0.3 and 0.6 MI for SK loaded PCNDs which showed 66.34% and 87.27% respectively. In 15 minutes of sonothrombolysis performed at high mechanical index (0.9 and 1.2), SK loaded PCNDs 48.61% and 74.29% respectively reduction of mean gray intensity with (US + SK loaded PCNDS). Among all groups SK loaded PCNDs showed more thrombolysis than contrast only PCNDs (P-value < 0.01, ESI Table 1†).
Fig. 4(b) and (c) shows the graph between mean gray intensity and time to compare the reduction of mean gray intensity at low MI for 30 minutes of sonothrombolysis and at high MI for 15 minutes of sonothrombolysis respectively. Sonothrombolysis performed for 30 minutes with (US + SK loaded PCNDs) showed maximum reduction of mean gray intensity at mechanical index 1.2. Sonothrombolysis performed for 15 and 30 minutes with (US + PCNDS) also showed 38.77% and 58.95% reduction of mean gray intensity respectively.
Within time domain again loaded PCNDs showed more thrombolysis than contrast only PCNDs (P-value < 0.01, ESI Table 2†).
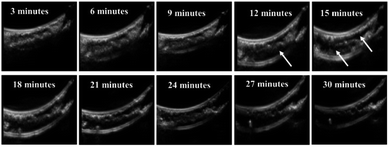
These results show that loading of SK in PCNDs, increase in MI and increase in time duration increases the thrombolytic efficiency. Leeman et al. also observed that increase in MI from 0.6 to 1.2 and loading of rtPA increases the microbubble mediated sonothrombolytic efficiency.37 Fig. 5 shows the original images of sonothrombolysis.
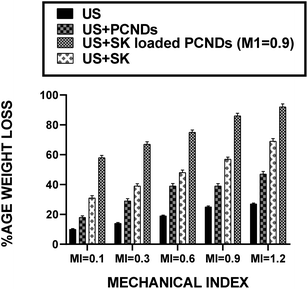
Weight loss analysis also showed similar results i.e., at all mechanical indices, SK loaded PCNDs showed highest efficacy for sonothrombolysis, followed by sonothrombolysis and iv SK administration, microbubble mediated sonothrombolysis and sonothrombolysis alone. ESI Table 3† shows the ANOVA results of these findings depicting the mentioned pattern.
With increase of mechanical index, percentage weigh loss increased in all the samples i.e., (US only), (US + PCNDS), (US + SK) and (US + SK loaded PCNDS). Maximum percentage weight loss of thrombus was recorded when sonothrombolysis performed with (US + SK loaded PCNDS) at all mechanical index (i.e., 0.1, 0.3, 0.6, 0.9 and 1.2) with percentage age weight loss of thrombus being 58%, 67%, 75%, 86% and 92% respectively (Fig. 6).
Fig. 7 is showing a plotted graph between absorption and mechanical index. The results were similar as observed by ROI mean intensity and percentage weigh loss measurements. Maximum absorption of hemoglobin was recorded for clot lysate that were collected after the sonothrombolysis performed with SK loaded PCNDS at MI 1.2.
PCNDs contrast mediated sonothrombolysis is widely researched topic due to its safety, noninvasiveness and cost. However, majority of papers are focused on use of lower frequency probe either in kHz frequency or with 1 to 3 MHz frequency to be used for stroke imaging and thrombolysis. Also, the reason could be use of standard contrast agents in these studies like Definity, Sonovue etc., all of which perform better up to 3 MHz frequency and their microbubbles destabilized at 7.5 MHz frequency.38–40 We used PFH as core gas material which has higher ADV achieved at higher frequencies. This made our PCNDs to respond at 7.5 MHz frequency and able to perform thrombolysis at high frequency.31,41 This make our PCNDs as excellent theranostic agent for DVT.
4. Conclusion
SK loaded PCNDs demonstrated successful sonothrombolysis at 7.5 MHz frequency therefore can be used as potential candidate for deep venous thrombosis therapy. They performed better than unloaded PCNDs or sonothrombolysis therapy alone. Thrombolytic efficiency increased with increase in MI and time.Funding
The project was funded by Higher Education Commission with grant ID HEC-NRPU-10222 and was awarded to Dr Shah Rukh Abbas.Author contributions
Usama Masood: data curation, formal analysis, methodology, visualization, validation, writing – original draft. Ramish Riaz: data curation, formal analysis, methodology, validation. Saeed Ullah Shah: formal analysis, methodolgy. Ayesha Isani Majeed: formal analysis, methodology. Shah R Abbas: conceptualization, supervision, funding acquisition, supervision, writing – review & editing.Conflicts of interest
There are no conflicts to declare.Acknowledgements
We want to acknowledge HEC for funding the project. Special thanks to PIMS staff members who provided us with clinical ultrasound scanner.References
- G. D. Motykie, L. P. Zebala, J. A. Caprini, C. E. Lee, J. I. Arcelus and J. J. Reyna, et al., A guide to venous thromboembolism risk factor assessment, J. Thromb. Thrombolysis, 2000, 9(3), 253–262 CrossRef CAS PubMed.
- P. Prandoni, A. W. Lensing, H. R. Büller, A. Cogo, M. H. Prins and A. M. Cattelan, et al., Deep-vein thrombosis and the incidence of subsequent symptomatic cancer, N. Engl. J. Med., 1992, 327(16), 1128–1133 CrossRef CAS PubMed.
- M. J. Sharafuddin, S. Sun, J. J. Hoballah, F. M. Youness, W. J. Sharp and B.-S. Roh, Endovascular management of venous thrombotic and occlusive diseases of the lower extremities, J. Vasc. Intervent. Radiol., 2003, 14(4), 405–423 CrossRef.
- A. J. Comerota and D. J. Paolini, Treatment of acute iliofemoral deep venous thrombosis: a strategy of thrombus removal, Eur. J. Vasc. Endovasc. Surg., 2007, 33(3), 351–352 CrossRef CAS PubMed.
- M. H. Meissner, R. A. Manzo, R. O. Bergelin, A. Markel and D. E. J. Strandness, Deep venous insufficiency: the relationship between lysis and subsequent reflux, J. Vasc. Surg., 1993, 18(4), 596–598 CrossRef CAS.
- H. D. White and D. P. Chew, Acute myocardial infarction, Lancet, 2008, 372(9638), 570–584 CrossRef CAS.
- M. J. Sharafuddin and M. E. Hicks, Current status of percutaneous mechanical thrombectomy. Part I. General principles, J. Vasc. Intervent. Radiol., 1997, 8(6), 911–921 CrossRef CAS.
- G. Trübestein, C. Engel, F. Etzel, A. Sobbe, H. Cremer and U. Stumpff, Thrombolysis by ultrasound, Clin. Sci. Mol. Med., Suppl., 1976, 3, 697s–698s Search PubMed.
- K. Tachibana, Enhancement of fibrinolysis with ultrasound energy, J. Vasc. Intervent. Radiol., 1992, 3(2), 299–303 CrossRef CAS.
- S. Atar and U. Rosenschein, Perspectives on the role of ultrasonic devices in thrombolysis, J. Thromb. Thrombolysis, 2004, 17(2), 107–114 CrossRef PubMed.
- B. Devcic-Kuhar, S. Pfaffenberger, L. Gherardini, C. Mayer, M. Gröschl and C. Kaun, et al., Ultrasound affects distribution of plasminogen and tissue-type plasminogen activator in whole blood clots in vitro, Thromb. Haemostasis, 2004, 92(5), 980–985 CAS.
- G. Tsivgoulis, J. Eggers, M. Ribo, F. Perren, M. Saqqur and M. Rubiera, et al., Safety and efficacy of ultrasound-enhanced thrombolysis: a comprehensive review and meta-analysis of randomized and nonrandomized studies, Stroke, 2010, 41(2), 280–287 CrossRef PubMed.
- B. R. Mahon, G. M. Nesbit, S. L. Barnwell, W. Clark, T. R. Marotta and A. Weill, et al., North American clinical experience with the EKOS MicroLysUS infusion catheter for the treatment of embolic stroke, AJNR Am. J. Neuroradiol., 2003, 24(3), 534–538 Search PubMed.
- M. J. Stone, V. Frenkel, S. Dromi, P. Thomas, R. P. Lewis and K. C. P. Li, et al., Pulsed-high intensity focused ultrasound enhanced tPA mediated thrombolysis in a novel in vivo clot model, a pilot study, Thromb. Res., 2007, 121(2), 193–202 CrossRef CAS.
- M. Nadrljanski, Z. Milošević, V. Plešinac-Karapandžić and B. Goldner, The role of breast magnetic resonance imaging in the diagnosis of ductal carcinoma in situ, Srp. Arh. Celok. Lek., 2013, 141(5–6), 402–408 CrossRef PubMed.
- Z. Xu, J. B. Fowlkes, A. Ludomirsky and C. A. Cain, Investigation of intensity thresholds for ultrasound tissue erosion, Ultrasound Med. Biol., 2005, 31(12), 1673–1682 CrossRef PubMed.
- A. D. Maxwell, C. A. Cain, A. P. Duryea, L. Yuan, H. S. Gurm and Z. Xu, Noninvasive thrombolysis using pulsed ultrasound cavitation therapy–histotripsy, Ultrasound Med. Biol., 2009, 35(12), 1982–1994 CrossRef PubMed.
- Z. Xu, J. B. Fowlkes, E. D. Rothman, A. M. Levin and C. A. Cain, Controlled ultrasound tissue erosion: the role of dynamic interaction between insonation and microbubble activity, J. Acoust. Soc. Am., 2005, 117(1), 424–435 CrossRef PubMed.
- R. A. Roy, A. A. Atchley, L. A. Crum, J. B. Fowlkes and J. J. Reidy, A precise technique for the measurement of acoustic cavitation thresholds and some preliminary results, J. Acoust. Soc. Am., 1985, 78(5), 1799–1805 CrossRef CAS PubMed.
- T.-Y. Wang, Z. Xu, T. L. Hall, J. B. Fowlkes and C. A. Cain, An efficient treatment strategy for histotripsy by removing cavitation memory, Ultrasound Med. Biol., 2012, 38(5), 753–766 CrossRef PubMed.
- A. D. Maxwell, G. Owens, H. S. Gurm, K. Ives, D. D. J. Myers and Z. Xu, Noninvasive treatment of deep venous thrombosis using pulsed ultrasound cavitation therapy (histotripsy) in a porcine model, J. Vasc. Intervent. Radiol., 2011, 22(3), 369–377 CrossRef.
- D. Fleck, H. Albadawi, F. Shamoun, G. Knuttinen, S. Naidu and R. Oklu, Catheter-directed thrombolysis of deep vein thrombosis: literature review and practice considerations, Cardiovasc. Diagn. Ther., 2017, 7(suppl. 3), S228–S237 CrossRef PubMed.
- T. Şen, O. Tüfekçioğlu and Y. Koza, Mechanical index, Anatolian J. Cardiol., 2015, 15(4), 60 Search PubMed.
- Y. Lu, J. Wang, R. Huang, G. Chen, L. Zhong and S. Shen, et al., Microbubble-Mediated Sonothrombolysis Improves Outcome After Thrombotic Microembolism-Induced Acute Ischemic Stroke, Stroke, 2016, 47(5), 1344–1353, DOI:10.1161/STROKEAHA.115.012056.
- Y. Birnbaum, Y. Luo, T. She Nagai, M. C. Fishbein, T. C. Peterson and S. Li, Noninvasive in vivo clot dissolution without a thrombolytic drug, Circulation, 1998, 97(2), 130–134 CrossRef CAS.
- F. Xie, J. Slikkerveer, J. Lof, E. Unger, S. Radio, T. Mastunga and T. R. Porter, Coronary and microvascular thrombolysis with guided diagnostic ultrasound and microbubbles in acute ST segment elevation myocardial infarction, J. Am. Soc. Echocardiogr., 2011, 24(12), 1400–1408 CrossRef PubMed.
- W. C. Culp, E. Erdem, P. K. Roberson and M. M. Husain, Microbubble potentiated ultrasound as a method of stroke therapy in a pig model: preliminary findings, J. Vasc. Intervent. Radiol., 2003, 14(11), 1433–1436 CrossRef PubMed.
- A. Prabhakar and R. Banerjee, Nanobubble Liposome Complexes for Diagnostic Imaging and Ultrasound-Triggered Drug Delivery in Cancers: A Theranostic Approach, ACS Omega, 2019, 4(13), 15567–15580 CrossRef CAS.
- L. Goel and X. Jiang, Advances in sonothrombolysis techniques using piezoelectric transducers, Sensors, 2020, 20(5), 1288 CrossRef CAS.
- L. Goel, H. Wu, B. Zhang, J. Kim, P. A. Dayton, Z. Xu and J. Xiaoning, Nanodroplet-mediated catheter-directed sonothrombolysis of retracted blood clots, Microsyst. Nanoeng., 2021, 7(1), 3 CrossRef CAS PubMed.
- Y. Zhou, Z. Wang, H. Shen, H. Ran, P. Li, W. SOng, Z. Yang and H. Chen, Microbubbles from gas-generating perfluorohexane nanoemulsions for targeted temperature-sensitive ultrasonography and synergistic HIFU ablation of tumors, Adv. Mater., 2013, 25(30), 4123–4130 CrossRef CAS PubMed.
- P. Panwar, B. Pandey, P. C. Lakhera and K. C. Singh, Preparation, characterization, and in vitro release study of albendazole-encapsulated nanosize liposomes, Int. J. Nanomed., 2010, 5(1), 101–108 CAS.
- B. Petit, E. Gaud, D. Colevret, M. Arditi, F. Yan, F. Tranquart and E. Alleman, In vitro sonothrombolysis of human blood clots with BR38 microbubbles, Ultrasound Med. Biol., 2012, 38(7), 1222–1233 CrossRef.
- A. Prabhakar and R. Banarjee, Nanobubble liposome complexes for diagnostic imaging and ultrasound-triggered drug delivery in cancers: a theranostic approach, ACS Omega, 2019, 4(14), 15567–15580 CrossRef CAS PubMed.
- L. Saba, S. S. Sanagala, S. K. Gupta, V. K. Koppula, M. Amer and M. Johri, et al. Ultrasound-based internal carotid artery plaque characterization using deep learning paradigm on a supercomputer: a cardiovascular disease/stroke risk assessment system, Int. J. Card. Imaging, 2021, 37(5), 1511–1528 CrossRef.
- S. Latha, D. Samiappan and R. Kumar, Carotid artery ultrasound image analysis: a review of the literature, Proc. Inst. Mech. Eng., Part H, 2020, 234(5), 417–443 CrossRef CAS PubMed.
- Y. Zhu, L. Guan and Y. Mu, Combined low-frequency ultrasound and urokinase-containing microbubbles in treatment of femoral artery thrombosis in a rabbit model, PLoS One, 2016, 11(12), e0168909 CrossRef PubMed.
- J. Kim, R. M. DeRuiter, L. Goel, Z. Xu and P. A. Dayton, A comparison of sonothrombolysis in aged clots between low-boiling-point phase-change nanodroplets and microbubbles of the same composition, Ultrasound Med. Biol., 2020, 46(11), 3059–3068 CrossRef PubMed.
- A. T. Brown, R. Flores, E. Hamilton, P. K. Roberson, M. J. Borelli and W. C. Pulp, Microbubbles improve sonothrombolysis in vitro and decrease hemorrhage in vivo in a rabbit stroke model, Invest. Radiol., 2011, 46(3), 202–207 CrossRef PubMed.
- M. J. Borelli, W. Brien, E. Hamilton, M. L. Oelze, J. Wu, L. J. Bernock, S. Tung, H. Rokadia and W.C. Pulp, Influences of microbubble diameter and ultrasonic parameters on in vitro sonothrombolysis efficacy, J. Vasc. Intervent. Radiol., 2012, 23(12), 1677–1684 CrossRef PubMed.
- X. Wang, H. Chen, Y. Chen, M. Ma, K. Zhang, F. Li, Y. Zheng, D. Zheng, Q. Wang and J. SHi, Perfluorohexane-encapsulated mesoporous silica nanocapsules as enhancement agents for highly efficient high intensity focused ultrasound (HIFU), Adv. Mater., 2012, 24(6), 785–791 CrossRef CAS PubMed.
Footnote |
| † Electronic supplementary information (ESI) available. See https://doi.org/10.1039/d2ra04467f |
| This journal is © The Royal Society of Chemistry 2022 |


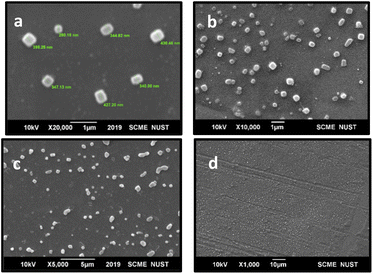
![[thin space (1/6-em)]](https://www.rsc.org/images/entities/char_2009.gif) 000×, 5000× and 1000×.
000×, 5000× and 1000×.