 Open Access Article
New validated spectrofluorimetric protocol for colistin assay through condensation with 2,2-dihydroxyindan-1,3-dione: application to content uniformity testing
Tamer Z. Attia *a,
Mahmoud A. Abdelmajedb,
Mahmoud A. Omarac,
Sultan S. Al Thagfand and
Khalid M. Badr El-Dina
aAnalytical Chemistry Department, Faculty of Pharmacy, Minia University, Minia, Egypt. E-mail: Tamer_zekry_a@yahoo.com
bAnalytical Chemistry Department, Faculty of Pharmacy, Deraya University, New Minia, Egypt
cDepartment of Pharmacognosy and Pharmaceutical Chemistry, College of Pharmacy, Taibah University, Medinah, Saudi Arabia
dDepartment of Clinical and Hospital Pharmacy, College of Pharmacy, Taibah University, Medinah, Saudi Arabia
First published on 23rd November 2022
Abstract
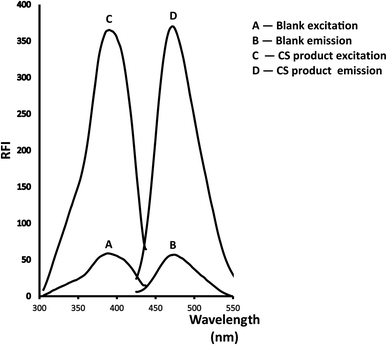
A new, cost-effective and sensitive spectroscopic assay for the quantification of Colistin Sulfate (CS) and its prodrug colistimethate sodium (CMS) has been developed and validated. The validated technique depends on the condensation of the studied drug with 2,2-dihydroxyindan-1,3-dione (ninhydrin) and phenylacetaldehyde using Teorell and Stenhagen buffer (pH = 6) to yield a fluorescent product that is estimated at emission wavelength (λem = 474 nm) after excitation wavelength (λex = 390 nm). The reaction's affecting factors were carefully studied and adjusted accurately. Over the following range (0.4–2.4 μg mL−1), the produced calibration plot looked rectilinear, and the estimated limits of detection and quantification (LOD and LOQ) were 0.051 & 0.154 μg mL−1 respectively. The recommended approach was utilized to evaluate market products containing the investigated drug. Moreover, content uniformity testing was employed as a new procedure not found in the previously reported fluorimetric technique.
1 Introduction
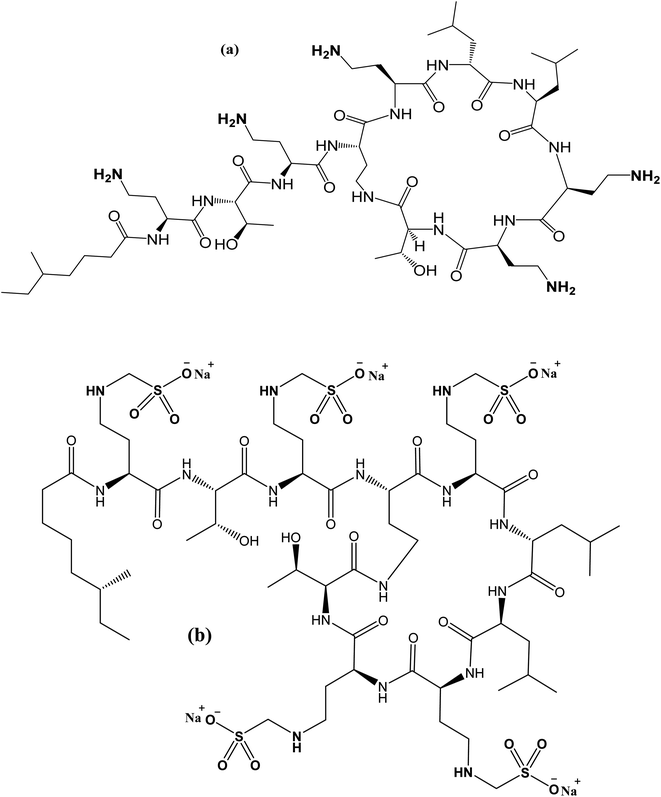
With the advent of multidrug-resistant (MDR) Gram-negative bacteria and the absence of novel antimicrobial drugs, scientists believe in the necessity of polymyxins. Infections caused by MDR Gram-negative bacteria, particularly Pseudomonas aeruginosa, Acinetobacter baumannii, and Klebsiella pneumoniae, have lately increased dramatically, and polymyxins are typically the only active antibiotic available for these bacteria.1–3 The two types of colistin, Colistin Sulfate (CS) for oral use and its prodrug colistimethate sodium (CMS) for parenteral use, have been the drugs of choice for treating such infections. CS is mainly composed of an amide linkage that binds a cationic cyclic decapeptide to a fatty acid chain (Fig. 1).Numerous analytical approaches based on microbiological,4–6 capillary electrophoretic methods,7 and spectroscopic (spectrophotometric8 and fluorimetric methods9) assays were reported. Moreover, published chromatographic techniques such as liquid chromatography (LC)10–16 and high-performance liquid chromatography (HPLC)17–21 were carefully collected for analysis of CS.
The spectrofluorimetry technique had widely applicable nowadays owing to its sensitivity, simplicity, and not requiring a sophisticated instrument or sample pretreatment. On the other hand, separative methods suffer from huge consumption of solvents, high-cost devices, and exhausted extraction processes. Besides, microbiological and spectrophotometric assays suffer from lacking sensitivity. Despite the instrument's simplicity, sensitivity, and availability, there is only one documented fluorimetric technique for the medication under study.
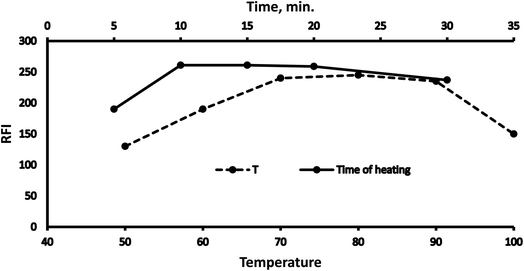
Microbiological and spectrophotometric methods of assay suffer from lacking sensitivity. While, separative methods suffer from huge consumption of solvents, high-cost devices, and exhausted extraction processes. Nowadays, the spectrofluorimetry technique has been widely applicable for determination of several pharmaceutical drugs owing to its sensitivity, simplicity, and not requiring a sophisticated instrument or sample pretreatment. Despite of that, there is only one documented fluorimetric method for determination of the medication under study.9 This spectrofluorimetric method suffered from some drawbacks such as proceeding in extreme conditions as it requires heating in boiling water (100 °C) for 35 minutes. Furthermore, tests for content homogeneity and quantification of the tested medication in tablet dosage form were not performed.
As a consequence, the proposed work aimed to establish a simple, cheap, time-effective, and environmentally friendly spectrofluorimetric approach for the quantification of the investigated drug in its tablet and parenteral dosage forms. Moreover, the application of content uniformity testing for CS tablets was successfully employed.
2 Experimental
2.1 Devices
To obtain the fluorimetric measurements, a 150 watt xenon lamp combined in PerkinElmer LS 45 luminescence spectrometer (United Kingdom) with a 1 cm quartz cell was employed. Both the emission and excitation monochromators were set to a slit width of 10 nm. The data were collected utilizing the software of FL WINLAB™ on a PC that connected to the fluorimeter. Among the equipment employed were a thermostatically controlled MLW-type water bath (Memmert Gmbh, Schwabach, Germany), digital analytical balance (Mettler Toledo, Glattbrugg, Switzerland), and ADWA 11 pH meter (Romania).2.2 Pharmaceutical forms and authentic
Standard CS was kindly gifted by the National Organization of Drug Control and Research (NODCAR) and utilized without further purification. The market product of CMS including Colistin Sulfate® tablets (Sigma Pharmaceutical Co. Cairo, Egypt) and Colomycin® lyophilized powder for injection (Forest Laboratories, United Kingdom) were purchased.2.3 Chemicals and reagents
2,2-Dihydroxyindan-1,3-dione (ninhydrin; Alpha Chemika, Mumbai, India) was daily prepared as 0.1% w/v in distilled water. Phenylacetaldehyde (Sigma-Aldrich) was weekly prepared as 0.02% v/v in ethanol and still stable when refrigerated at 4 °C. All solvents such as ethanol, methanol, acetone, acetonitrile, and dimethylformamide (DMF) along with HCL, phosphoric acid, citric acid, and NaOH were purchased from El Nasr Chemical Co. (Cairo, Egypt). Mixing suitable volumes of concentration 1 molar of phosphoric, citric acid, NaOH, and adjusting the pH utilizing 0.1 M HCL yield pH range (5 to 9) of Teorell & Stenhagen buffer which is used throughout the investigation.2.4 Drug stock solution
Using distilled water, CS was set as a stock solution of 100 μg mL−1. One more dilution was employed yielding working solutions. Its stability remained for nearly a double of weeks when it was kept in a refrigerator at 4 °C.2.5 General methodology
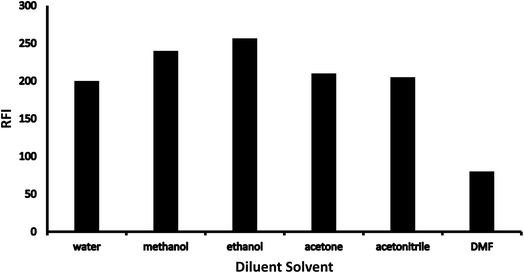
Besides 1 mL of working solutions ranging from 2 to 24 μg mL−1, 1 mL of Teorell & Stenhagen buffer, 1 mL of 0.1% (w/v) ninhydrin, and 1 mL of 0.02% (v/v) phenylacetaldehyde were transferred and well mixed into a set of test tubes. To achieve a complete reaction, all test tubes were heated in a water bath adjusted at 80 °C for 15 minutes after that cooled into a bath of ice. Test tube contents were accurately moved to a 10 mL volumetric flask and diluted to mark utilizing ethanol as diluents. Lastly, the relative fluorescence intensity (RFI) of the yielding solutions was estimated at λem 474 nm (after λex = 390 nm). Simultaneously, a blank solution was performed using the same previously mentioned methodology omitting the investigated drug.2.6 Quantification of CS in market products
2.7 Procedure for content uniformity testing
Ten individually well-crushed Colistin Sulfate® tablets were employed in this assay. Then a specific amount equivalent to 10 mg of the authentic powder was taken from each crushed tablet and filtered with the same solvent to yield 10 μg mL−1 working solutions. Content uniformity testing was implemented following USP guidelines.22 After individually assessing ten pills, the acceptability value (AV) was calculated.3 Results and discussion
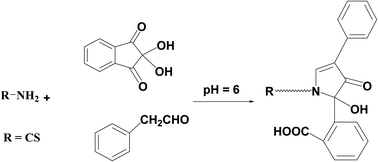
Reviewing the reported HPLC methods employed to quantify the referenced medication, several drawbacks were revealed including frequently requiring enormous quantities of high-analytical grade solvents such as tetrahydrofuran17,19–21 and acetonitrile18–21 which are highly expensive and have a significant harmful influence on the environment. Also, extremely expensive columns such as RP-LiChroCART® Purospher Star® C18 column,18 Cadenza CD-C18 column,19 or an Agilent Poroshell 120 EC-C18 column20 were necessarily equipped in HPLC instrument. In addition, detectors like fluorescence detector, which is very expensive and unattainable in normal quality control laboratories, must be employed in the reported methods.17–21 Moreover, extraction processes such as solid phase extraction using Oasis® HLB cartridges that consumed a large amount of solvent and expensive cartridges were necessary prior to determination.18Therefore, the present study is aimed to develop an environmentally friendly strategy adaptable to routine and rapid screening without being costly, time-consuming, or requiring complicated instrumentation. Generally to assay drugs that have primary amine groups, 2,2-dihydroxyindan-1,3-dione is employed as a derivatizing agent in presence of phenylacetaldehyde.23–26 The reagent reacts with the main amino moiety in the structure resulting in a highly yellow fluorescent derivative. Precision, repeatability, and lower analytical cost are the main key benefits that distinguish this condensation reaction. So in this prescribed study, the derivatizing agents were condensed with the amino moiety of CS and the fluorescent product was measured at λem = 474 nm (after excitation at 390 nm). The suggested reaction and also the spectra of the studied methodology were illustrated in (Fig. 2 and 3) respectively.
3.1 Optimization
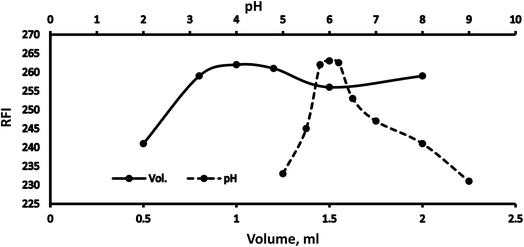
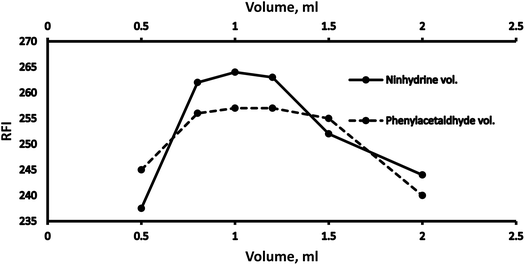
Various methodology parameters were changed whilst freezing the others, to identify the most ideal reaction conditions necessary to yield maximum RFI values.3.2 Methodology validation
Considering ICH criteria,27 the suggested approach was validated by assessing its linearity and range, accuracy, precision, robustness, and sensitivity.| Parameters | Developed method |
|---|---|
| a SD: standard deviation.b LOD: limit of detection.c LOQ: limit of quantitation. | |
| λex (nm) | 390 |
| λem (nm) | 474 |
| Linear range (μg mL−1) | 0.2–2.4 |
| Correlation coefficient (r) | 0.9997 |
| Determination coefficient (r2) | 0.9994 |
| Intercept ± SDa | 2.99 ± 2.32 |
| Slope ± SD | 151.17 ± 1.61 |
| LODb (μg mL−1) | 0.051 |
| LOQc (μg mL−1) | 0.154 |
| Method parameters | % recoverya ± SD | RSD |
|---|---|---|
| a Mean of three determinations. | ||
| pH | ||
| 5.8 | 100.09 ± 1.12 | 1.12 |
| 6 | 99.15 ± 0.94 | 0.95 |
| 6.2 | 99.30 ± 1.60 | 1.61 |
![[thin space (1/6-em)]](https://www.rsc.org/images/entities/char_2009.gif) |
||
| 2,2-Dihydroxyindan-1,3-dione volume | ||
| 0.8 | 98.82 ± 0.48 | 0.49 |
| 1 | 99.76 ± 1.75 | 1.75 |
| 1.2 | 101.01 ± 1.30 | 1.29 |
![[thin space (1/6-em)]](https://www.rsc.org/images/entities/char_2009.gif) |
||
| Phenyl acetaldehyde volume | ||
| 0.8 | 99.74 ± 0.87 | 0.87 |
| 1 | 98.92 ± 1.07 | 1.08 |
| 1.2 | 100.19 ± 0.53 | 0.53 |
Furthermore, to assess the sensitivity of the studied approach, LOD and LOQ values were estimated. Utilizing the formula “LOD = 3.3 SD/S or LOQ = 10 SD/S,” where S is the slope of the calibration graph and SD is the standard deviation of the intercept. LOD and LOQ calculated values were 0.051 and 0.154 μg mL−1, respectively.
3.3 Applications of the described approach
3.4 Content uniformity test
For content uniformity testing, the CS content within every tablet was estimated according to USP guidelines to assure that each tablet had the specified drug content. The estimated AV was 3.084, which is less than the maximum value permitted of 15, showing that the tablets tested had the acceptable uniformity of CS. All values were observed in (Table 7).4 Conclusion
Various obstacles faced in previously described procedures for the analysis of CS and its prodrug CMS, such as the extraction step or even utilizing costly apparatus, solvents, or reagents, were overcome in the current research work.Although the simplicity, sensitivity, and availability of its instrument, only one fluorimetric method for determination of the studied drug has been reported. So the prescribed work aimed to establish a new, reproducible, and easy-implementable methodology for the routine analysis of pharmaceutical dosage forms of CS and its prodrug CMS in quality control laboratories. Moreover, to make a unique value to our work, content uniformity testing was highly recommended and successfully applied.
Conflicts of interest
There are no conflits to declare.References
- S. Biswas, J. M. Brunel, J. C. Dubus, M. Reynaud-Gaubert and J. M. Rolain, Expert Rev. Anti-Infect. Ther., 2012, 10, 917–934 CrossRef CAS PubMed.
- M. E. Falagas and S. K. Kasiakou, Clin. Infect. Dis., 2005, 40, 1333–1341 CrossRef CAS PubMed.
- J. Li, R. L. Nation, J. D. Turnidge, R. W. Milne, K. Coulthard, C. R. Rayner and D. L. Paterson, Lancet Infect. Dis., 2006, 6, 589–601 CrossRef CAS PubMed.
- S. Yainoy, M. Hiranphan, T. Phuadraksa, W. Eiamphungporn, S. Tiengrim and V. Thamlikitkul, Diagn. Microbiol. Infect. Dis., 2018, 92, 102–106 CrossRef CAS PubMed.
- O. H. Albadawy, A. M. Nafee, M. M. Thabet, M. S. El-Rehewy and A. S. Ahmed, Bull. Pharm. Sci., 2013, 36, 93–103 CAS.
- M. Wootton, H. A. Holt and A. P. Macgowan, Eur. Soc. Clin. Infect. Dis., 2005, 11, 243–244 CAS.
- H. Ahmed, F. Elbarbry and B. Clark, Am. J. Anal. Chem., 2012, 03, 233–241 CrossRef CAS.
- M. Mutasim Elimam, S. Wagiealla Shantier, E. Ahmed Gadkariem and M. Awadalla Mohamed, J. Chem., 2015, 2015, 1–10 CrossRef.
- K. M. Badr El-Din, M. A. Abdelmajed, M. A. Omar and T. Z. Attia, Luminescence, 2021, 36, 1249–1256 CrossRef CAS PubMed.
- B. Qi, M. Gijsen, P. Van Brantegem, T. De Vocht, N. Deferm, G. B. Abza, N. Nauwelaerts, J. Wauters, I. Spriet and P. Annaert, Drug Test. Anal., 2020, 12, 1183–1195 CrossRef CAS PubMed.
- K. M. Matar and B. Al-Refai, Sci. Rep., 2020, 10, 1–15 CrossRef PubMed.
- S. Barco, E. Castagnola, A. Mesini, G. Tripodi and G. Cangemi, J. Pharm. Biomed. Anal., 2019, 170, 193–195 CrossRef CAS PubMed.
- M. Zhao, Y. R. Cao, B. N. Guo, X. J. Wu, J. Li and J. Zhang, J. Antibiot., 2014, 67, 825–829 CrossRef CAS PubMed.
- Y. Dotsikas, C. K. Markopoulou, J. E. Koundourellis and Y. L. Loukas, J. Sep. Sci., 2011, 34, 37–45 CrossRef CAS PubMed.
- P. Gobin, F. Lemaître, S. Marchand, W. Couet and J. C. Olivier, Antimicrob. Agents Chemother., 2010, 54, 1941–1948 CrossRef CAS PubMed.
- H. Yuan, S. Yu, G. Chai, J. Liu and Q. Zhou, J. Pharm. Anal., 2021, 11, 732–738 CrossRef PubMed.
- Y. Hanai, K. Matsuo, T. Kosugi, A. Kusano, H. Ohashi, I. Kimura, S. Hirayama, Y. Nanjo, Y. Ishii, T. Sato, T. Miyazaki, K. Nishizawa and T. Yoshio, Journal of Pharmaceutical Health Care and Sciences, 2018, 4, 1–9 CrossRef PubMed.
- A. R. Pinho, M. J. Rocha, G. Alves, A. C. Falcão and A. C. Fortuna, Anal. Methods, 2018, 10, 389–396 RSC.
- S. Ouchi, K. Matsumoto, M. Okubo, Y. Yokoyama and J. Kizu, Biomed. Chromatogr., 2018, 32, e4167 CrossRef PubMed.
- D. Chepyala, I. L. Tsai, H. Y. Sun, S. W. Lin and C. H. Kuo, J. Chromatogr. B: Anal. Technol. Biomed. Life Sci., 2015, 980, 48–54 CrossRef CAS PubMed.
- J. Li, R. W. Milne, R. L. Nation, J. D. Turnidge, K. Coulthard and J. Valentine, Antimicrob. Agents Chemother., 2002, 46, 3304–3307 CrossRef CAS PubMed.
- M. Rockville, The United States Pharmacopoeia 30, The National Formulary 25, US Pharmacopeial Convention, Electronic version, 2007, pp. 2287–2288. Search PubMed.
- M. A. Abdel-Lateef and A. Almahri, Chem. Pap., 2022, 76, 741–748 CrossRef CAS.
- E. F. Anwer, D. A. M. Nour El-Deen and M. A. Omar, Luminescence, 2021, 36, 1327–1334 CrossRef CAS PubMed.
- M. F. B. Ali, B. I. Salman, S. A. Hussein and M. A. Marzouq, Luminescence, 2020, 35, 1118–1124 CrossRef CAS PubMed.
- M. A. Omar, D. M. Nagy and M. E. Halim, Luminescence, 2018, 33, 1107–1112 CrossRef CAS PubMed.
- ICH Harmonized Tripartite Guideline, Validation of Analytical Procedures: Text and Methodology Q2 (R1), Geneva, 2005, available at: https://www.ich.org/leadmin/Public_Web_Site/ICH_Products/Guidelines/Quality/Q2_R1/Step4/Q2_R1__Guideline.pdf, accessed 27 April, 2018 Search PubMed.
| This journal is © The Royal Society of Chemistry 2022 |

