 Open Access Article
A novel fluorescent probe of alkyne compounds for putrescine detection based on click reaction†
Fanning Kong a,
Yilin Mua,
Xian Zhang
 *a,
Qian Lu*a,
Zhizhou Yang
 a,
Jinshui Yao
 a and
Liyun Zhaob
aSchool of Materials Science and Engineering, Qilu University of Technology (Shandong Academy of Sciences), Jinan 250353, China
bKey Laboratory of Plant Resources Conservation and Sustainable Utilization, Guangdong Provincial Key Laboratory of Applied Botany, South China Botanical Garden, Chinese Academy of Sciences, Guangzhou, 510650, China. E-mail: zhangx@qlu.edu.cn; qluqlu@qlu.edu.cn; Tel: +86-0531-89631227
First published on 20th September 2022
Abstract
Putrescine is a toxic biogenic amine produced in the process of food spoilage, and a high concentration of biogenic amines in foods will cause health problems such as abnormal blood pressure, headaches and tachycardia asthma/worsening asthma. The detection of putrescine is necessary. However, traditional putrescine detection requires specialized instruments and complex operations. To detect putrescine quickly, sensitively and accurately, we designed and successfully prepared a fluorescent probe (DPY) with active alkynyl groups. DPY takes p-dimethoxybenzene as the raw material, adding a highly active alkyne group. It is stable in experimental pH (∼7) because the UV-vis absorption and fluorescence emission spectra in pH = 3–12 have little change. The fluorescence intensity of DPY decreased only about 1% under the irradiation of 420 nm within 2 h, showing its better photostability. DPY has a high selectivity to putrescine because of the amino–alkyne click reaction without any catalyst in presence of different biogenic amines. The obvious response to putrescine was found in 30 seconds at room temperature. The mechanism between DPY and putrescine was investigated before and after adding putrescine by 1H NMR spectra and the Job plot. The results indicated a typical 1![[thin space (1/6-em)]](https://www.rsc.org/images/entities/char_2009.gif) :
:![[thin space (1/6-em)]](https://www.rsc.org/images/entities/char_2009.gif) 1 stoichiometry between the DPY and DAB. Furthermore, the higher sensitivity of DPY to putrescine was obtained with the detection of limit (LOD) of 3.19 × 10⁻⁷ mol L−1, which was better than that of the national standard (2.27 × 10⁻⁵ mol L−1). The novel fluorescent probe was successfully applied to beer samples to detect putrescine. The proposed strategy is expected to provide some guidance for the development of some new ways to detect food security.
1 stoichiometry between the DPY and DAB. Furthermore, the higher sensitivity of DPY to putrescine was obtained with the detection of limit (LOD) of 3.19 × 10⁻⁷ mol L−1, which was better than that of the national standard (2.27 × 10⁻⁵ mol L−1). The novel fluorescent probe was successfully applied to beer samples to detect putrescine. The proposed strategy is expected to provide some guidance for the development of some new ways to detect food security.
1 Introduction
Biogenic amines (BAs) are nitrogen-containing, aliphatic or hetero-cyclic, low molecular weight compounds.1 Putrescine (DAB) is an important component of biogenic amines, an essential component of all living organisms and tissues.2,3 Usually, putrescine is formed during the food processing/storage stages due to the bacterial activities.4,5 High concentration of biogenic amines was observed in processed foods such as fish, wine, beer, meat products and in fermented foods.6–9 High concentrations of putrescine can easily enter the body through ingestion, inhalation, or skin absorption, causing serious health hazards such as food poisoning, respiratory damage, gastrointestinal damage, abnormal blood pressure, headaches, and tachycardia asthma/asthma exacerbation.10–12 In view of this, monitoring of putrescine levels in foodstuffs has attracted great attention in food safety. Therefore, it is crucial to efficiently detect putrescine for food safety.13 Conventional putrescine detection methods include high-performance liquid chromatography (HPLC),14 mass spectrometry,15 capillary electrophoresis (CE),16 thin-layer chromatography (TLC),17 and electronic nose technology.18 However, these methods are not suitable for in situ detection because they require expensive instrument support and professional, complex, and technical operations.19Among the developed analytical methods, optical detection is simple, cost-effective and can be employed for on-site applications.20,21 A number of optical methodologies have been developed for sensing of biogenic amines in gaseous or in solution phase.22 Giribabu et al. demonstrated a ninhydrin colorimetric method for the quantitative detection of aliphatic biogenic amines, putrescine, and cadaverine. However, this detection method is only faster at 80 °C.23 Khuhawar et al. used sodium lauryl sulfate to protect silver nanoparticles, allowing silver nanoparticles to interact with putrescine and cadaverine, and established a quantitative detection method for putrescine and cadaverine.24 Sathiyanarayanan et al. developed a new donor–acceptor (D–A) type ratiometric and colorimetric sensor using a pyridine ring and biphenyl dicyandiethylene as the donor and acceptor, respectively, which can selectively and efficiently identify biogenic primary amines.25
However, most fluorescence sensors need specific conditions such as high temperature or catalyst, which limits the fluorescence sensors in the detection of putrescine.26 Fortunately, Kolb et al. discovered a new organic chemistry strategy, click chemistry, which revitalized the old way of organic synthesis.27 Then Qin et al. used CuCl to catalyze the activation of internal alkynes and aromatic amines, and successfully developed a simple and efficient Cu(I)-catalyzed amino–alkyne click polymerization.28 Amino–alkyne click polymerization could be applied to the detection of putrescine, but the unstable catalyst Cu(I) is easily oxidized, resulting in rapid detection being difficult to achieve. The long reaction time greatly limited the application of this method in the field of rapid and convenient detection. Therefore, improving the activity of the reactants and developing a reaction process that does not require catalysts has become the key to solving the problem.
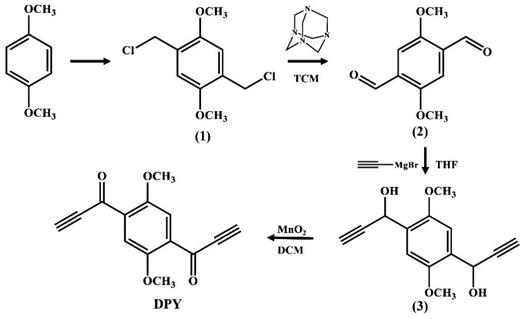
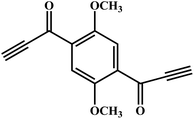
An novel fluorescent compound (1,1′-(2,5-dimethoxy-1,4-phenylene)bis(prop-2-yn-1-one), DPY) was designed. The introduction of a methoxy group on the benzene ring could enhance the electron donating ability to obtain a longer emission wavelength. Using p-dimethoxybenzene as the starting material, a more active alkynyl group was introduced into the fluorophore, which was further activated with a carbonyl group to get DPY (Fig. 1). The highly reactive alkynyl group in DPY can undergo a spontaneous click reaction with the amino group of putrescine at room temperature without any catalyst, enabling selective recognition of putrescine (Scheme 1). DPY can detect putrescine in only 30 s, and is currently the fastest fluorescent probe for putrescine. As a reactive fluorescent probe with a new structure, DPY will provide a new idea for the detection of putrescine.
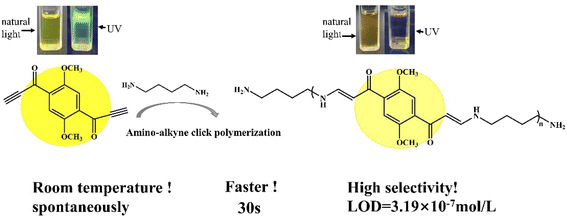 | ||
| Scheme 1 Sensing mechanism of putrescine (DAB) to DPY (the upper inset shows the change of DPY under natural light and 365 nm UV light before and after the addition of DAB). | ||
2 Experimental
2.1 Materials and methods
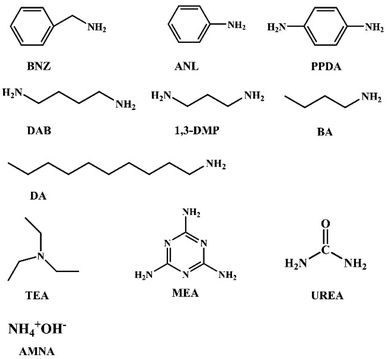
The used solvents including methanol (MeOH), ethanol (EtOH), acetonitrile (MeCN), tetrahydrofuran (THF), dichloromethane (DCM), N,N-dimethylformamide (DMF), ethyl acetate (EA), and dimethyl sulfoxide (DMSO) were analytical grade and from commercial suppliers. Among them, THF needed to be added sodium metal and distilled to remove water. The stock solution of DPY with a concentration of 1 × 10⁻³ mol L−1 was prepared in DMSO, and then was diluted to the concentration of 1 × 10⁻⁵ mol L−1 with the above solvents before testing. Eleven kinds of amine stock solutions of benzylamine (BNZ), aniline (ANL), triethylamine (TEA), p-phenylenediamine (PPDA), putrescine (DAB), ammonia (AMNA), melamine (MEA), UREA (UREA), 1,3-propylene diamine (1,3-DMP), 1-butylamine (BA), decylamine (DA) were prepared with a concentration of 1 × 10⁻² mol L−1.2.2. Instruments
1H NMR and 13C NMR spectra were measured on a Bruker Avance 400 and 600 spectrometer with TMS internal standard as a reference. Infrared spectra were obtained by a Thermo Scientific Nicolet IS10 Spectrometer. The ultraviolet visible (UV-vis) near IR absorption spectra were measured on a UV-2500 spectrophotometer. Fluorescence spectra were measured with HITRCHI F-7000 fluorescence spectrophotometer, and the voltage and the slit are 400 V and 5 nm, respectively. The fluorescence quantum yields were measured by the FLS1000 steady-state transient fluorescence spectrometer and integrating sphere.2.3 Synthesis of DPY
The specific synthesis steps and characterization of compounds 1, 2 and 3 in Scheme 1 were presented in the ESI† (Scheme S1–S3†). The schematic diagram of the synthetic experimental device is shown in Fig. S1.† The relative spectral data (1H NMR, 13C NMR and FT-IR) are showed in Fig. S2–S10.†![[thin space (1/6-em)]](https://www.rsc.org/images/entities/char_2009.gif) :
:![[thin space (1/6-em)]](https://www.rsc.org/images/entities/char_2009.gif) petroleum ether = 1
petroleum ether = 1![[thin space (1/6-em)]](https://www.rsc.org/images/entities/char_2009.gif) :
:![[thin space (1/6-em)]](https://www.rsc.org/images/entities/char_2009.gif) 1 = v
1 = v![[thin space (1/6-em)]](https://www.rsc.org/images/entities/char_2009.gif) :
:![[thin space (1/6-em)]](https://www.rsc.org/images/entities/char_2009.gif) v as the elution. Yellow powder was obtained with a yield of 48%. 1H NMR (400 MHz, CDCl3) δ (ppm): 7.57 (s, 2H), 3.95 (s, 6H), 1.56 (s, 2H). 13C NMR (400 MHz, DMSO) δ 56.42, 82.17, 85.18, 114.88, 130.29, 152.19, 175.32. IR (KBr, cm−1): 3234 (C–H), 2962 (C–H), 2090 (C
v as the elution. Yellow powder was obtained with a yield of 48%. 1H NMR (400 MHz, CDCl3) δ (ppm): 7.57 (s, 2H), 3.95 (s, 6H), 1.56 (s, 2H). 13C NMR (400 MHz, DMSO) δ 56.42, 82.17, 85.18, 114.88, 130.29, 152.19, 175.32. IR (KBr, cm−1): 3234 (C–H), 2962 (C–H), 2090 (C![[triple bond, length as m-dash]](https://www.rsc.org/images/entities/char_e002.gif) C), 1656 (C
C), 1656 (C![[double bond, length as m-dash]](https://www.rsc.org/images/entities/char_e001.gif) O), 1203 (C–O), 1488 (C
O), 1203 (C–O), 1488 (C![[double bond, length as m-dash]](https://www.rsc.org/images/entities/char_e001.gif) C). m. p.: 186.4 °C. Calcd for C14H10O4 (%): C, 69.42; H, 4.13; O, 26.45. Found C, 69.51; H, 4.06; O, 26.43.
C). m. p.: 186.4 °C. Calcd for C14H10O4 (%): C, 69.42; H, 4.13; O, 26.45. Found C, 69.51; H, 4.06; O, 26.43.2.4. Study on sensitivity of DPY to DAB
The solutions with different concentrations of DPY and DAB was prepared and tested. The sensitivity of DPY to DAB was analyzed by fluorescence spectrometry, and the limit of detection (LOD) of amine was calculated.3 Results and discussion
3.1. Material design and chemical structure
Spontaneous amino–alkyne bond polymerization has been a research hot topic since it was firstly reported by Tang in 2017.28 After the painstaking work of countless predecessors, methods were developed to regio-/stereoregular nitrogencontaining polymers by simply mixing alkynes with amines at room temperature without any catalyst. As is known to all, and alkynes are essential groups in the preparation of conjugated polymers and carbon-rich materials. Electrophilic reactivity of alkynes can be enhanced by the presence of electron receptors conjugated to the triple bond. Therefore, we chose 1,4-dimethoxy benzene as the starting material to oxidize the hydroxyl group adjacent to the alkyne group into carbonyl group to form carbonyl activated alkyne, so that the material has higher activity and stability. In the nuclear magnetic hydrogen spectrum of the compound 3, the hydroxyl group is oxidized to carbonyl group, which result the hydrogen in the benzene ring moving to the lower field and the chemical shifting from 7.36 ppm to 7.53 ppm. Meanwhile, compound 3 has five kinds of hydrogens (methoxy, alkynyl, hydroxyl, methylene, benzene ring) (Fig. S4†), and the hydroxyl in it is oxidized to carbonyl, so the 1H NMR spectrum of DPY shows only three kinds of hydrogens (methoxy, alkynyl, benzene ring) in Fig. S5.† All of these proved that DPY has been synthesized successfully.3.2. Optical properties of DPY in different solvents
Diluting the DPY stock solution in DMSO with a concentration of 10−2 mol L−1 into different solvents, and the final concentration of the dilution solution is 10−5 mol L−1, then the UV-vis absorption and fluorescence spectra are tested after stabilizing for 10 min. As shown in Fig. 2A, DPY has two obvious UV absorption peaks at around 275 nm and 400 nm respectively, which is mainly attributed to the π–π* and n–π* transition from the benzene ring, alkyne and the unsaturated bond (C![[double bond, length as m-dash]](https://www.rsc.org/images/entities/char_e001.gif) O) of DPY. As can be seen in Table 1, most solvents have little effect on the UV-vis absorption spectra of DPY and with little change in the maximum absorption wavelength and absorbance. The slightly red-shifts occur at that maximum absorption wavelength in DCM and water. The absorbance decreased obviously in water. The interaction of hydroxyl groups in water led to torsion of the molecular plane of the compound, which weakened the energy conduction in the compound and reduced the absorbance.29 In the organic solvent, the solubility and dispersion of the compounds will be improved, so that the compounds in the organic solvent are dispersed more evenly than that of in water, which is beneficial to inter-molecular energy transfer and higher absorbance. In order to more clearly learn the solubility of DPY, we prepared its solutions with concentrations of 0.1 μM, 1 μM, 10 μM and 100 μM in water, and tested their ultraviolet absorption spectra and fluorescence emission spectra. As shown in the following Fig. S11,† the relative absorbance values of DPY increased with concentration. The fluorescence intensity enhanced with the increased concentration. At the same time, the illustrations of DPY solutions at different concentrations are clear and transparent, so DPY is completely dissolved at the experimental concentration of 10−5 mol L−1. The absorption spectrum of DPY, and the maximum absorption peak showed a significant blue-shift and the absorbance was significantly increased in DMF. It might be due to the N atom of DMF affecting DPY, which led to the significant changes in the absorption spectrum. Considering the longer wavelength fluorescence will be benefit to be observed, the fluorescence emission spectra were obtained at the excitation wavelength of 420 nm. The maximum emission wavelength and fluorescence intensity of DPY in different solvents were listed in Table 1. In Fig. 2B that the fluorescence intensity in DMF and water was the lowest, which may be due to the strong polarity of the solvent. The solute–solvent interaction was relatively strong in the polar solvent. The excited state in the relaxed state was more stable by the microenvironment than that of the ground state. The excited-state energy level of the luminescent molecule decreases, making the gap between energy levels decrease. This had a significant effect on the charge, and it redistributed between the ground state and the excited state of the fluorescent molecule. This increased the energy loss between the two stages and the nonradiative transition and resulted in the decrease of the fluorescence intensity and the shift of the fluorescence spectrum to the longer wavelength. On the other hand, water is a poor solvent for DPY, which will lead to the molecules more easily to aggregate and result in the fluorescence quenching. The N atom in the DMF molecule may have some influence on DPY, resulting in a significant quenching of the fluorescence.30 In MeOH and EtOH, the fluorescence intensity of DPY was also significantly lower than that of other solvents, and the reason was that the energy loss generated by fluorescence emission which would be further increased due to the hydrogen bonds between the solute and the solvent in the polar protic solvent. This resulted in the fluorescence intensity decrease and a red-shift in the emission spectrum. Although the fluorescence intensity of DPY in DCM and MeCN was higher than that in DMSO, considering the low boiling point of DCM and MeCN, and the Stokes shift of DPY in DMSO was larger than that in DCM and MeCN. Moreover, the fluorescence quantum yield is also the highest, so DMSO was used as the solvent for subsequent tests.
O) of DPY. As can be seen in Table 1, most solvents have little effect on the UV-vis absorption spectra of DPY and with little change in the maximum absorption wavelength and absorbance. The slightly red-shifts occur at that maximum absorption wavelength in DCM and water. The absorbance decreased obviously in water. The interaction of hydroxyl groups in water led to torsion of the molecular plane of the compound, which weakened the energy conduction in the compound and reduced the absorbance.29 In the organic solvent, the solubility and dispersion of the compounds will be improved, so that the compounds in the organic solvent are dispersed more evenly than that of in water, which is beneficial to inter-molecular energy transfer and higher absorbance. In order to more clearly learn the solubility of DPY, we prepared its solutions with concentrations of 0.1 μM, 1 μM, 10 μM and 100 μM in water, and tested their ultraviolet absorption spectra and fluorescence emission spectra. As shown in the following Fig. S11,† the relative absorbance values of DPY increased with concentration. The fluorescence intensity enhanced with the increased concentration. At the same time, the illustrations of DPY solutions at different concentrations are clear and transparent, so DPY is completely dissolved at the experimental concentration of 10−5 mol L−1. The absorption spectrum of DPY, and the maximum absorption peak showed a significant blue-shift and the absorbance was significantly increased in DMF. It might be due to the N atom of DMF affecting DPY, which led to the significant changes in the absorption spectrum. Considering the longer wavelength fluorescence will be benefit to be observed, the fluorescence emission spectra were obtained at the excitation wavelength of 420 nm. The maximum emission wavelength and fluorescence intensity of DPY in different solvents were listed in Table 1. In Fig. 2B that the fluorescence intensity in DMF and water was the lowest, which may be due to the strong polarity of the solvent. The solute–solvent interaction was relatively strong in the polar solvent. The excited state in the relaxed state was more stable by the microenvironment than that of the ground state. The excited-state energy level of the luminescent molecule decreases, making the gap between energy levels decrease. This had a significant effect on the charge, and it redistributed between the ground state and the excited state of the fluorescent molecule. This increased the energy loss between the two stages and the nonradiative transition and resulted in the decrease of the fluorescence intensity and the shift of the fluorescence spectrum to the longer wavelength. On the other hand, water is a poor solvent for DPY, which will lead to the molecules more easily to aggregate and result in the fluorescence quenching. The N atom in the DMF molecule may have some influence on DPY, resulting in a significant quenching of the fluorescence.30 In MeOH and EtOH, the fluorescence intensity of DPY was also significantly lower than that of other solvents, and the reason was that the energy loss generated by fluorescence emission which would be further increased due to the hydrogen bonds between the solute and the solvent in the polar protic solvent. This resulted in the fluorescence intensity decrease and a red-shift in the emission spectrum. Although the fluorescence intensity of DPY in DCM and MeCN was higher than that in DMSO, considering the low boiling point of DCM and MeCN, and the Stokes shift of DPY in DMSO was larger than that in DCM and MeCN. Moreover, the fluorescence quantum yield is also the highest, so DMSO was used as the solvent for subsequent tests.
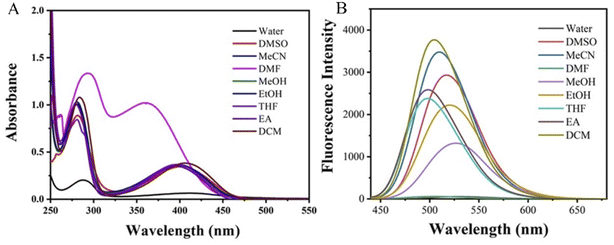 | ||
| Fig. 2 UV-vis absorption spectra (A) and fluorescence emission spectra (B) of DPY in different solvents. | ||
| Solvents | λmaxa (nm) | ε (L mol−1 cm−1) | λmaxe (nm) | Imax | Stokes shift | Quantum yield (%) |
|---|---|---|---|---|---|---|
| a In the table, λmaxa was the maximum absorption wavelength, ε was the molar absorption coefficient of DPY, λmaxe was the maximum emission wavelength, and Imax was the maximum fluorescence intensity. | ||||||
| H2O | 412 | 14![[thin space (1/6-em)]](https://www.rsc.org/images/entities/char_2009.gif) 800 800 |
528.6 | 53.77 | 116.6 | 10.23 |
| DMSO | 402 | 34![[thin space (1/6-em)]](https://www.rsc.org/images/entities/char_2009.gif) 600 600 |
518 | 2933 | 116 | 27.29 |
| MeCN | 399 | 36![[thin space (1/6-em)]](https://www.rsc.org/images/entities/char_2009.gif) 700 700 |
510.8 | 3478 | 111.8 | 19.58 |
| DMF | 359 | 102![[thin space (1/6-em)]](https://www.rsc.org/images/entities/char_2009.gif) 100 100 |
526 | 1320 | 167 | 15.75 |
| MeOH | 401 | 35![[thin space (1/6-em)]](https://www.rsc.org/images/entities/char_2009.gif) 500 500 |
498 | 2380 | 97 | 21.38 |
| EtOH | 396 | 36![[thin space (1/6-em)]](https://www.rsc.org/images/entities/char_2009.gif) 200 200 |
519.5 | 2221 | 123.5 | 24.62 |
| THF | 394 | 35![[thin space (1/6-em)]](https://www.rsc.org/images/entities/char_2009.gif) 700 700 |
498 | 2380 | 104 | 25.36 |
| EA | 397 | 36![[thin space (1/6-em)]](https://www.rsc.org/images/entities/char_2009.gif) 900 900 |
499 | 2586 | 102 | 18.46 |
| DCM | 406 | 38![[thin space (1/6-em)]](https://www.rsc.org/images/entities/char_2009.gif) 300 300 |
503.8 | 3768 | 97.8 | 20.18 |
In order to explore the pH effect and photostability of DPY, the solutions of DPY in water with a concentration of 1 × 10 −5 mol L−1 and the pH of 1–14 were measured showed in Fig. 3A and B. The UV-vis absorption spectra in Fig. 3A showed that pH values have a little effect. An obvious blue-shift at 400 nm was found at pH = 14. The possible reason may be that the strong alkaline promoted some action of carbonyl group (C![[double bond, length as m-dash]](https://www.rsc.org/images/entities/char_e001.gif) O).31 The fluorescence intensity in Fig. 3B decreased significantly in the strong acid (pH = 1, 2) or alkali (pH = 13, 14) environment, which can be attributed to the structure adjustment of the DPY by extreme environments. While the UV-vis absorption and fluorescence spectra are both stable under the experimental pH (3–12) in this paper. Furthermore, the photostability of DPY in DMSO was investigated. Irradiated at 420 nm, the fluorescence intensity of DPY decreased by only about 1% (from 4556 to 4523) within 120 min in Fig. 3C, which proved the excellent photostability of DPY.
O).31 The fluorescence intensity in Fig. 3B decreased significantly in the strong acid (pH = 1, 2) or alkali (pH = 13, 14) environment, which can be attributed to the structure adjustment of the DPY by extreme environments. While the UV-vis absorption and fluorescence spectra are both stable under the experimental pH (3–12) in this paper. Furthermore, the photostability of DPY in DMSO was investigated. Irradiated at 420 nm, the fluorescence intensity of DPY decreased by only about 1% (from 4556 to 4523) within 120 min in Fig. 3C, which proved the excellent photostability of DPY.
 | ||
| Fig. 3 Ultraviolet absorption spectra (A) and fluorescence emission spectra (B) of DPY in water with different pH; the photostability of DPY in DMSO under the irradiation of 420 nm within 2 h (C). | ||
3.3. Fluorescence detection of DPY to DAB
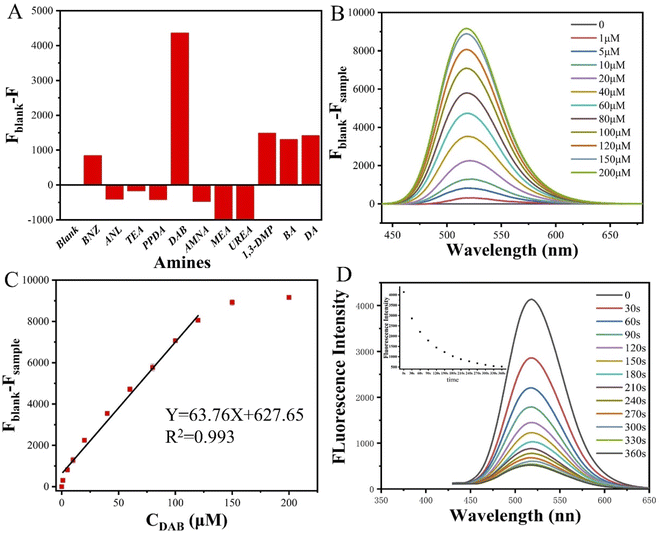
For detecting the selectivity of DPY to DAB, several of aromatic amines, fatty amines and heterocyclic amines were selected with a concentration of 1 × 10⁻⁵ mol L−1. To explore the response performance of DPY to inorganic amines in daily life, AMAN was selected for testing. All the structures involved in the detection of amines are shown in Fig. 4. After adding different amines for 10 minutes, the fluorescence spectra did not show red-shift or blue-shift, but the fluorescence intensity changed more or less (Fig. S12†). The maximum emission wavelength of DPY is at 518 nm. The fluorescence intensity of DPY decreases after adding BNZ, 1,3-DMP, BA, DA and DAB. The decreased percentage were 16.4%, 29%, 25.5%, 27.6% and 85%, respectively in Fig. 5A. The activity of the amino group in BNZ is weaker than that of DAB because it is linked to the aryl group. 1,3-DMP, BA, DA can quench DPY to a certain extent because of its similar structure to DAB. The fluorescence intensity increased slightly after the addition of ANL, TEA, PPDA, AMNA, MEA and UREA, because the structure of these amines makes it difficult for the amino groups to react with DPY.32 Compared with the other amines (Fig. 5a), the fluorescence of DPY after the addition of DAB showed a significant decrease, indicating that DAB had a great influence on the fluorescence emission spectra of DPY. The above results indicated that DPY had a relatively obvious selectivity to DAB.3.4. Sensitivity of DPY to DAB
The stock solution of DPY with a concentration of 1 × 10⁻² mol L−1 and the stock solution of DAB with a concentration of 1 × 10⁻³ mol L−1 were prepared in DMSO, and different volumes of DPY solution and DAB solution were taken, mixed and made uniform. The concentration of DPY solution was diluted to 1 × 10⁻⁴ mol L−1, then different concentration of DAB (0, 1 × 10⁻⁶, 5 × 10⁻⁶, 1 × 10⁻⁵, 2 × 10⁻⁵, 4 × 10⁻⁵, 6 × 10⁻⁵, 8 × 10⁻⁵, 1 × 10⁻⁴, 1.5 × 10⁻⁴, and 2 × 10⁻⁴ mol L−1) were added.As shown in Fig. 5A, DPY showed strong fluorescence before adding DAB, and the maximum emission wavelength was at 518 nm. No red-shift or blue-shift was found after DAB was added. With the increase of DAB concentration, the fluorescence intensity decreases gradually. When the concentration of DAB reached 2 × 10⁻⁴ mol L−1, the fluorescence intensity decreased about 48 times in comparison to that of pure DPY. In Fig. 5B and C, the fluorescence intensity of DPY had been decreasing after the addition of DAB. When the concentration of DAB was higher than 1.2 × 10⁻⁴ mol L−1, the fluorescence intensity decreases slowly and gradually become stable. In the concentration range from 1 × 10⁻⁶ to 1.2 × 10⁻⁴ mol L−1, a linear correlation with respect to the putrescine concentration and the fluorescence intensity has been observed. On the whole, the fluorescence intensity of DPY changed obviously after adding DAB, and it showed good sensitivity to DAB, which can be applied to the detection of DAB in actual samples.
A practical fluorescent probe should not only have good selectivity and sensitivity, but also be suitable for the detection of actual samples. In Fig. 5C, the experiment was repeated 3 times with error correction. Linear fitting was performed to obtain the fitting constant R2 of 0.993, and the linear fitting equation was as follows:
| Y = 63.76X + 627.65(R2 = 0.993) | (1) |
According to the LOD calculation formula:33
| LOD = 3σ/slope | (2) |
The LOD of DAB is 3.19 × 10⁻⁷ mol L−1, which is better than those of many reported putrescine probes (Table 2).24,34–36 In the national food safety standard, the detection limit of DAB in wine and vinegar is about 5.7 × 10⁻⁵ mol L−1, so it can be applied to the detection of actual samples.
The existence of carbonyl-activated alkyne in DPY supplies a chance for click-reaction with DAB at room temperature without catalyst, which led to the fluorescence intensity of DPY decrease. In order to explore the respond speed, DPY (10−5 mol L−1) and DAB (10−5 mol L−1) were mixed, and tested the change of fluorescence intensity after only a slight shaking at an interval of 30 s.The fluorescence intensity decreased significantly after adding DAB at 30 s, and the quenching degree reached 31.6% in Fig. 5D. The fluorescence intensity obviously decreased in 0–120 s, and the quenching degree reached 65.1%. At 300 s, the fluorescence intensity decreased to the lowest, and the fluorescence quenching degree reached 87.2%. Obviously, DPY can be used as a fluorescence probe to detect putrescine accurately and rapidly.
3.5. Mechanism research
The detection mechanism of DPY to DAB was intuitively explored by means of 1H NMR titration. After adding DAB (2.47 mmol) to DPY (2.47 mmol) for 30 min in DMSO, the proton signals of C![[double bond, length as m-dash]](https://www.rsc.org/images/entities/char_e001.gif) C was converted from alkynyl at 5.62 ppm and 7.21 ppm can be found in the 1H NMR spectrum in Fig. 6C in comparison to that in Fig. 6A and B. When the DPY containing electron-deficient alkynyl ketones was used as the electrophilic reagent, the DAB attacked the carbon atom of alkynyl and underwent nucleophilic addition reaction to obtain the carbon–carbon double bond, which formed a new compound and led to the decrease of fluorescence intensity. The possible binding mode of DAB and DPY was studied by fluorescence spectroscopy. The total concentration of DPY and DAB was a constant (1 × 10 −5 mol L−1). As shown in Fig. S13,† fluorescence intensities were obtained at variable molar fraction of [DAB] to [DPY + DAB] (1
C was converted from alkynyl at 5.62 ppm and 7.21 ppm can be found in the 1H NMR spectrum in Fig. 6C in comparison to that in Fig. 6A and B. When the DPY containing electron-deficient alkynyl ketones was used as the electrophilic reagent, the DAB attacked the carbon atom of alkynyl and underwent nucleophilic addition reaction to obtain the carbon–carbon double bond, which formed a new compound and led to the decrease of fluorescence intensity. The possible binding mode of DAB and DPY was studied by fluorescence spectroscopy. The total concentration of DPY and DAB was a constant (1 × 10 −5 mol L−1). As shown in Fig. S13,† fluorescence intensities were obtained at variable molar fraction of [DAB] to [DPY + DAB] (1![[thin space (1/6-em)]](https://www.rsc.org/images/entities/char_2009.gif) :
:![[thin space (1/6-em)]](https://www.rsc.org/images/entities/char_2009.gif) 9; 2
9; 2![[thin space (1/6-em)]](https://www.rsc.org/images/entities/char_2009.gif) :
:![[thin space (1/6-em)]](https://www.rsc.org/images/entities/char_2009.gif) 8; 3
8; 3![[thin space (1/6-em)]](https://www.rsc.org/images/entities/char_2009.gif) :
:![[thin space (1/6-em)]](https://www.rsc.org/images/entities/char_2009.gif) 7; 4
7; 4![[thin space (1/6-em)]](https://www.rsc.org/images/entities/char_2009.gif) :
:![[thin space (1/6-em)]](https://www.rsc.org/images/entities/char_2009.gif) 6; 5
6; 5![[thin space (1/6-em)]](https://www.rsc.org/images/entities/char_2009.gif) :
:![[thin space (1/6-em)]](https://www.rsc.org/images/entities/char_2009.gif) 5; 6
5; 6![[thin space (1/6-em)]](https://www.rsc.org/images/entities/char_2009.gif) :
:![[thin space (1/6-em)]](https://www.rsc.org/images/entities/char_2009.gif) 4; 7
4; 7![[thin space (1/6-em)]](https://www.rsc.org/images/entities/char_2009.gif) :
:![[thin space (1/6-em)]](https://www.rsc.org/images/entities/char_2009.gif) 3; 8
3; 8![[thin space (1/6-em)]](https://www.rsc.org/images/entities/char_2009.gif) :
:![[thin space (1/6-em)]](https://www.rsc.org/images/entities/char_2009.gif) 2; 9
2; 9![[thin space (1/6-em)]](https://www.rsc.org/images/entities/char_2009.gif) :
:![[thin space (1/6-em)]](https://www.rsc.org/images/entities/char_2009.gif) 1). The fluorescence intensity of the system decreased with the adding DAB, and it is the lowest when the mole fraction was 1
1). The fluorescence intensity of the system decreased with the adding DAB, and it is the lowest when the mole fraction was 1![[thin space (1/6-em)]](https://www.rsc.org/images/entities/char_2009.gif) :
:![[thin space (1/6-em)]](https://www.rsc.org/images/entities/char_2009.gif) 1. The results indicated a typical 1
1. The results indicated a typical 1![[thin space (1/6-em)]](https://www.rsc.org/images/entities/char_2009.gif) :
:![[thin space (1/6-em)]](https://www.rsc.org/images/entities/char_2009.gif) 1 stoichiometry between the DPY and DAB. The molecular weight of production was tested by Gel Permeation Chromatography (GPC) (Mn = 6574 g mol −1; Mw = 13
1 stoichiometry between the DPY and DAB. The molecular weight of production was tested by Gel Permeation Chromatography (GPC) (Mn = 6574 g mol −1; Mw = 13![[thin space (1/6-em)]](https://www.rsc.org/images/entities/char_2009.gif) 486 g mol −1; Mz = 17
486 g mol −1; Mz = 17![[thin space (1/6-em)]](https://www.rsc.org/images/entities/char_2009.gif) 688 g mol −1; Mw/Mn = 2.05; Mz/Mw = 1.31). An increased concentration of the polymerized product may also result the fluorescence quenching. And aqueous environments may result the aggregation of product. In order to explore this, the fluorescence signals of reaction products were recorded in different ratios of DMSO/H2O mixed solvents. In Fig. S14†, the change of DMSO/H2O ratio had little effect on the fluorescence signal, which suggested that the reason of fluorescence quenching mainly comes from chemical structure but is independent of the increased concentration of the polymerized product. Although the structure of the amino group in BNZ is similar to that of DAB, the electron-donating property of the phenyl group makes the nucleophilic reaction between BNZ and DPY far less intense than that of DAB.37 Both BNZ and DAB can quench the fluorescence of DPY. As shown in Fig. 5A, the quenching degree of BNZ was much smaller than that of DAB, so DPY still has a good selectivity to DAB.
688 g mol −1; Mw/Mn = 2.05; Mz/Mw = 1.31). An increased concentration of the polymerized product may also result the fluorescence quenching. And aqueous environments may result the aggregation of product. In order to explore this, the fluorescence signals of reaction products were recorded in different ratios of DMSO/H2O mixed solvents. In Fig. S14†, the change of DMSO/H2O ratio had little effect on the fluorescence signal, which suggested that the reason of fluorescence quenching mainly comes from chemical structure but is independent of the increased concentration of the polymerized product. Although the structure of the amino group in BNZ is similar to that of DAB, the electron-donating property of the phenyl group makes the nucleophilic reaction between BNZ and DPY far less intense than that of DAB.37 Both BNZ and DAB can quench the fluorescence of DPY. As shown in Fig. 5A, the quenching degree of BNZ was much smaller than that of DAB, so DPY still has a good selectivity to DAB.
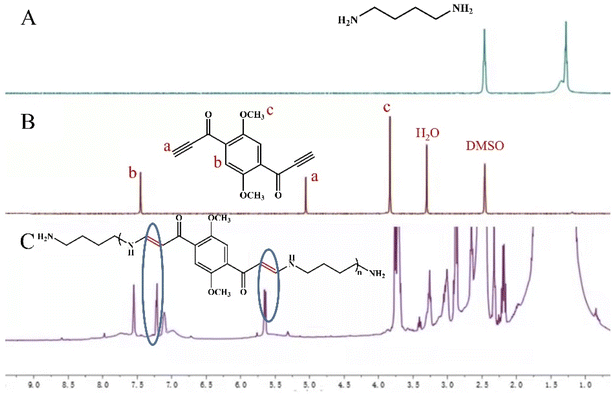 | ||
| Fig. 6 1H NMR spectra of (A) DAB, (B) DPY and (C) DAB added dropwise to DPY for 30 min in deuterated DMSO. | ||
3.6. Application in real samples
In order to further verify the application of this method in actual samples, beer samples were pretreated according to the national food safety standard of GB5009.208—2016. After simple pretreatment of beer samples, different amounts of DAB were added into several groups of treated beer samples, and the samples were detected by referring to the fluorescence spectrometry mentioned above. The results of the analytical tests are presented in Table 3. The spiked recoveries of the following three beer samples were 103.8%, 105.2%, and 108.6%, respectively, which could meet the test requirements of actual samples and thus could be applied to DAB detection of actual samples.| Sample | Amount added (μL) | Amount founded | Recovery (%) | R.S.D (%) |
|---|---|---|---|---|
| a R.S.D: relative standard deviation. The values were measured for three times and averaged. | ||||
| 1 | 30 | 31.57 | 105.2 | 5.2 |
| 2 | 57 | 59.14 | 103.8 | 3.8 |
| 3 | 70 | 76.03 | 108.6 | 8.6 |
4 Conclusion
In this article, a p-dimethoxybenzene-based compound (DPY) was designed and synthesized by introducing a highly reactive acetylene bond. The obtained DPY had displayed yellow-green light in DMSO under a 365 nm UV lamp. And the fluorescence spectra of DPY are affected by the polarity of the solvent and the heteroatoms in the solvent. The highly reactive acetylene bond of DPY could react with the amino group of DAB at room temperature and induce fluorescence quenching, which was different from traditional fluorescent probes. Therefore, highly selective detection of DAB could be achieved. Under the experimental pH and within irradiation times, the data showed that DPY is more stable. Under the optimal experimental conditions, the limit of detection of DAB was 3.19 × 10⁻⁷ mol L−1, which was superior to the national standard of China (GB5009.208-2016, 2 mg L−1, i.e. 2.27 × 10⁻⁵ mol L−1). The feasibility of the DPY probe in actual sample analysis was evaluated by testing different concentrations of DAB in beer. The good recovery about 105% was obtained. This DPY probe may supply further application advantages for the efficient detection of DAB to monitor the freshness of food. While DPY is expected to be developed for simple, rapid, and visual detection of putrescine, current detection limits are not comparable to some detection methods based on expensive, sophisticated instruments. Moreover, some portable small devices may be designed in combination with the probes in this manuscript to detect putrescine in future work, which will benefit from the new method with the advantages of portability, lower price and high efficiency. The proposal of DPY, that is the reaction between fluorescent probes and the analyte as a new detection mechanism, will provide broader ideas for subsequent researchers in food freshness detection.Data availability statement
The data used to support the findings of this study are available from the corresponding author upon request.Author contributions
Conceptualization, K.·F.; data curation, K. F., M. Y., Y. Z.; investigation, K. F., Y. J.; methodology, K. F., and Z. L.; writing-original draft, K. F.; writing-review & editing, Z. X. All authors have read and agreed to the published version of the manuscript.Funding
This research was funded by the National Natural Science Foundation of China (Grant No. NSFC 51![[thin space (1/6-em)]](https://www.rsc.org/images/entities/char_2009.gif) 403
403![[thin space (1/6-em)]](https://www.rsc.org/images/entities/char_2009.gif) 111), Shandong Provincial Natural Science Foundation (Grant No. ZR2020MB062) and Universities Twenty Foundational Items of Jinan City (Grant No. 2021GXRC097), the project supported by the Open Funds from Guangdong Provincial Key Laboratory of Applied Botany (Grant No. AB202105) and the Joint Research Foundation (Grant No. 2019BSHZ0013) for Young Doctorates of Qilu University of Technology (Shandong Academy of Sciences).
111), Shandong Provincial Natural Science Foundation (Grant No. ZR2020MB062) and Universities Twenty Foundational Items of Jinan City (Grant No. 2021GXRC097), the project supported by the Open Funds from Guangdong Provincial Key Laboratory of Applied Botany (Grant No. AB202105) and the Joint Research Foundation (Grant No. 2019BSHZ0013) for Young Doctorates of Qilu University of Technology (Shandong Academy of Sciences).
Conflicts of interest
There are no conflicts to declare.References
- Y.-j. Zhang, Y. Zhang, Y. Zhou, G.-h. Li, W.-z. Yang and X.-s. Feng, J. Chromatogr. A, 2019, 1605, 360361 CrossRef CAS PubMed.
- G. Zhang, A. S. Loch, J. C. Kistemaker, P. L. Burn and P. E. Shaw, J. Mater. Chem. C, 2020, 8, 13723–13732 RSC.
- M. S. Santos, Int. J. Food Microbiol., 1996, 29, 213–231 CrossRef CAS.
- G. Liu, W. Mo, X. Xu, X. Wu, G. Jia, H. Zhao, X. Chen, C. Wu and J. Wang, RSC Adv., 2019, 9, 19584–19595 RSC.
- E. Paleologos and M. Kontominas, Anal. Chem., 2004, 76, 1289–1294 CrossRef CAS.
- M. A. Alvarez and M. V. Moreno-Arribas, Trends Food Sci. Technol., 2014, 39, 146–155 CrossRef CAS.
- X. Qi, W.-F. Wang, J. Wang, J.-L. Yang and Y.-P. Shi, Food Chem., 2018, 259, 245–250 CrossRef CAS PubMed.
- R. Ke, Z. Wei, C. Bogdal, R. K. Göktaş and R. Xiao, Food Chem., 2018, 250, 268–275 CrossRef CAS.
- G. Drabik-Markiewicz, B. Dejaegher, E. De Mey, T. Kowalska, H. Paelinck and Y. Vander Heyden, Food Chem., 2011, 126, 1539–1545 CrossRef CAS PubMed.
- S. Farhadian, B. Shareghi, A. A. Saboury and M. Evini, RSC Adv., 2016, 6, 29264–29278 RSC.
- X. Zhong, D. Huo, H. Fa, X. Luo, Y. Wang, Y. Zhao and C. Hou, Sens. Actuators, B, 2018, 274, 464–471 CrossRef CAS.
- G. Suzzi and S. Torriani, Front. Microbiol., 2015, 472 Search PubMed.
- V. R. Heerthana and R. Preetha, Rev. Fish. Sci., 2019, 11, 220–233 Search PubMed.
- S. Sentellas, Ó. Núñez and J. Saurina, J. Food Chem, 2016, 64, 7667–7678 CrossRef CAS.
- W. Wojnowski, J. Namieśnik and J. Płotka-Wasylka, Microchem, 2019, 145, 130–138 CrossRef CAS.
- L. Du, Y. Lao, Y. Sasaki, X. Lyu, P. Gao, S. Wu, T. Minami and Y. Liu, RSC Adv., 2022, 12, 6803–6810 RSC.
- M. Latorre-Moratalla, S. Bover-Cid, T. Veciana-Nogués and M. Vidal-Carou, J. Chromatogr. A, 2009, 1216, 4128–4132 CrossRef CAS.
- M. Ghasemi-Varnamkhasti, C. Apetrei, J. Lozano and A. Anyogu, Trends Food Sci. Technol., 2018, 80, 71–92 CrossRef CAS.
- M. Papageorgiou, D. Lambropoulou, C. Morrison, E. Kłodzińska, J. Namieśnik and J. Płotka-Wasylka, TrAC, Trends Anal. Chem., 2018, 98, 128–142 CrossRef CAS.
- R. Zhang, N. Li, J. Sun and F. Gao, J. Agric. Food Chem., 2015, 63, 8947–8954 CrossRef CAS PubMed.
- Z. Shojaeifard, M. M. Bordbar, M. D. Aseman, S. M. Nabavizadeh and B. Hemmateenejad, Sens. Actuators, B, 2021, 334, 129582 CrossRef CAS.
- T. I. Kim, J. Park and Y. Kim, Chem.–Eur. J., 2011, 17, 11978–11982 CrossRef CAS PubMed.
- S. Sudalaimani, A. Esokkiya, S. Hansda, C. Suresh, P. Tamilarasan and K. Giribabu, Food Anal. Methods, 2020, 13, 629–636 CrossRef.
- S. A. Ghoto and M. Y. Khuhawar, Anal. Sci., 2020, 20P153 Search PubMed.
- M. Saravanakumar, B. Umamahesh, R. Selvakumar, J. Dhanapal and K. I. Sathiyanarayanan, Dyes Pigm., 2020, 178, 108346 CrossRef CAS.
- L. Betancourt, P. Rada, L. Hernandez, H. Araujo, G. Ceballos, L. Hernandez, P. Tucci, Z. Mari, M. De Pasquale and D. Paredes, J. Chromatogr. B: Anal. Technol. Biomed. Life Sci., 2018, 1081, 51–57 CrossRef.
- H. C. Kolb, M. Finn and K. B. Sharpless, Angew. Chem., Int. Ed., 2001, 40, 2004–2021 CrossRef CAS.
- B. He, T. Bai, Y. Wu, S. Li, M. Gao, R. Hu, Z. Zhao, A. Qin, J. Ling and B. Tang, J. Am. Chem. Soc., 2017, 139, 5437–5443 CrossRef CAS PubMed.
- M. K. Saroj, N. Sharma and R. C. Rastogi, J. Fluoresc., 2011, 21, 2213–2227 CrossRef CAS.
- M. K. Saroj, R. Payal, S. K. Jain and R. C. Rastogi, J. Mol. Liq., 2020, 302, 112164 CrossRef.
- V. C. Rufino, S. M. Resende and J. R. Pliego, J. Mol. Model., 2018, 24, 1–9 CrossRef CAS PubMed.
- R. M. Pontes, Comput. Theor. Chem., 2018, 1140, 63–72 CrossRef CAS.
- Y.-l. Mu, C.-j. Zhang, Z.-l. Gao, X. Zhang, Q. Lu, J.-s. Yao and S. Xing, Synth. Met., 2020, 262, 116334 CrossRef CAS.
- S. N. Mobarez, N. Wongkaew, M. Simsek, A. J. Baeumner and A. Duerkop, Chemosensors, 2020, 8, 99 CrossRef CAS.
- Z. Quan, H. He, H. Zhou, Y. Liang, L. Wang, S. Tian, H. Zhu and S. Wang, Sens. Actuators, B, 2021, 333, 129535 CrossRef CAS.
- Y. Sugiyama, H. Ohta, R. Hirano, H. Shimokawa, M. Sakanaka, T. Koyanagi and S. Kurihara, Anal. Biochem., 2020, 593, 113607 CrossRef CAS PubMed.
- Y. Zhang, F. Lu, R. Huang, H. Zhang and J. Zhao, Catal. Commun., 2016, 81, 10–13 CrossRef CAS.
Footnote |
| † Electronic supplementary information (ESI) available. See https://doi.org/10.1039/d2ra04250a |
| This journal is © The Royal Society of Chemistry 2022 |

