 Open Access Article
Direct glass-to-glass bonding obtained via simplified ammonia-based low-temperature procedure resists high shear stress and powerful CW fiber laser irradiation
Jansen Zhou *a,
Nanqin Mei
 bc,
Zoya Leonenkobcd,
Norman Zhou
 a and
Michael Mayer
 a
a
aCentre for Advanced Materials Joining, Department of Mechanical and Mechatronics Engineering, University of Waterloo, 200 University Ave W, Waterloo, ON N2L 3G1, Canada. E-mail: j326zhou@uwaterloo.ca
bDepartment of Physics and Astronomy, University of Waterloo, 200 University Ave W, Waterloo, ON N2L 3G1, Canada
cWaterloo Institute for Nanotechnology, University of Waterloo, 200 University Ave W, Waterloo, ON N2L 3G1, Canada
dDepartment of Biology, University of Waterloo, 200 University Ave W, Waterloo, ON N2L 3G1, Canada
First published on 28th October 2022
Abstract
Direct glass-to-glass bonding is important for high-technology components in optics, microfluidics, and micro-electromechanical systems applications. We studied direct bonding of 1 mm thick soda-lime float glass substrates. The process is based on the classic RCA-1 cleaning procedure from the semiconductor industry modified with an ammonium hydroxide rinse, followed by a thermal treatment under unidirectional pressure without the need for a dedicated drying step. RCA-1 uses a solution of ammonium hydroxide and hydrogen peroxide to clean contaminants off the surface of silicon and enable subsequent bonding. Bond quality was evaluated using destructive shear testing. Strong bonds (≈7.81 MPa on average) were achieved using unidirectional pressure of approximately 0.88 MPa and bonding temperatures between 160 °C and 300 °C applied for 30 min. Surface roughness and chemistry was characterized before and after cleaning. The optical robustness of the bonds was tested and shown to be capable of surviving high powered continuous wave (CW) fiber laser irradiation of at least 375 W focused for 2 s without delamination. Melting of the substrate was observed at higher powers and longer exposure times.
1. Introduction
Direct bonding is a process used to form atomic bonds across the interface between two substrates without the need of an interlayer or filler material.1–4 Glass joints made with direct bonding are important in a number of applications, including chemical analysis,1,5 microfluidics,6–9 and in the development of ultrashort pulsed microchip lasers.8–11 For laser applications, these glass bonds need to be strong enough to withstand high powered laser pulses without breaking or fracturing.To make permanently strong bonds, high process temperatures, pressures, and bonding times are usually used.1,2,12 This type of direct bonding is called fusion bonding, where the surfaces are cleaned and heated to their softening point, forming a welding interface.2 Pyrex glass fusion bonding needs a process temperature of ≈650 °C.2 High purity fused silica fusion bonding can reach as high as 1000 °C.2,7 However, for the construction of high-technology components in the optical, microelectronic, and microfluidic fields, lower process temperatures are beneficial.1,2,7,13–16 Elevated temperatures can limit the use of sensitive functional elements in the bonding stack, as well as cause thermomechanical stress when using materials with different thermal expansion coefficients.1,2,7,14,16
Specialized cleaning procedures are required to prepare glass surfaces for low temperature direct bonding.7,8,14 Ref. 17 reports a study on the effects of various cleaning reagents for direct bonding of glass-to-glass. While the authors achieved strong bonding (≈6 MPa) without the use of adhesives, their procedure still required relatively high temperatures (400 °C) and relatively long bonding times (10 h).17 Ref. 18 reports an optimized solution for cleaning soda-lime glasses, however, they also use high temperatures (560 °C) and bond times (4 h). More recently, surface-activated bonding (SAB) approaches have been shown to be a promising technique to lower process temperatures.7,8,13,14 While these techniques have achieved strong bonding at low temperatures (24 °C to 300 °C), they are often complex, multistep processes that still require extensive bonding times (2 h to 24 h) in order to function.7,8,14,19 There is a gap in knowledge regarding fast, direct bonding processes at low temperatures. Such knowledge would be helpful to accommodate industry mass production of reliable bonds. More information also needs to be known about how laser induced damage affects the bonding interface.
In this paper, we fill this gap by suggesting a simple, low temperature, direct bonding process for soda-lime float glass and contribute a process study investigating the effect of bonding temperature on the resulting bond strength, defining the optimum temperature range for successful bonding. The surface roughness, surface chemistry, and bond robustness under powerful laser illumination for the samples is also studied.
2. Theory
2.1 Mechanism for bonding in the presence of non-zero physical separation and possible contamination
There exists on the surface of glass a vast number of silanol groups.17,20 These groups form when silicon is exposed to ambient water in the air, resulting in increased hydrophilicity of the glass surface.20 This property encourages the surface groups of glass substrates to form hydrogen bonds. Such bonds can bridge across the interface of two glass surfaces when they are brought close together, creating temporary links that can be converted to stronger, permanent covalent bonds through a condensation reaction activated by thermal treatment.17,20 Si–O–Si/Si–N–N–Si bonds can form, with water/NH3/H2 as a byproduct.3,7,20 With this treatment, any of the byproducts are expected to be driven out of the interface to allow an even more intimate level of contact between the glass substrates, which is required for covalent bond formation.20,21 This mechanism is supported by ref. 7, where they also used an RCA-1 based cleaning method.2.2 Surface contact area
The mechanism for bonding requires enough surface area contact at a nanometer distance.7,20,22 This contact area is determined by the asperities at the glass surface and particle contamination. Dust, debris, and organic contaminants can prevent the mechanism from occurring by blocking contact between the silanol groups or causing excessive physical separation between glass substrates.17 Separation that is too large can prevent permanent, covalent bonds from forming since these bonds only act over relatively small distances.21 Thus, such separations result in either no bonding between the substrates, or weak hydrogen bonding.21Asperities are a feature of the material surface itself and typically need to be within a certain range to allow for two surfaces to bond.22,23 An example of the asperities that could be found at a glass-to-glass interface is shown in Fig. 1 of ref. 22. Pressure can help to overcome the effects of particle contamination and rough surfaces, as substrates can deform elastically to allow for more effective contact.20 At higher temperatures, materials are more malleable and compliant, also contributing to an increased effective contact area.20
3. Experimental
3.1 Float glass materials
All bonds were created with standard microscope slides (glass substrates) made of regular soda-lime glass (brand: Thermo Scientific™ ABAA000001##12E03MNZ10MH#, composition: 72.20% SiO2, 14.30% Na2O, 1.20% K2O, 6.40% CaO, 4.30% MgO, 1.20% Al2O3, 0.03% Fe2O3 and 0.30% SO3; brand: VWR 48300-026, composition: not reported, but known to be made of soda-lime glass).24,25 Soda-lime glass is cheap and accessible, while having a similar composition to silica glasses used in industry.7,8,18,24,25 Preparation of the samples was carried out in a Hamilton SafeAire fume hood (Hamilton Laboratory Solutions, Manitowoc, Wisconsin, USA) in order to minimize contamination at the glass-to-glass interface and prevent escape of RCA fumes.3.2 Cleaning procedure
The cleaning solution that we used to clean the glass substrates is based on the classic RCA-1 method used to remove organic contaminants and films from the surface of silicon wafers.26 The cleaning solution also oxidizes the silicon, leaving a thin oxide layer that helps to ensure abundant silanol groups exist on the surface of the substrates for bonding.26 A beaker filled with 200 mL of DI water was heated to 70 °C and checked with a thermometer. The temperature was controlled at 70 °C as 40 mL of 28% to 30% ammonium hydroxide and 40 mL of 30% hydrogen peroxide were added. This mixture was left to rest for 1 min to 2 min to allow the solution to start bubbling. The glass substrates were then immersed in the solution for ≈15 min while swirling them occasionally. Afterwards, the glass substrates were rinsed in 28% to 30% ammonium hydroxide instead of the traditional DI water rinse, and wet mounted into a custom made clamping apparatus illustrated in Fig. 1. The surfaces were not dried prior to mounting.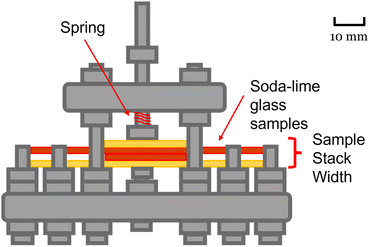 | ||
| Fig. 1 Schematic diagram of clamping apparatus used for bonding process. Glass sample dimensions: brand – Thermo Scientific, 1 mm × 76 mm × 26 mm, brand – VWR, 1 mm × 75 mm × 25 mm.24,25 Red represents the cleaned glass substrates, whereas yellow represents the uncleaned glass substrates. | ||
3.3 Bonding procedure
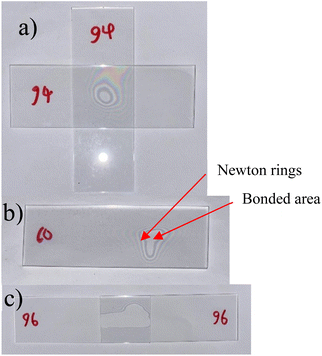
The clamping apparatus was designed in stainless steel to hold the samples under a constant, known force as they were bonded at various temperatures. Constant pressure was applied throughout the bonding process to increase the effective contact area, helping to overcome possible particle contamination and asperities.22 Force applied to the samples was calculated using Hooke's law for springs, using the manufacturer's reported spring rate. Additional non-cleaned glass substrates were added as buffer to prevent sample cracking and homogenize the pressure applied, also shown in Fig. 1. The thermal treatment was conducted in a Binder precision oven (Binder, Tuttlingen, Germany) and temperature was monitored using 4-wire resistance readings from a resistive temperature detector. Samples were bonded at temperature levels ranging from 40 °C to 300 °C, held for 30 min at a specified temperature, excluding an extra ≈7 min for stabilization after the samples were placed into the oven. The force applied to the samples was about 26 N. Dividing this force by the area of the hexagonal plunger head gives a pressure of about 0.88 MPa. The substrates were contacted in a number of different configurations, shown in Fig. 2, to help accommodate the sample for the planned type of strength testing.3.4 Measuring surface roughness
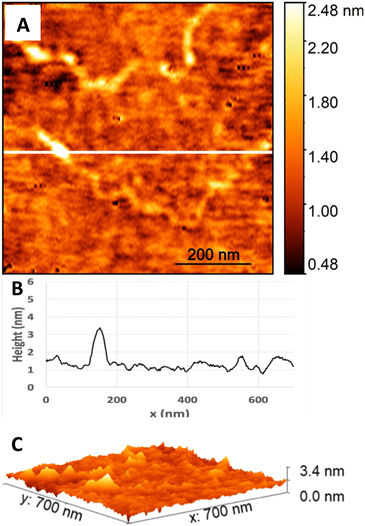
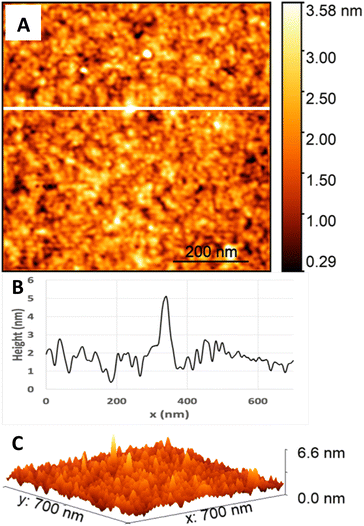
Atomic force microscopy (AFM) is widely used for high-resolution imaging of sample surfaces and for studying the properties of glass surfaces.27–30 AFM imaging of the surface topology of soda-lime glass before and after the cleaning process was done using AFM (JPK Nanowizard II, Bruker, Billerica, Massachusetts, USA) in intermittent contact mode with a line rate of 0.7–0.9 Hz, with the HQ:NSC14/AL BS AFM probes from μMasch (resonance freq. 160 kHz). The height profiles of the AFM images are shown as cross sections in part B of Fig. 5 and 6. The Gwyddion software31 was used for surface roughness (RS) analysis of the AFM images. In Gwyddion, RS is expressed as the mean square roughness (RMS) of height irregularities which is calculated using the 2nd central moment of the data values.31 2D FFT filtering was used to remove background noise and the plane background was also removed to properly level the images.31 All data analysis was performed on images after applying only the mentioned filters to best preserve the raw data while eliminating the impact of noise and unleveled background.3.5 Assessing surface chemistry
Surface species at the bonding interface were detected using X-ray photoelectron spectroscopy (XPS). The instrument used was a Thermo-VG Scientific ESCALab 250 microprobe (Thermofisher, Waltham, Massachusetts, USA). Data was analysed using CasaXPS software, after calibrating the data by setting the true value of the C 1s high resolution readings to 284.8 eV, the adventitious carbon.323.6 Assessing the bonds: qualitative, tensile, and laser tests
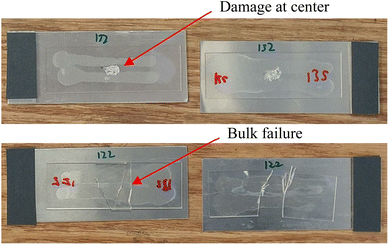
The bond strength was characterized in three ways. First, we attempted to break the bonds manually to test the bonds mechanically and qualitatively, observing the mode of failure. Second, we used a micro tensile tester (Instron 5548 Micro Tester, Instron, Norwood, Massachusetts, USA) in compression mode to destructively test the shear strength of the bonds. A diagram of the destructive test setup is given in Fig. 3. Shear strength was calculated by dividing the force load that a given sample could handle before breaking by the total bonded area of the sample. The total bonded area was determined using GIMP image processing software (https://www.gimp.org/) to determine pixel measurements of the bonded area, converting it to metric units using a known scale. If the bonded area was too large to be tested effectively, the sample bonding configuration was changed or the samples were cut using a carbide scriber so a smaller subset of the total area could be tested. Interface and bulk breaks were confirmed based on damage location. Fig. 4 shows examples of damage that would be classified as originating at the interface or bulk material.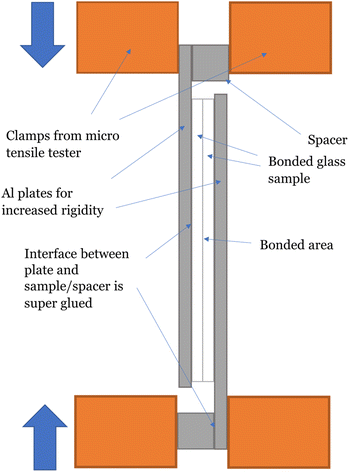 | ||
| Fig. 3 Diagram of tensile testing setup. Bonded samples were glued to aluminium plates with super glue to increase rigidity of the samples for testing. Samples were compressed at 1 mm min−1 until failure at the bond site or bulk material. Samples that broke before force was applied or broke at the glue bond were excluded. This method is based on the testing method reported in ref. 17. | ||
For the third test, the sample bonds were irradiated with an IPG YLR-500 Ytterbium CW Fiber Laser (IPG Photonics, Oxford, Massachusetts, USA) at high power as an exploratory study of their possible use in microchip lasers. The focused, Gaussian laser had a nominal wavelength of 1070 nm, a maximum power of 500 W, and a core fiber with 50 μm diameter. At the time of laser installation, the beam was measured to have a radius of 37.2 μm. An updated measurement was not available at the time of writing.
4. Results and discussion
4.1 Surface roughness characterization
Fig. 5 and 6 are AFM topography images and height profiles for soda-lime glass samples before and after applying the cleaning process. The cross-sections of the surface (Fig. 5 and 6, part B) for each image together with the 3D views (Fig. 5 and 6, part C) show that the largest height difference between the low and high features of the sample before cleaning is close to 3 nm; that of the sample after cleaning is close to 6 nm. The surface before cleaning (Fig. 5) had an RMS of 262.9 pm, whereas the surface after cleaning (Fig. 6) had an RMS of 525.2 pm. The values are similar to what is reported as typical RS values for bonding in literature, with RS values ranging from 0.3 nm to 0.9 nm for an area of 1 μm squared.3,8,14,33 While other studies report much higher RSs (6 nm), they do not specify how the values were measured, making it difficult to compare.7 Overall, our cleaning process does not noticeably affect RS as both values before and after cleaning fall within the typical range for bonding (or lower), providing evidence that supports the direct bonding mechanism.204.2 Qualitative assessment of bond strength
Initial qualitative bond strength results guided subsequent experiments. Bonds are classified as a strong, weak, or no bond. “Strong” bonding is defined as bonding that shows a perfectly bonded area surrounded by Newton rings, unable to be broken by hand even with a considerable amount of force (about 30 N to 40 N) and/or when broken, leads to damage at the interface surface, indicating bulk material fracturing. “Weak” bonding is defined as bonding that shows a perfectly bonded area surrounded by Newton rings that is easily broken at the interface with little force and when broken, does not leave any visible damage at the interface. “No bond” is defined as the absence of a perfectly bonded area.From our qualitative results, it was found that high applied pressures and temperatures during bonding tended to yield the strongest bonds. Increased pressures and temperatures help to overcome common bonding inhibitors, such as particle contamination and low asperity contact, resulting in a higher proportion of covalent bonds being formed and an overall stronger interface adhesion.20,21 Our results also helped to determine a pressure at which bonding occurs consistently (0.88 MPa), while avoiding sample cracking from too much pressure. However, these findings are not sufficient to formally characterize the strength of the bonds. Bonded area plays an important role in determining bond strength, as larger areas of remaining hydrogen bonds may resist an equivalent amount of shear as a smaller area of interfacial covalent bonds, even though covalent bonds are vastly stronger than hydrogen bonds individually.21 Therefore, destructive shear strength tests were conducted while controlling for bonded area.
4.3 Shear testing
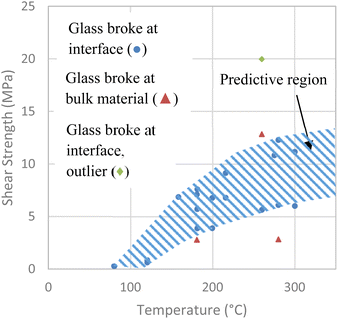
The results for the destructive shear tests are shown in Fig. 7. The hatched region in Fig. 7 indicates the estimated shear strength region for our process as bonding temperature increases. Our results show shear strength values ranging from 3.9 MPa to 19.9 MPa for bonding temperatures of 160 °C to 300 °C, using a 30 min temperature treatment time. The strength of the bonds was found to increase with process temperature. This is likely due to the conversion of weaker hydrogen bonds to stronger covalent bonds reported to occur during temperature treatment.20 The strength values are in the range of those found in previous research. One paper reported values between 3.45 MPa and 12.2 MPa for an annealing temperature of 400 °C and bonding time of 10 h.17 Another paper reported strong bonding when samples were pre-bonded at room temperature for 24 h, then annealed at 150 °C for 12 h.6 More recent studies show bond strengths in the range of 4.5–15 MPa for temperatures ranging from 24 °C to 560 °C, with prebonding and annealing steps requiring 4–24 h.7,8,14,18,19 Our process generated bonds comparable to those obtained with recent SAB and other methods.7,8,14,18,19 At the same time, our process has reduced complexity, a reduced 30 min heat treatment time, and is thus very suitable for mass production.Bulk material breaks are also shown in Fig. 7, which can occur when the bond is much stronger than the bulk glass, causing the break to occur at a point away from the interface. These breaks can indicate that the bond being tested is able to withstand the resisted pressure or higher, giving an approximate lower limit for the bond strength and providing additional evidence for high strength of the bonds.
4.4 Additions to current bonding model
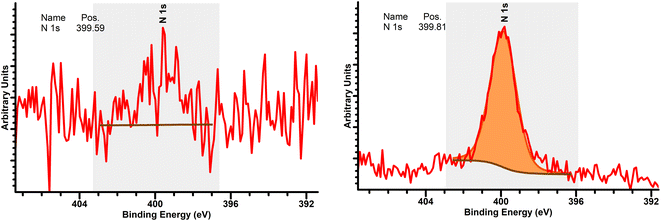
The short treatment time can likely be attributed to the ammonium hydroxide rinse after cleaning. At a concentration of 30%, ammonium hydroxide has a much lower boiling point than water (27 °C vs. 100 °C), making it more volatile.34 Thus, for low temperature bonding, ammonia at the interface from our rinse may be removed more easily than water, facilitating the direct bonding mechanism.7,20 In addition, ammonium hydroxide mimics the activity of water at the interface, which is to form temporary hydrogen bonds at room temperature between glass samples that become permanent covalent bonds after a temperature treatment step.20The direct bonding mechanism is further supported by high resolution XPS results (Fig. 8). The presence of a nitrogen peak at the cleaned sample interface which is absent before cleaning suggests the presence of nitrogen species due to the cleaning procedure. These samples had also been left to sit in ambient air for about 48 hours prior to testing, supporting the idea that the detected N is likely residual N incorporated into the surface, subsequently facilitating the bonding mechanism through Si–N–N–Si bonds.7,35,36 Peak intensity was around 399.81 eV, which, according to ref. 36, is close to the bonding energy for H–N–H bonds (399.7 eV) and Si–N bonds (400.9 eV). From data in the NIST XPS database, the presence of Si–NH2 bonds (397.5–398.6 eV) and/or NH3 bonds (398.6–399.6 eV) at the surface may also be present.35 A model summarizing the bonding mechanism is given in Fig. 9.
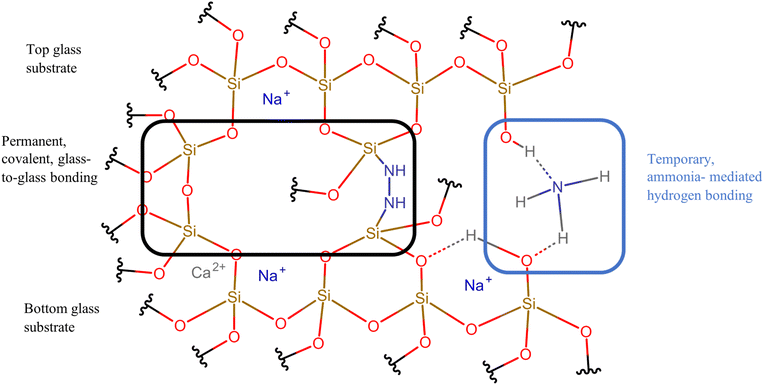 | ||
| Fig. 9 Model of microscopic bonding mechanism at the glass-to-glass interface, based on high resolution XPS results and model outlined by ref. 7. The mechanism shows the structure of temporary hydrogen bonding formed before thermal treatment (right), as well as permanent covalent bonding (Si–O–Si and Si–N–N–Si bonds) that occurs after thermal treatment (left).7,20 Ammonia is presented as a hydrogen bond mediator in this image because an ammonium hydroxide rinse was used in our experiments. In the traditional RCA cleaning rinse, interfacial hydrogen bonding is mediated by water. Illustration was created using Chemspace (https://www.chem-space.com/real-space). | ||
4.5 Laser testing
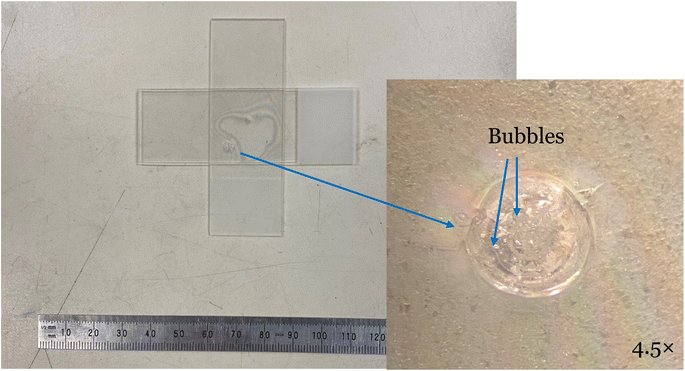
Finally, we conducted an exploratory study of bond robustness under intense laser irradiation using a powerful CW fiber laser. An example of the laser induced damage is shown in Fig. 10, where the laser was directed onto a previously bonded region. When a sample bonded at 160 °C was irradiated with a laser at 75% power (≈375 W) for 2 s, the interface did not show any fracturing or delamination. Only when the power was increased to 425 W or the dwell time was increased to 4 s did damage occur, indicated by a loss of bonded area as shown by a shift of the Newton rings. The damage is highlighted in the magnified picture of Fig. 10. The magnified picture reveals melting of the surface material indicated by the presence of bubbles. As no interfacial damage was observed without the presence of melting, the robustness of the bonds under CW laser irradiation is at least as high as that of the glass bulk material.5. Conclusions
Direct bonding of float glass substrates was successful using the reported process. The process generated bond shear strengths similar to recent methods, but was faster and was perceived to be easier to operate. The surface roughness was small enough for bonding. Evidence of nitrogen incorporation into the glass interface supports the bonding model. The bonds were able to survive substantial irradiation from a continuous wave fiber laser at least as well as the glass bulk, highlighting the optical robustness of the bonds.Bond time and applied pressure during temperature treatment are other factors that remain to be optimized to further improve bonding, if needed.
Conflicts of interest
There are no conflicts to declare.Acknowledgements
We are grateful for the material and equipment donations of Montfort Laser GmbH, Goetzis, Austria, as well as the helpful discussions with their scientists. We acknowledge the assistance in material analysis provided by WATLab at the University of Waterloo, the infrastructure of which is enabled by the Canada Foundation for Innovation and the Province of Ontario. We acknowledge funding from the Natural Science and Engineering Research Council of Canada (NSERC). J. Zhou acknowledges the Engineering Excellence Master's Fellowship (EEMF). N. Mei acknowledges the Waterloo Institute for Nanotechnology (WIN) Graduate Fellowship.References
- A. Sayah, D. Solignac, T. Cueni and M. A. M. Gijs, Development of novel low temperature bonding technologies for microchip chemical analysis applications, Sens. Actuators, A, 1999, 84, 103–108 CrossRef.
- R. Sabia, US Pat., US6814833B2, 2004 Search PubMed.
- P. Birckigt, K. Grabowski, G. Leibeling, T. Flügel-Paul, M. Heusinger, H. Ouslimani and S. Risse, Effects of static load and residual stress on fused silica direct bonding interface properties, Appl. Phys. A, 2021, 127, 938 CrossRef CAS.
- Q. Y. Tong, T. H. Lee and U. Gösele, The Role of Surface Chemistry in Bonding of Standard Silicon Wafers, J. Electrochem. Soc., 1997, 144, 384–389 CrossRef CAS.
- D. J. Harrison, K. Fluri, K. Seiler, Z. Fan, C. S. Effenhauser and A. Manz, Micromachining a Miniaturized Capillary Electrophoresis-Based Chemical Analysis System on a Chip, Science, 1993, 261, 895–897 CrossRef CAS PubMed.
- J. Xu, C. Wang, S. Zhou, R. Zhang and Y. Tian, Low-temperature direct bonding of Si and quartz glass using the APTES modification, Ceram. Int., 2019, 45, 16670–16675 CrossRef CAS.
- C. Mai, M. Li and S. Yang, Low temperature direct bonding of silica glass via wet chemical surface activation, RSC Adv., 2015, 5, 42721–42727 RSC.
- J. Xu, C. Wang, T. Wang, Y. Wang, Q. Kang, Y. Liu and Y. Tian, Mechanisms for low-temperature direct bonding of Si/Si and quartz/quartz via VUV/O3 activation, RSC Adv., 2018, 8, 11528–11535 RSC.
- J. Wei, S. M. L. Nai, C. K. S. Wong, Z. Sun and L. C. Lee, Low temperature glass-to-glass wafer bonding, IEEE Trans. Adv. Packag., 2003, 26, 289–294 CrossRef CAS.
- D. Kopf, Eur. Pat., EP2577818A1, 2013 Search PubMed.
- D. Kopf, Eur. Pat., EP3167516A1, 2017 Search PubMed.
- W. P. Maszara, G. Goetz, A. Caviglia and J. B. McKitterick, Bonding of silicon wafers for silicon-on-insulator, J. Appl. Phys., 1988, 64, 4943–4950 CrossRef CAS.
- F. Mu, K. Iguchi, H. Nakazawa, Y. Takahashi, M. Fugino, R. He and T. Suga, A comparison study: Direct wafer bonding of SiC–SiC by standard surface-activated bonding and modified surface-activated bonding with Si-containing Ar ion beam, Appl. Phys. Express, 2016, 9, 081302 CrossRef.
- C. Wang, J. Xu, S. Guo, Q. Kang, Y. Wang, Y. Wang and Y. Tian, A facile method for direct bonding of single-crystalline SiC to Si, SiO2, and glass using VUV irradiation, Appl. Surf. Sci., 2019, 471, 196–204 CrossRef CAS.
- A. Berthold, B. Jakoby and M. J. Vellekoop, Wafer-to-wafer fusion bonding of oxidized silicon to silicon at low temperatures, Sens. Actuators, A, 1998, 68, 410–413 CrossRef CAS.
- J. Kiihamäki, H. Kattelus, M. Blomberg, R. Puurunen, M. Laamanen, P. Pekko, J. Saarilahti, H. Ritala and A. Rissanen, Advanced Materials and Technologies for Micro/Nano-Devices, Sensors and Actuators, Springer Science and Business Media, Dordrecht, 2010 Search PubMed.
- T. Mayer, A. N. Marianov and D. W. Inglis, Comparing fusion bonding methods for glass substrates, Mater. Res. Express, 2018, 5, 085201 CrossRef.
- Q. Chen, Q. Chen and M. Ferraris, Optimization of thermal assisted direct bonding of soda-lime glasses for lab-on chip application, Microsyst. Technol., 2010, 16, 527–532 CrossRef CAS.
- M. M. R. Howlader, S. Suehara and T. Suga, Room temperature wafer level glass/glass bonding, Sens. Actuators, A, 2006, 127, 31–36 CrossRef CAS.
- A. Plößl and G. Kräuter, Wafer direct bonding: tailoring adhesion between brittle materials, Mater. Sci. Eng., R, 1999, 25, 1–88 CrossRef.
- Y. N. Zhou, Microjoining and Nanojoining, Woodhead Publishing Limited, Cambridge, 2008 Search PubMed.
- C. Gui, M. Elwenspoek, N. Tas and J. G. E. Gardeniers, The effect of surface roughness on direct wafer bonding, J. Appl. Phys., 1999, 85, 7448–7454 CrossRef CAS.
- R. Günther, W. R. Caseri and C. Brändli, Direct bonding and de-bonding on demand of polystyrene and polyamide surfaces, treated with oxygen plasma, J. Appl. Polym. Sci., 2021, 139 DOI:10.1002/app.51753.
- Thermo Scientific Microscope slides, accessed September 2022, https://www.assets.thermofisher.com/TFS-Assets/APD/brochures/objekttraeger_uk_0715_0209.pdf Search PubMed.
- VWR® Plain and Frosted Micro Slides, Premium, accessed September 2022, https://ca.vwr.com/store/product/en/4646174/vwr-vistavisiontm-microscope-slides-plain-and-frosted-premium Search PubMed.
- RCA-1 Silicon Wafer Cleaning, accessed September 2022, https://phas.ubc.ca/%7Eampel/nanofab/sop/rca-clean-1.pdf Search PubMed.
- D. Rugar and P. Hansma, Atomic force microscopy, Phys. Today, 1990, 43, 23–30 CrossRef CAS.
- M. G. Mostofa, C. I. Park and S. S. Park, AFM probe based nano mechanical scribing of soda-lime glass, J. Manuf. Process., 2013, 15, 625–634 CrossRef.
- M. Pantić, S. Mitrović, M. Babić, D. Jevremović and T. Kanjevac, AFM surface roughness and topography analysis of lithium disilicate glass ceramic, Tribol. Ind., 2015, 37, 391 Search PubMed.
- L. Henke, N. Nagy and U. J. Krull, An AFM determination of the effects on surface roughness caused by cleaning of fused silica and glass substrates in the process of optical biosensor preparation, Biosens. Bioelectron., 2002, 17, 547–555 CrossRef CAS.
- Gwyddion user guide, http://www.gwyddion.net/documentation/user-guide-en/statistical-analysis.html, accessed October 2022 Search PubMed.
- D. Fang, F. He, J. Xie and L. Xue, Calibration of binding energy positions with C1s for XPS results, J. Wuhan Univ. Technol., Mater. Sci. Ed., 2020, 35, 711–718 CrossRef CAS.
- Surface Characterization of Coated and Uncoated Float Glass, https://www.same-nano.com/Abstracts2013/AFM-PhDschool_Extendedabstract_Kasper.pdf, accessed September 2022 Search PubMed.
- Ammonium Hydroxide, 28-30% w/w, http://www.labchem.com/tools/msds/msds/75013.pdf, accessed September 2022 Search PubMed.
- NIST XPS Database, https://srdata.nist.gov/xps/, accessed September 2022 Search PubMed.
- L. Xiao, X. Zheng, T. Zhao, L. Sun, F. Liu, G. Gao and A. Dong, Controllable immobilization of polyacrylamide onto glass slide: synthesis and characterization, Colloid Polym. Sci., 2013, 291, 2359–2364 CrossRef CAS PubMed.
| This journal is © The Royal Society of Chemistry 2022 |

