
 Open Access Article
 This Open Access Article is licensed under a Creative Commons Attribution-Non Commercial 3.0 Unported Licence
Water characterization and structural attribution of different colored opals
Niu Liab,
Qingfeng Guo *ab,
Qianqian Wangab and
Libing Liao*c
*ab,
Qianqian Wangab and
Libing Liao*c
aSchool of Gemmology, China University of Geosciences, Beijing, 100083, China. E-mail: qfguo@cugb.edu.cn
bJewelry and Mineral Materials Laboratory of Experimental Teaching Demonstration Center, Beijing, China
cBeijing Key Laboratory of Materials Utilization of Nonmetallic Minerals and Solid Wastes, National Laboratory of Mineral Materials, School of Materials Sciences and Technology, China University of Geosciences, Beijing 100083, China. E-mail: clayl@cugb.edu.cn
First published on 25th October 2022
Abstract
The structure type and water content of opal will affect its stability and value. When the structure is Opal-A type, its value is higher. When the water content is high, its stability will decrease. The structural attribution and water distribution of pink, yellow, green, blue and purple opal have been investigated by several methodologies like powder X-ray diffraction (XRD), scanning electron microscopy (SEM), thermogravimetric analysis (TGA), and Fourier transform near infrared spectroscopy (FT-NIR). The results show that all the opal samples are CT type, among which the green sample has the highest crystallinity. The water contents of the opals range from 3.06 to 8.78%. The distribution and quantity of molecular water (H2Omol) and silanols (H2OSiOH) are calculated semi-quantitatively according to intensity of 4500 cm−1 and 5200 cm−1 peaks in the near infrared region, and it is found that the water in all the samples is basically composed of molecular water. The precipitation mechanism for opal formation results in different structural types, and the difference in structural composition leads to different water contents. This work provides a theoretical basis for the future study of the opal metallogenic environment.
1. Introduction
Opal is a natural hydrated silica with the chemical formula of SiO2·nH2O. It is precipitated from saturated silicon-rich fluids by biological or abiotic processes,1–3 and the different formation conditions lead to different opal types with different structures. Levin and Ott4 used X-ray diffraction for the first time to discover the diffraction peak of cristobalite except glass. Successively, some scholars later verified that opal contains crystalline high-temperature cristobalite and low-temperature cristobalite.5–7 Flörke8 proposed the hypothesis that opal is the product of disordered paragenesis of cristobalite and tridymite. Garavelli9 further confirmed that opals can be divided into ordered and disordered types according to the degree of regularity of their structural arrangement. Jones and Segnit10 point out that opals can be divided into the following types, Opal-A: a state of high disorder and amorphous. Opal-CT: disordered cristobalite with varying degrees of accumulation and containing a large amount of tridymite. Opal-C: cristobalite with incomplete regular accumulation, mixed with a small amount of tridymite.The precipitation mechanism of opal also leads to its high-water content, usually 4–10%. Hannay11 explored the loss rate of internal water content of opal with the increase of temperature. Later, some scholars proposed that the water in the opal exists in the gap of the silicon spheres. However, the common opal did not have such gap of the precious opal, it is not composed of silica spheres. Many studies have shown that water in opal exists in the form of molecular water (H2Omol) and silanol groups (H2OSiOH).12–18 Molecular water (H2Omol) exists in the form of adsorbed water, free water molecules remaining on the surface or in the cavity (Fig. 1). Silanols (H2OSiOH) exists in the form of free silanol groups, surface or cavity free hydrogen bonding with water molecules or hydroxyl groups, and hydrogen bonding with silanol groups with the same silicon atoms (Fig. 1). Similarly, the occurrence state of water in opal is very important for a deep understanding of opal, because once the opal is mined and processed into gemstones, the subsequent loss of water whitening and cracks have a great impact on its quality.
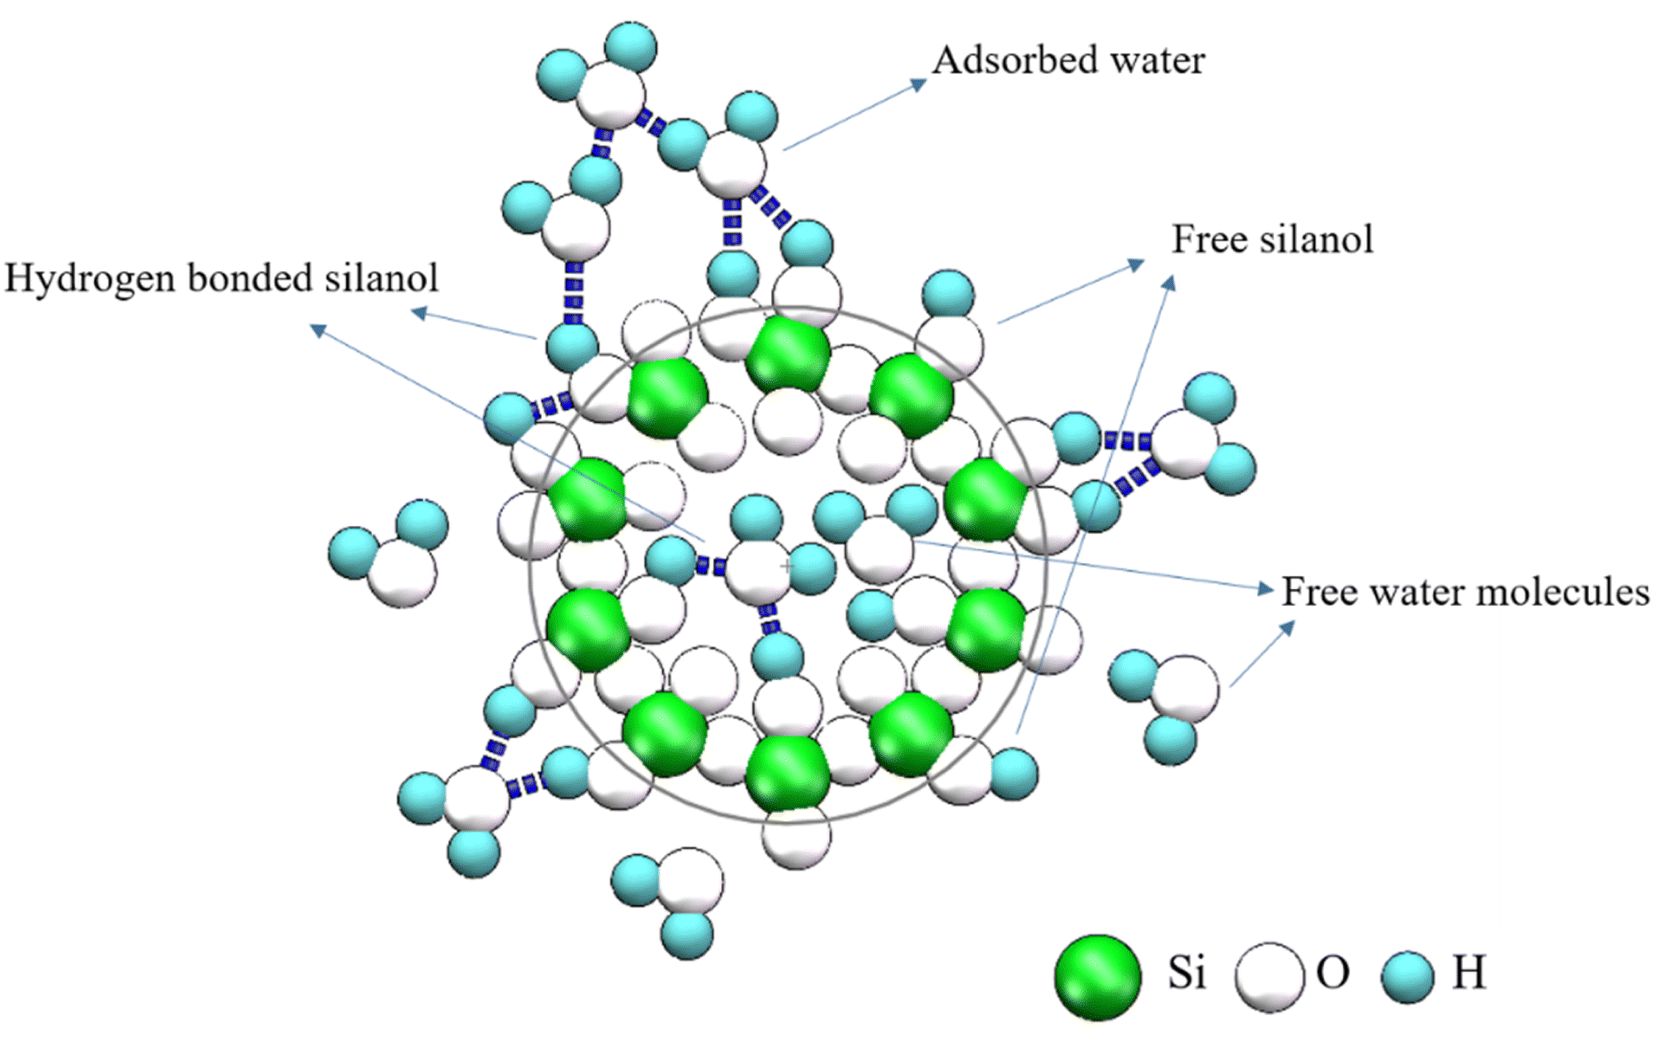 | ||
| Fig. 1 Schematic diagrams of different forms of water in opal. | ||
Scholars have reported a large number of reports on the structural classification of opal and the existence form of water,10,19–21 but there is a lack of comparative study on the water characterization and structure attribution in different colored opals. In addition, it is difficult to identify opal color variety, what type of structure and water content by naked eyes. Accordingly, the structural attribution and water distribution of pink, yellow, green, blue and purple opal, have been investigated through several methodologies like powder X-ray diffraction (XRD), scanning electron microscope (SEM), thermogravimetric analysis (TG), Fourier transform near infrared spectroscopy (FT-NIR) in this work. The mineralogical state of opals of different colors was obtained by structural comparison. In order to understand the stability of samples, Lambert–Beer law was used to semi-quantitatively calculate the amount of molecular water (H2Omol) and silanols (H2OSiOH) in different color samples. This study brings new data to the understanding of the hydration state of colored opal.
2. Materials and methods
2.1. Materials
Opal samples of five colors, pink, yellow, green, blue and purple, were collected in the study, ranging in size from 1 to 10 cm (Fig. 2).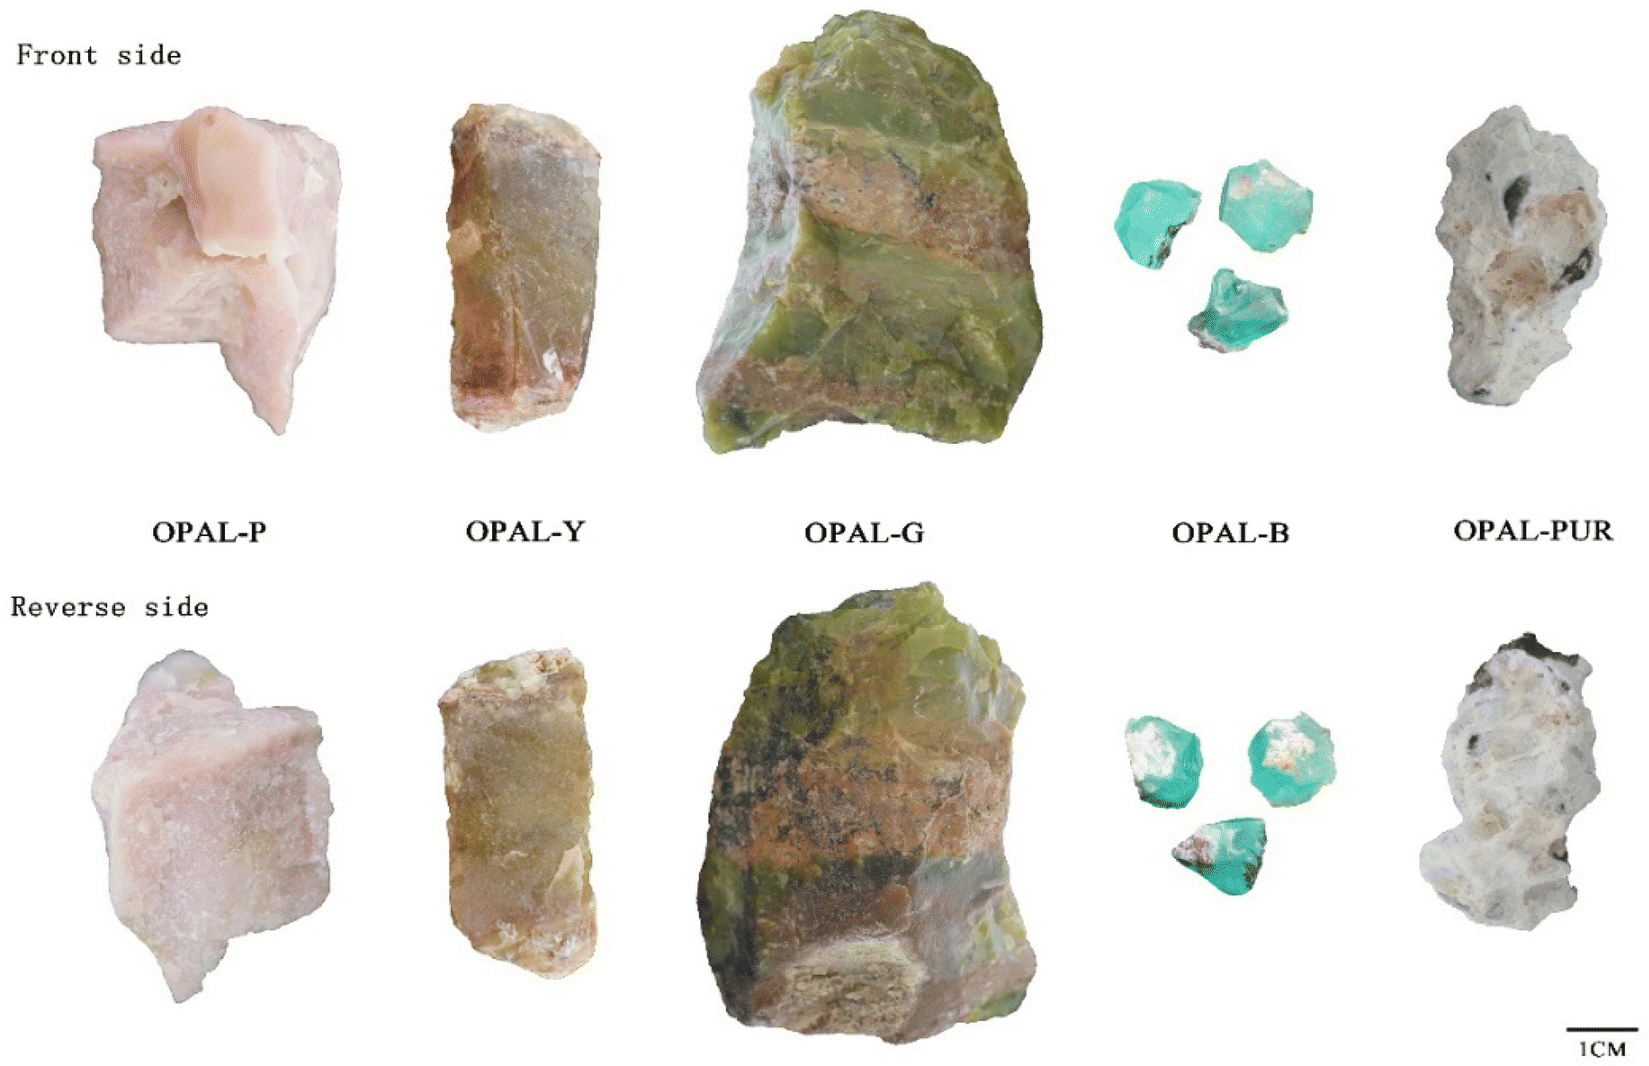 | ||
| Fig. 2 Front and reverse sides of five different colored opals. | ||
2.2. Methods
Standard gemological properties of five different colored opals were determined, including refractive index, hydrostatic SG specific gravity/density, UV fluorescence (366–245 nm) and microscopic features.The instrument used for powder X-ray diffraction test was Bruker D8 Advance from Germany, with Cu Kα radiation and a scan speed of 4° min−1, and scanning range is 5–80° (2θ).
Five different colored opals were examined with SUPRATM 55 type scanning electron microscope (SEM), using an electron-beam energy of 15 electron volts and a focal spot of about 0.8 nm. The samples were platinum coated before analysis.
The total water content of each opal was measured using thermo-gravimetric (TG) analysis, with a NETZSCH STA449C synchronous thermal analysis instrument. Samples (circa 5–15 mg of pieces) were loaded in Al2O3 crucible. Samples were heated (10 °C min−1 in a 20 ml min−1 flowing nitrogen atmosphere) and run between 25 and 1000 °C.
The near infrared measurements were obtained using Tensor 27 spectrometer. The sample was cut and polished into very thin slices, and tested by transmission method. The near infrared spectra of the samples were measured in the region 8000–4000 cm−1 at a resolution of 4 cm−1. The scanning speed is 10 kHz, and total of 32 scans were carried each time.
3. Results and discussion
3.1. Gemological properties
The gemological properties and surface characters of the investigated opals are reported in Table 1. All the samples were uniformly colored with varying degrees of surrounding rock, showing a greasy–waxy luster without play of color effect were observed (Fig. 2). The refractive index for the samples is in the range of 1.44–1.45 and the values of specific gravity are ranging from 2.06 to 2.08, and these values are comparable with other opals in literatures.22–29 The purple sample shows green fluorescence under UV lamp. The specific gravity of pink sample is related to the inclusion of palygorskite.22 Except for the purple sample which shows green fluorescence, the other samples show inert under the UV lamp.| Sample | Color | Specific gravity | Luster | Refractive indices | Fluorescence (s) | Fluorescence (l) |
|---|---|---|---|---|---|---|
| Opal-P | Pink | 2.12 | Greasy–waxy | 1.44 | Weak pink | Inert |
| Opal-Y | Yellow | 2.09 | Greasy–waxy | 1.44 | Inert | Inert |
| Opal-G | Green | 2.08 | Greasy–waxy | 1.45 | Inert | Inert |
| Opal-B | Blue | 2.06 | Vitreous–greasy | 1.44 | Inert | Inert |
| Opal-Pur | Purple | 2.08 | Greasy–waxy | 1.45 | Vivid green | Weak green |
The microscopic observations revealed that the pink opal has a granular structure (Fig. 3a). As shown in Fig. 3b and c, the yellow opal contains white cloudy inclusions and black dendritic inclusions, and the green opal fills dendritic inclusions. The texture of blue opal is fine and contains dendritic inclusions (Fig. 3d), and purple opal revealed the inhomogeneous nature of the material, with purple spots (Fig. 3e).
 | ||
| Fig. 3 Pictures of samples of opals observed under the microscope. (a) Pink opal; (b) yellow opal; (c) green opal; (d) blue opal; (e) purple opal. | ||
3.2. X-ray powder diffraction analysis
Fig. 4 shows the XRD patterns of opals with different colors. ∼4.3 Å (around 20.65°2θ) acromion is often accompanied by ∼4.1 Å (around 21.5°2θ) diffraction peak. The more disordered the structure is, the greater the intensity ratio of diffraction peaks at 4.3 Å and 4.1 Å is.30 Some scholars think that the diffraction peak at 4.3 Å is not only related to the (040) plane of tridymite and the (101) plane of cristobalite, but also the diagnostic peak of Opal-CT.10,31,32 The appearance of the diffraction peak at 4.3 Å revels the cristobalite in the opal is in a low temperature state.33 The d value is ranging from 4.261 to 4.321 Å in the opal samples.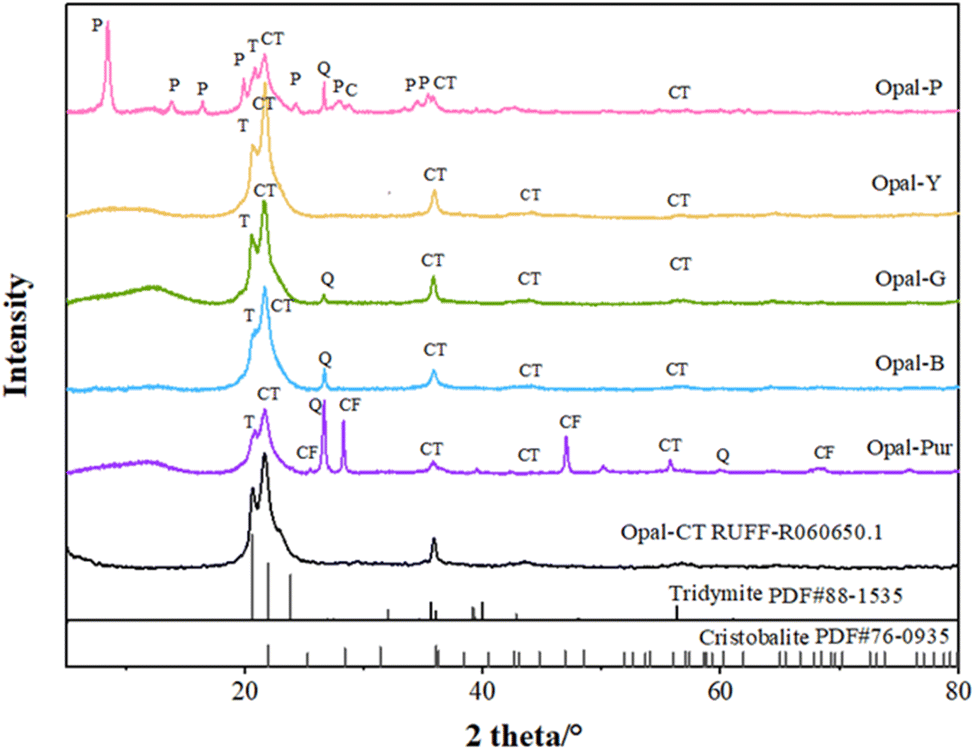 | ||
| Fig. 4 The XRD patterns of opals with different colors. | ||
The diffraction peak of ∼4.1 Å (around 21.6°2θ) is the highest peak of opal, which is considered to be caused by the juxtaposition of cristobalite (101) plane and tridymite (404) plane.34 The order degree of opal structure can be diagnosed by 4.1 Å offset position. The standard Opal-CT type opal will show a typical diffraction peak of 4.09 Å. The d value of Opal-C type opal is between 4.01 and 4.05 Å, while Opal-CT is characterized by a shift in the d value of the Opal-C ranging from 4.06 to 4.11 Å.22,35–37 The d values at around 21.6° is ranging from 4.095 to 4.110 Å. The ratio of cristobalite to tridymite can be calculated by comparing the position of the characteristic peak in the range of d = 4.04–4.11 Å (Table 2) (Opal-C contains 20–30% tridymite, Opal-CT > 50%). The following formula can be used:21
| C/TXRD = (dtrid − dmeasured)/(dtrid − dcrist) = (4.11 Å − x)/(4.11 Å − 4.04 Å) |
| Sample | d-Value at 21.6° (Å) | C/T ratio (%) | d-Value at 35.8° (Å) | FWHM° (2θ) | Structural group | Domain size (nm) |
|---|---|---|---|---|---|---|
| Opal-P | 4.110 | C0/T100 | 2.505 | 0.520 | CT | 16.5 |
| Opal-Y | 4.095 | C21/T79 | 2.498 | 0.458 | CT | 18.9 |
| Opal-G | 4.106 | C6/T94 | 2.503 | 0.407 | CT | 21.4 |
| Opal-B | 4.102 | C11/T89 | 2.501 | 0.471 | CT | 18.3 |
| Opal-Pur | 4.107 | C4/T96 | 2.506 | 0.526 | CT | 16.3 |
The diffraction peak of ∼2.5 Å (around 35.8°2θ) is composed by the juxtaposition of the tridymite at 2.52 Å (−341) and the cristobalite at 2.48 Å (200).30,38,39 Previous studies have confirmed that the offset peak range of Opal-CT at ∼35.8° is 2.49–2.52 Å, and that of Opal-C is 2.48–2.49 Å.40,41 The diffraction peak of ∼2.5 Å is also of great significance for the diagnosis of opal structural order degree, and some authors proposed that 2.5 Å is more accurate than the main peak 4.1 Å.42 In addition, there is a certain correlation between the full width at half maximum (FWHM) of 2.5 Å diffraction peak and the crystal size.43 The d values of ∼2.5 Å is ranging from 2.489 to 2.506 Å. The average grain size of the crystal plane is calculated by Jade software according to the d value at 2.5 Å, as shown in Table 2.
The peak value of ∼2.03 Å (around 44.3°2θ) is caused by the juxtaposition of the (−432) plane of tridymite and the (202) plane of cristobalite. Fig. 4 shows that the peak at around 44.3° is not clear, which is caused by the inclusion of palygorskite. Although this peak is very weak, it can provide evidence for the order of opal. In some experiments, the appears of 2.03 Å together with big particles.43 The d value of this diffraction peak is ranging from 2.045 to 2.049 Å.
The diffraction peak of ∼1.6 Å (around 56.6°2θ) is also caused by the juxtaposition of the (−513) plane of tridymite and (301) plane of cristobalite. Although the intensity of this peak is very weak, it can be used as a characteristic of opal in specific minerals.41 The d value of this diffraction peak is ranging from 1.609 to 1.617 Å.
Besides the previous peaks, diffraction peaks related to other secondary minerals were also detected. The quartz diffraction peak in auxiliary phase is slightly higher in Opal-Pur. Opal-P contains abundant diffraction peaks of palygorskite.22,44,45 The fluorite peak in Opal-Pur is consistent with the characteristic peak of calcium fluoride numbered R040099 in RUFF database.
XRD results show that all the d value at ∼21.6° are bigger than 4.05 Å, at the same time, combined with the ratio of cristobalite to tridymite, all opal samples can be defined to Opal-CT type. All samples have a 4.3 Å diffraction peak, which means that cristobalite in opal samples is β phase. It can be seen from Table 2 that the value of d (4.1 Å) decreases with the increase ratio of cristobalite/tridymite, and the grain size is 16.3–21.4 nm. The FWHM at d (2.5 Å) decreases with the increase of grain size. The higher the crystallinity is, the larger the grain size is. The crystallinity of Opal-G is the highest and that of Opal-Pur is the lowest. With the maturity of crystallinity in mineralogy, it will reflect the gradual sharpening of the main peak and the decrease of FWHH, which further indicates the increase of crystal lattice order.
3.3. SEM/XRF investigation
Generally speaking, CT type opal is a spherical aggregate or fiber crystal composed of lamellar crystals of cristobalite and tridymite, and the matrix is disordered silica.46,47 Fig. 5 depicts the SEM micrographs with different scale of the different colored opals.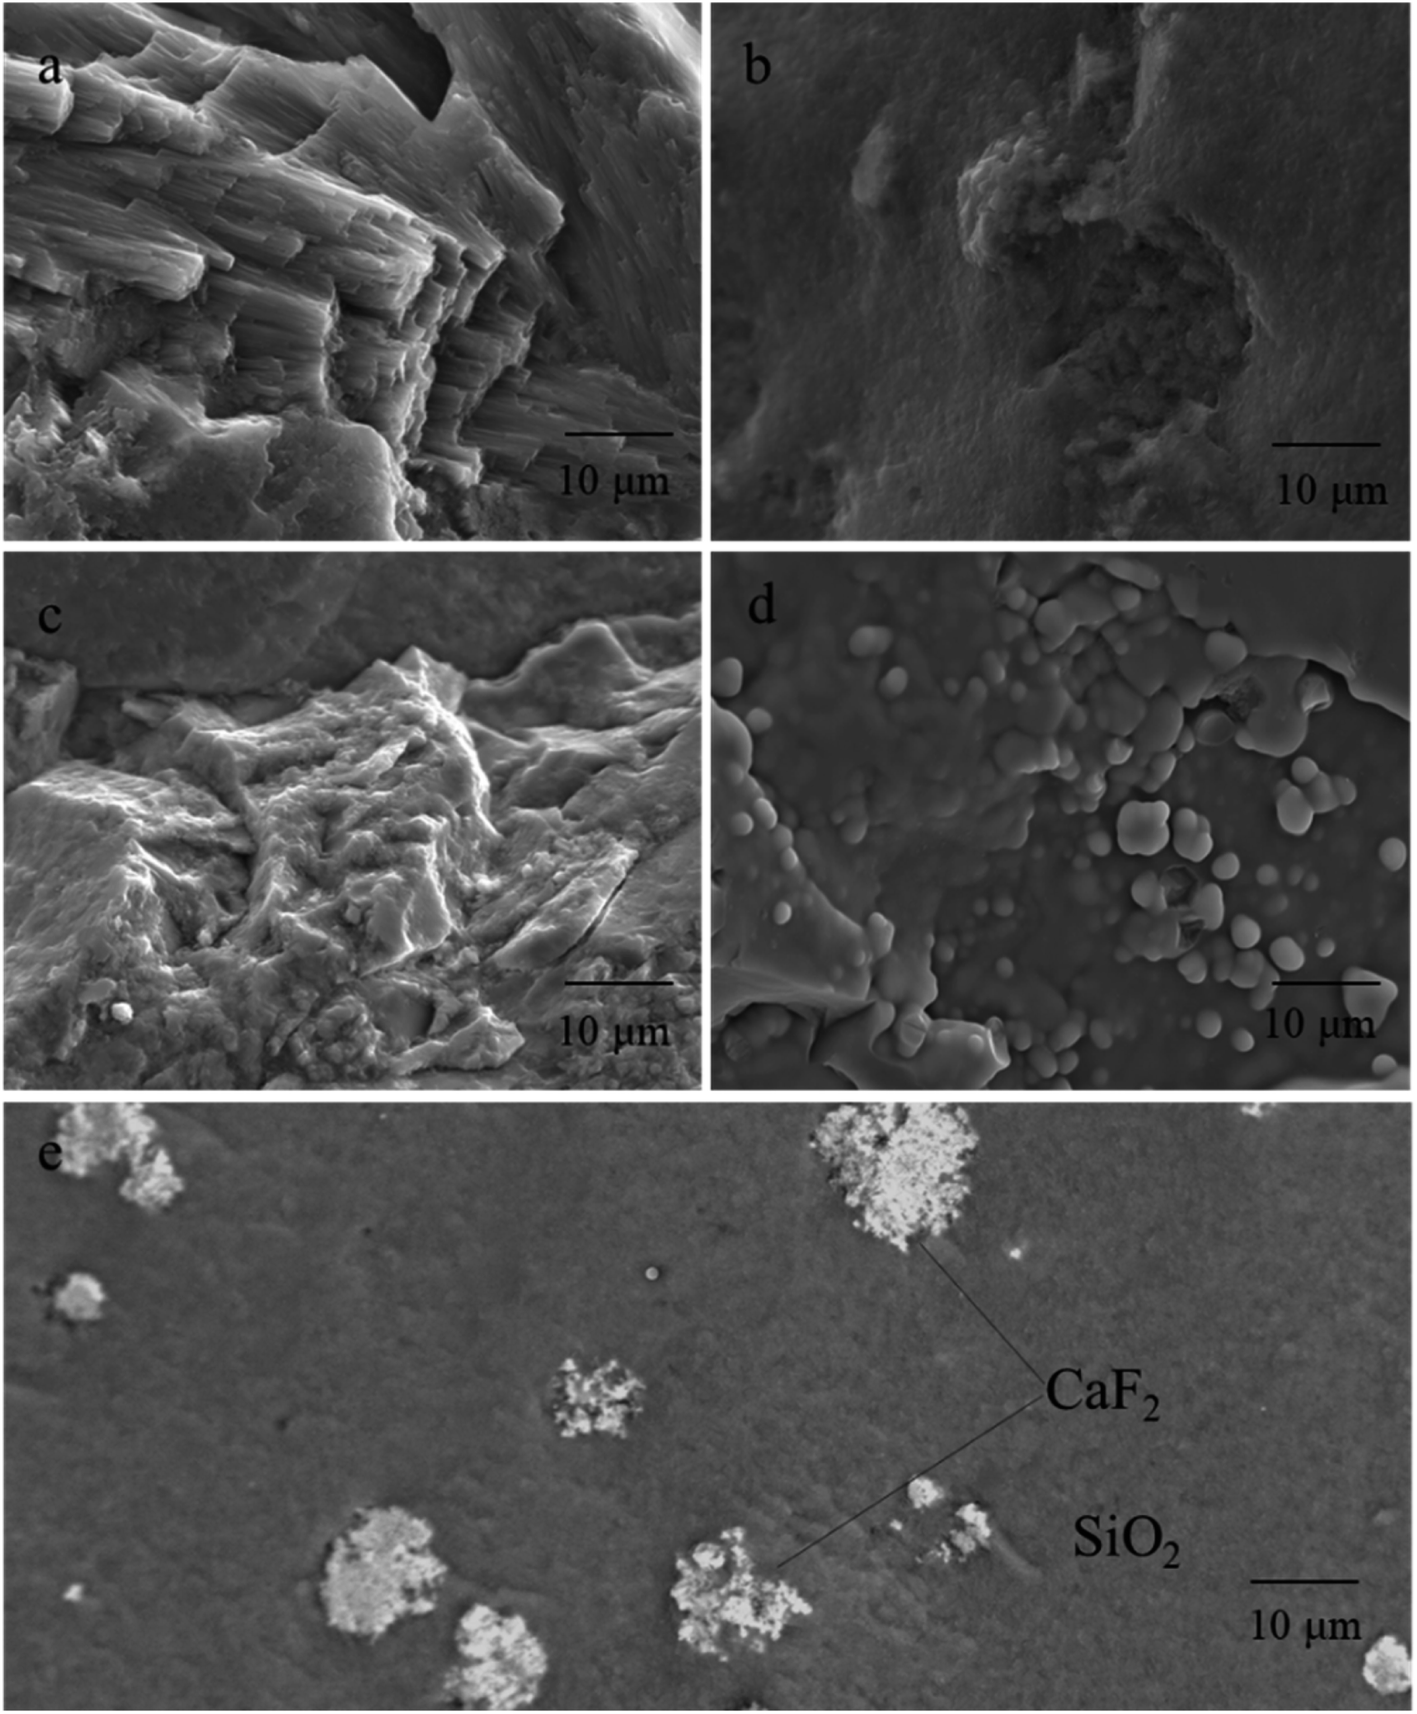 | ||
| Fig. 5 SEM micrographs of different colored opals. (a) Pink opal; (b) yellow opal; (c) green opal; (d) blue opal; (e) purple opal. | ||
The microstructure of Opal-P (Fig. 5a) is composed of fibers with a diameter of 0.05–0.1 μm, which are needle-like and directional columnar in length of 10–30 μm. Combined with XRD and XRF tests (Table 3), the Opal-P is palygorskite rich in Mg and Al, which is consistent with the results verified by Fritsch et al.48
| Sample; mineral | Opal-P | Opal-Y | Opal-G | Opal-B | Opal-Pur |
|---|---|---|---|---|---|
| SiO2 | 82.910 | 94.330 | 90.620 | 91.500 | 83.200 |
| MgO | 3.110 | 0.387 | 0.070 | 1.240 | 1.000 |
| Al2O3 | 2.550 | 0.147 | 0.113 | 0.126 | 0.325 |
| Fe2O3 | 0.522 | 0.897 | 3.520 | 0.073 | 0.034 |
| As2O3 | 0.212 | 0.000 | 0.000 | 0.000 | 0.000 |
| CaO | 0.151 | 0.159 | 0.205 | 0.146 | 6.980 |
| Na2O | 0.052 | 0.076 | 0.047 | 0.030 | 0.000 |
| ZnO | 0.045 | 0.014 | 0.064 | 0.138 | 0.000 |
| MnO | 0.040 | 0.000 | 0.004 | 0.000 | 0.000 |
| CuO | 0.038 | 0.000 | 0.000 | 1.960 | 0.000 |
| SeO2 | 0.037 | 0.000 | 0.055 | 0.045 | 0.000 |
| Cl | 0.031 | 0.068 | 0.038 | 0.065 | 0.000 |
| TiO2 | 0.023 | 0.012 | 0.015 | 0.006 | 0.000 |
| P2O5 | 0.021 | 0.015 | 0.000 | 0.000 | 0.022 |
| Ga2O3 | 0.017 | 0.016 | 0.000 | 0.000 | 0.000 |
| ZrO2 | 0.013 | 0.014 | 0.009 | 0.012 | 0.000 |
| Am2O3 | 0.009 | 0.007 | 0.009 | 0.019 | 0.000 |
| GeO2 | 0.009 | 0.012 | 0.000 | 0.000 | 0.000 |
| V2O5 | 0.008 | 0.000 | 0.003 | 0.008 | 0.000 |
| Nb2O5 | 0.006 | 0.014 | 0.003 | 0.008 | 0.002 |
| Co3O4 | 0.003 | 0.000 | 0.002 | 0.000 | 0.000 |
| K2O | 0.000 | 0.074 | 0.038 | 0.000 | 0.016 |
| IrO2 | 0.000 | 0.029 | 0.000 | 0.000 | 0.000 |
| ThO2 | 0.000 | 0.015 | 0.011 | 0.000 | 0.000 |
| Pr6O11 | 0.000 | 0.013 | 0.000 | 0.000 | 0.000 |
| SrO | 0.000 | 0.004 | 0.009 | 0.000 | 0.016 |
| PbO | 0.000 | 0.000 | 0.055 | 0.000 | 0.000 |
| Nd2O3 | 0.000 | 0.000 | 0.008 | 0.000 | 0.000 |
| P | 0.000 | 0.000 | 0.005 | 0.000 | 0.000 |
| Cr2O3 | 0.000 | 0.000 | 0.004 | 0.000 | 0.000 |
| CO2 | 0.000 | 0.000 | 0.000 | 0.000 | 3.990 |
| F | 0.000 | 0.000 | 0.000 | 0.000 | 4.320 |
| SO3 | 0.000 | 0.000 | 0.000 | 0.000 | 0.031 |
| U3O8 | 0.000 | 0.000 | 0.000 | 0.000 | 0.068 |
| Total | 89.806 | 96.302 | 94.907 | 95.375 | 100.004 |
Opal-Y (Fig. 5b) shows a relatively homogeneous texture. Opal-Y belongs to gel structure, and there are almost no silica spheres. 1–2 microspheres can be seen in some areas, with a size of 0.5 μm, shell-like fracture and small voids.
Opal-G (Fig. 5c) is a massive microstructure composed of silica gel and amorphous silica nanoparticles with unclear boundaries and gaps between blocks. The scale-like structure can be seen in part of the particles in Fig. 5c, and the silica particles exist in the form of blocks with different sizes and shapes.
The microstructure of Opal-B (Fig. 5d) is different from other opals. SiO2 microspheres with diameters of 1–2 μm can be seen in some areas, and the spheres are all fused with each other. Only when the diameter of the sphere is 0.15–0.3 μm and the gap between the spheres is 0.14–0.24 μm, the grating structure composed of SiO2 spheres can diffract visible light, resulting in play of color. Obviously, the size of the silica microsphere in Opal-B is larger than 0.3 μm, and the external shape of the SiO2 sphere is irregular. In addition, the boundary between the spheres is not clear, and the gap formed in the three-dimensional space is irregular. Therefore, the play of color effect not occur in Opal-B.
The SEM image of Opal-Pur (Fig. 5e) shows two different colors, indicating that it is composed of two minerals. The matrix material appears gray, showing an uneven surface and the milky structure of spongy unmolded microspheres. The gray-white color has a cluster-shaped microscopic appearance. XRF data (Table 3) show that Opal-Pur contains Ca and F elements. Combined with the magnification observation in Fig. 3 and XRD phase characterization Fig. 4, it is confirmed that the inclusion is purple fluorite.
3.4. Thermogravimetric analysis
Thermogravimetric analysis of all samples was carried out to estimate the water content and dehydration process of opals of the same type. It can be seen from Fig. 6 that the weight loss rate of the sample from high to low is Opal-P, Opal-G, Opal-Pur, Opal-B and Opal-Y, and the thermal decomposition of all samples can be divided into four stages. The thermal decomposition temperature of each sample and the weight loss rate of each stage are shown in Table 4. The weight loss below 150 °C is molecular water existing on the surface and in open cracks, with a weight loss rate of 0.29–2.36%. Pores water and some hydrogen-bonded water molecules are lost at about 150–350 °C, and the weight loss rate is 0.98–2.9%. Strong hydrogen-bonded water molecules and a small part of silanols are lost at 50–650 °C, and the weight loss rate is 0.36–2.44%. The silanols located in the structure and a small part of the water molecules in the matrix were lost at 1000 °C, and the weight loss rate was 0.22–1.11%. Most of the water in the samples are lost below 650 °C, and the weight loss still exists at 650–1000 °C, at this time, the hydroxyl water located in the structural position is lost. Because of their structural differences, their water content and dehydration temperature are also different.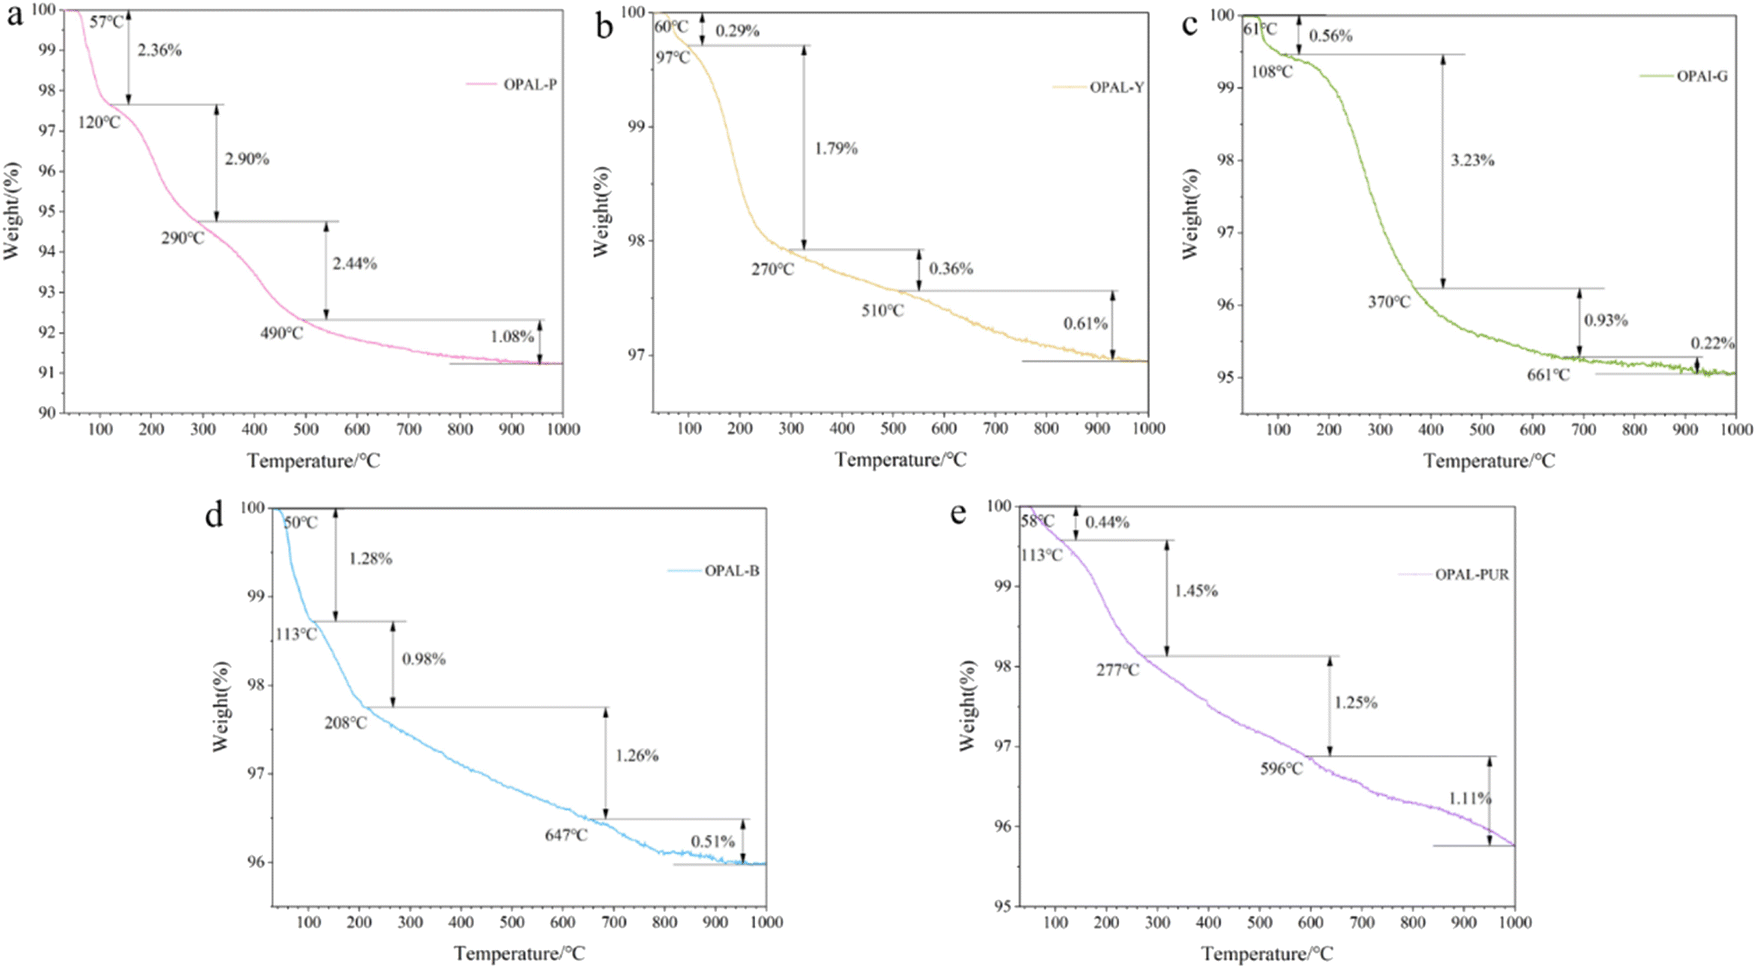 | ||
| Fig. 6 TG% mass change data plotted as a function of temperature for the opal samples. (a) Pink opal; (b) yellow opal; (c) green opal; (d) blue opal; (e) purple opal. | ||
| Sample | T1/°C | W1/% | T2/°C | W2/% | T3/°C | W3/% | Total weight/(%) |
|---|---|---|---|---|---|---|---|
| Opal-P | 120 | 2.36 | 290 | 2.90 | 490 | 2.44 | 8.78 |
| Opal-Y | 97 | 0.29 | 270 | 1.79 | 510 | 0.36 | 3.06 |
| Opal-G | 108 | 0.56 | 370 | 3.23 | 661 | 0.93 | 4.94 |
| Opal-B | 113 | 1.28 | 208 | 0.98 | 647 | 1.26 | 4.03 |
| Opal-Pur | 113 | 0.43 | 277 | 1.45 | 784 | 1.81 | 4.25 |
Opal-P contains a large amount of palygorskite, and palygorskite has large specific surface area, adsorption capacity and strong colloid properties. Therefore, the water content of Opal-P is the highest among the opals, so the weight loss is more than other samples. Opal-Pur contains a lot of CaF2, and the presence of Ca2+ will bond more water molecules.49,50 The heating temperature of Opal-Pur is still in a downward trend at 1000 °C, possibly due to the decomposition of calcium fluoride.
3.5. FT-NIR analysis
It is generally believed that most of the water on the surface of opal is not in the form of free water molecules but hydroxyl groups with silicon atoms on the surface of silica to form hydrogen-bonded silanol groups, which is physically adsorbed. The presence of hydrogen-bonded silanol groups is a necessary condition for effective adsorption activity on silica gel surface.51It can be seen from Fig. 7 that the absorption peaks of NIR bands of all samples are three regions, which are about 4500 cm−1, 5200 cm−1 and 7000 cm−1. Table 5 summarizes the main attributions of hydration vibration of different colored opal samples in the near infrared region of 8000–4000 cm−1. The peak at 4320 cm−1 is corresponding to bending vibration in siloxane (Si–O–Si) and 4500 cm−1 corresponds to stretching vibration of OH in hydrogen-bonded silanol (Si–OH) and free silanol. The peak at 5060 cm−1 was caused by water molecules bound to silanol groups, while 5230 cm−1 is corresponding to the absorption of free water molecules, which is caused by the bending and stretching vibration of water molecules. The absorption peak around 5200 cm−1 has been proved to distinguish Opal-A and Opal-CT. The wavenumber of Opal-A is generally greater than 5245 cm−1, while Opal-CT was significantly lower than 5240 cm−1.12,52 For Opal-CT, the absorption peak intensity at 5200 cm−1 is lower than 5240 cm−1, which is consistent with the study of Langer and Flörke.12 Bending and stretching vibrations of OH in molecular water and hydrogen-bonded silanol are corresponding to 6830 cm−1 and 7060 cm−1.51,53 The wavenumber from to 6830 cm−1 and 7060 cm−1 is the combination tone of the vibration in the mid-infrared region. When the peak in this range changes from double peaks to single peak, it indicates a higher degree of hydrogen bonding.54–56 The red and blue shift of individual peaks may be due to the difference of microstructure.
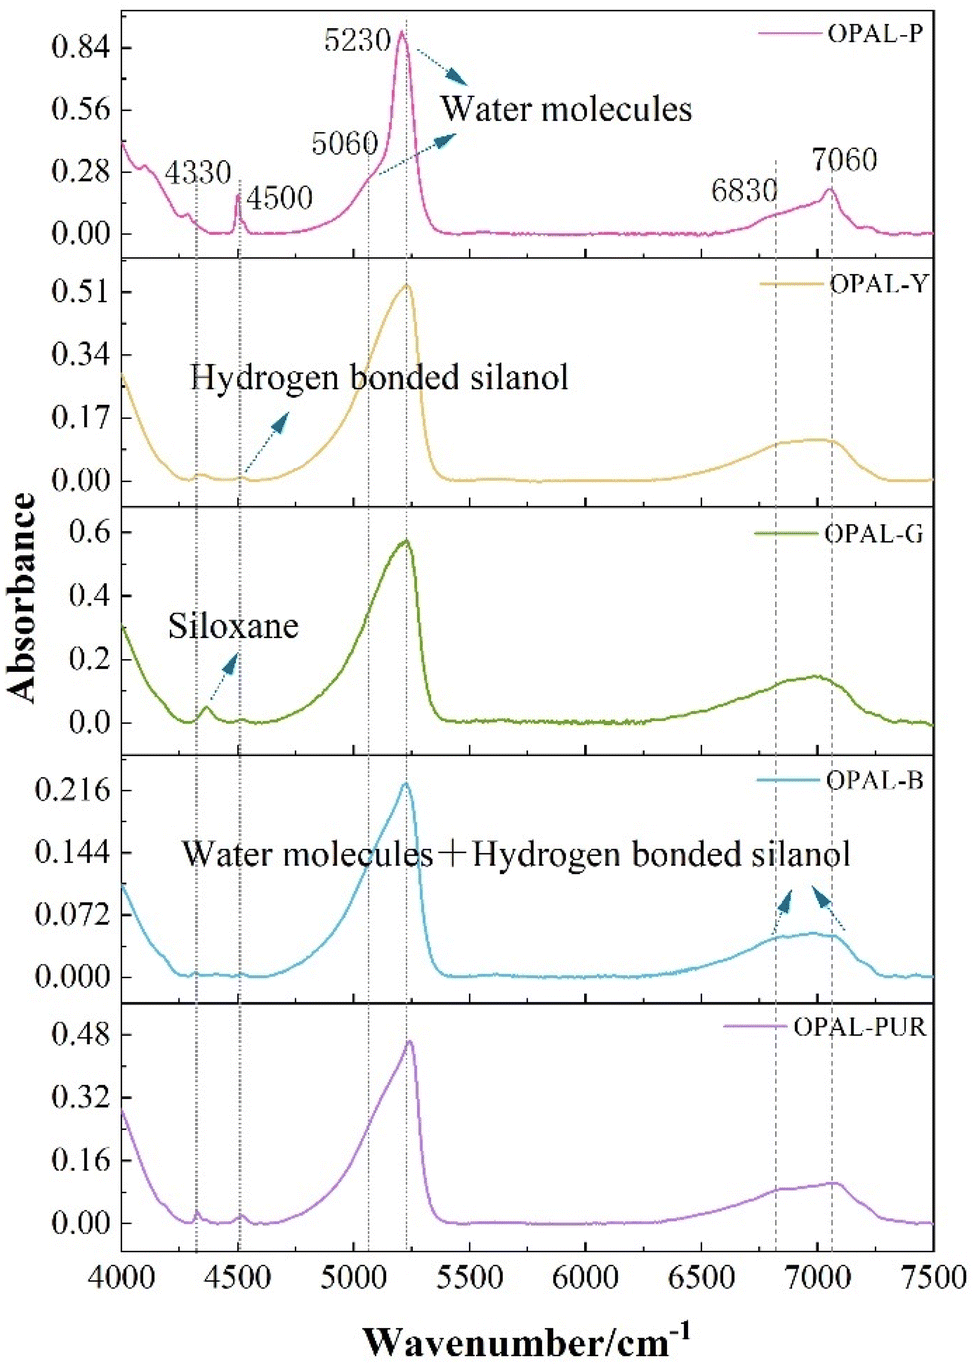 | ||
| Fig. 7 Near infrared images of opals of different colors. | ||
| Peak (cm−1) | Band assignment |
|---|---|
| 4320 | Siloxane (Si–O–Si) bending |
| 4500 | Si–OH and siloxane (Si–O–Si) bending |
| 5060 | Water molecules hydrogen bonded to silanol groups bending or stretching |
| 5230 | Free water molecules bending or stretching |
| 6830 | The combination tone of molecular water and silanol groups bending or stretching |
| 7060 |
The adsorption degree of opal depends on the number of silanol and the proportion of free silanol. The higher the content of silanol groups, the stronger the adsorption capacity. The formation of silanol groups may depend on the depth of occurrence of mineral and the proximity of other free silanol groups on the surface.16 Generally speaking, the water in opal is composed of molecular water (H2Omol) and silanols (H2OSiOH), and the total water content has been measured by TG. But the distribution and content of water molecules (H2Omol) and silanols (H2OSiOH) in each sample cannot be determined. The absorption bands of molecular water (H2Omol) (5200 cm−1) and silanols (H2OSiOH) (4500 cm−1) in the near infrared region do not overlap. The water content of the two forms can be semi-quantitatively calculated according to these two peaks.57,58 3400 cm−1 and 3700 cm−1 in the mid-infrared region are caused by the stretching vibration of OH in water and silicone water,12,57,59,60 but for minerals with water content greater than 2%, the absorption peaks are unstable and is not suitable for calculation.61–63 Therefore, the peak of 5200 cm−1 and 4500 cm−1 is used to semi-quantitatively calculate the water content in opal.
Lambert–Beer law is the basis of quantitative relationship between absorption intensity and absorption substance concentration. The concentrations of H2OSiOH and H2Omol were calculated using the Lambert–Beer law (Table 6):
| w = [18.02 × Abs/(d × ρ × ε)] × 100%, | (1) |
| Sample | TG analyses | FTIR analyses | ||
|---|---|---|---|---|
| H2Ototal wt% | H2Omol wt% | H2OSiOH wt% | H2Ototal wt% | |
| Opal-P | 8.78 | 7.03 | 2.04 | 9.07 |
| Opal-Y | 3.06 | 3.13 | 0.07 | 3.19 |
| Opal-G | 4.94 | 5.02 | 0.12 | 5.15 |
| Opal-B | 4.03 | 4.20 | 0.08 | 4.18 |
| Opal-Pur | 4.25 | 4.19 | 0.27 | 4.41 |
Summary of analytical results obtained by TG and FT-NIR analyses of opal samples is shown in Table 6. Although there are some errors in the total water content and TG test results of NIR test, the changing trend of water content in opal samples is consistent. Potential errors in the FT-NIR analyses may be related to the porosity of the sample, light transmission through the sample, sample thickness and extinction coefficient. The error in this paper is within the range of ±5% for the determination of water content by NIR test. Therefore, the results are still reliable. The content of water molecules (H2Omol) in all opal samples are higher than that of silanols (H2OSiOH), so most of the water in opal is composed of molecular water. These molecular waters (H2Omol) do not participate in structural construction, exist on the surface, interstitial or in the form of hydrogen-bonded water molecules (H2Omol). Silanols (H2OSiOH) are a necessary condition for opal to adsorb, so the higher the amount of silanols (H2OSiOH), the higher the amount of adsorbed water. The silanols (H2OSiOH) of Opal-P are the highest, which is caused by the presence of palygorskite. The surface area and adsorption of clay minerals are relatively large, so the water content for Opal-P is the highest, which is consistent with the TG results. Opal-Pur contains a lot of CaF2, and the presence of Ca2+ will bond more water molecules (H2Omol).49,50 Because of the large gap between its structural particles, Opal-G can store water molecules (H2Omol), which leads to more silanols (H2OSiOH). The structure of Opal-B is a fused sphere, and these spherical polymers form gaps between which water molecules (H2Omol) are stored.
4. Conclusions
The structure and water content of five different colored opals were systematically studied in this work. The results showed that all the samples belonged to Opal-CT type. However, there are still some microscopic differences among different color samples. Pink opal is composed of palygorskite fibers with a diameter of 0.05–0.1 μm. Palygorskite has a large specific surface area, which leads to the most water content for pink opal. Yellow opal contains cloudy inclusions and a relatively homogeneous texture. Green opal has a massive microstructure and a large gap between particles. SiO2 microspheres with diameters of 1–2 μm can be seen in some areas of blue opal, and the spheres are all fused with each other. Purple opal is colored by purple fluorite, which shows green fluorescence under long and short wavelength of UV lamp. Purple opal contains more water molecules due to the action of Ca2+. The total water content of all samples is ranging from 3.06 to 8.78%. When heated to 1000 °C, the thermal decomposition process of all samples can be divided into four stages, and most of the water in the samples is lost below 650 °C. In addition, this paper introduces the semi-quantitative calculation by using Lambert–Beer law to calculate the content of water molecules (H2Omol) and silanols (H2OSiOH) in opals of different colors. The results show that water in five different colored opals mainly exists in the form of molecular water (H2Omol), and the content of silanols (H2OSiOH) is less than that of molecular water (H2Omol). This study brings new data to the understanding of the hydration state of colored opal, especially with respect to content of different forms of water in colored opals.Author contributions
Niu Li: data collection, writing – original draft; Qingfeng Guo: analysis, review and editing, supervision; Qianqian Wang: software; Libing Liao: data curation; all authors have read and approved the final manuscript.Conflicts of interest
The authors declare that they have no known competing financial interests or personal relationships that could have appeared to influence the work reported in this paper.Acknowledgements
Thanks to the School of Gemmology, China University of Geoscience, Beijing.References
- R. K. Iler, The occurrence, dissolution, and deposition of Silica, 1979 Search PubMed.
- M. Liesegang, R. Milke and C. Kranz, et al., Silica nanoparticle aggregation in calcite replacement reactions, Sci. Rep., 2017, 7(1), 14550 CrossRef PubMed.
- X. Younan, B. Gates and Y. Yadong, et al., Monodispersed colloidal spheres. Old materials with new applications, Adv. Mater., 2000, 12(10), 693–713 CrossRef.
- I. Levin and E. Ott, X-Ray Study of Opals, Silica Glass and Silica Gel, Z. Kristallogr. Cryst. Mater., 1933, 85(1), 305–318 CrossRef CAS.
- J. W. Greig, The Existence of the High-Temperature Form of Cristobalite at Room Temperature and the Crystallinity of Opal, J. Am. Chem. Soc., 1932, 54(7), 2846–2849 CrossRef CAS.
- R. B. Sosman, The inversion of cristobalite, J. Am. Chem. Soc., 1932,(7), 3015–3016 CrossRef CAS.
- C. V. Raman and A. Jayaraman, The structure of opal and the origin of its iridescence, Proc. Math. Sci., 1953, 38(2), 101–108 CrossRef.
- O. W. Flörke, Zur Frage des “Hoch-Cristobalit” in Opalen, Bentoniten und Glasern, Neues Jahrb. Mineral., Monatsh., 1955, 217–244 Search PubMed.
- C. L. Garavelli, Ordine e disordine opali, Atti Soc. Toscana Sci. Nat. Pisa, Mem., Ser. A, 1964, 71, 133–186 Search PubMed.
- J. B. Jones and E. R. Segnit, The nature of opal I. nomenclature and constituent phases, J. Geol. Soc. Aust., 1971, 18(1), 57–68 CrossRef CAS.
- J. B. Hannay, IV.—Examination of the Hydrous Constituent in Minerals, Mineral. Mag. J. Mineral. Soc., 1877,(4), 106–109 CrossRef.
- K. Langer and O. W. Flörke, Near infrared absorption spectra (4000–9000 cm−1) of opals and the role of water in these SiO2·nH2O minerals, Fortschr Miner., 1974, 52, 17–51 CAS.
- B. Chauviré and P. S. Thomas, DSC of natural opal: insights into the incorporation of crystallisable water in the opal microstructure, J. Therm. Anal. Calorim., 2020, 140(5), 2077–2085 CrossRef.
- B. Chauvire, C. Boris and B. Rondeau, et al., Near infrared signature of opal and chalcedony as a proxy for their structure and formation conditions, Eur. J. Mineral., 2017, 29, 409–421 CrossRef CAS.
- P. S. Thomas, et al., Water and hydrogen release from perlites and opal, J. Therm. Anal. Calorim., 2014, 120, 95–101 CrossRef.
- M. Boboň, A. A. Christy and D. Kluvanec, et al., State of water molecules and silanol groups in opal minerals: a near infrared spectroscopic study of opals from Slovakia, Phys. Chem. Miner., 2011, 38(10), 809–818 CrossRef.
- A. Smallwood, P. S. Thomas and A. S. Ray, et al., Application of a Fickian model of diffusion to the dehydration of graded specimens of a precious Australian sedimentary opal derived from Coober Pedy, J. Therm. Anal. Calorim., 2009,(2), 685–688 CrossRef CAS.
- R. Day and B. Jones, Variations in water content in opal-A and opal-CT from geyser discharge aprons, J. Sediment. Res., 2008,(4), 301–315 CrossRef CAS.
- J. H. Anderson and K. A. Wickersheim, Near infrared characterization of water and hydroxyl groups on silica surfaces, Surf. Sci., 1964, 2, 252–260 CrossRef CAS.
- S. G. Bush and J. W. Jorgenson, Confirmation and application of transmission near infrared absorption technique for absolute quantitation of functional groups on silica gel, J. Chromatogr. A, 1990, 503(1), 69–91 CrossRef CAS.
- C. Ghisoli, F. Caucia and L. Marinoni, XRPD patterns of opals: a brief review and new results from recent studies, Powder Diffr., 2010, 25(3), 274–282 CrossRef CAS.
- E. Fritsch, E. Gaillou and M. Ostroumov, et al., Relationship between nanostructure and optical absorption in fibrous pink opals from Mexico and Peru, Eur. J. Mineral., 2004, 16(5), 743–751 CrossRef CAS.
- B. M. Laurs and N. D. Renfro, Yellowish Green to Yellow Opal from Brazil, J. Gemmol., 2018,(3), 188–189 Search PubMed.
- J. Štubňa and R. Hanus, Yellow Opal from Tanzania, J. Gemmol., 2020, 1, 10–11 CrossRef.
- F. Caucia, C. Ghisoli and I. Adamo, et al., Opal-C, opal-CT & opal-T from Acari, Peru, Aust. Gemmol., 2008, 6, 266–271 Search PubMed.
- A. Brajkovic, V. Rolandi and P. Vignola, et al., Blue and Pink Opals from Acari, Peru – Their optical, structural and spectroscopic features, Aust. Gemmol., 2007, 23, 3–15 CAS.
- F. Caucia, L. Marinoni and A. Leone, et al., New physical, geochemical and gemological data of opals from Acari Mine (Arequipa Department, Peru), Neues Jahrb. Mineral., Abh., 2015, 192(1), 73–84 CAS.
- M. Hatipoglu, Y. Kibici and G. Yanik, et al., Nano-structure of the cristobalite and tridymite stacking sequences in the common purple opal from the Gevrekseydi deposit, Seyitömer-Kütahya, Turkey, Orient. J. Chem., 2015, 31(1), 35–49 CrossRef.
- E. Fritsch, B. Mocquet and B. Williams, et al., Purple Fluorite in Opal from Utah, USA, J. Gemmol., 2019,(5), 404–407 Search PubMed.
- M. J. Wilson, J. D. Russell and J. M. Tait, A new interpretation of the structure of disordered α-cristobalite, Contrib. Mineral. Petrol., 1974, 47(1), 1–6 CrossRef CAS.
- D. K. Smith, Evaluation of the detectability and quantification of respirable crystalline silica by X-ray powder diffraction methods, Powder Diffr., 1997, 12(4), 200–227 CrossRef CAS.
- N. R. Herdianita, P. R. L. Browne and K. A. Rodgers, et al., Mineralogical and textural changes accompanying ageing of silica sinter, Miner. Deposita, 2000, 35(1), 48–62 CrossRef CAS.
- D. E. White, R. A. Hutchinson and T. E. C. Keith, The Geology and Remarkable Thermal Activity of Norris Geyser Basin, Yellowstone National Park, Wyoming, Professional Paper, 1988 Search PubMed.
- O. W. Flörke, H. Graetsch and B. Martin, Nomenclature of Microcrystalline and Noncrystalline Silica Minerals, Based on, Neues Jahrbuch Fur Mineralogie-Abhandlungen, 1991, 163, 19–42 Search PubMed.
- F. A. Caucia, C. A. Ghisoli and I. B. Adamo, A study on the characteristics of some C- and CT-opals from Brazil, Neues Jahrb. Mineral., Abh., 2009,(3), 289–296 CAS.
- F. Caucia, L. Marinoni and V. Bordoni, et al., Physical and chemical properties of some italian opals, Period. Mineral., 2012,(1), 93–106 Search PubMed.
- F. Caucia, L. Marinoni and A. Leone, et al., Investigation on gemological, physical and compositional properties of some opals from Slovakia (Hungarian opals), Period. Mineral., 2013, 82(2), 251–261 Search PubMed.
- H. Graetsch, H. Gies and I. Topalović, NMR, XRD and IR study on microcrystalline opals, Phys. Chem. Miner., 1994, 21(3), 166–175 CrossRef CAS.
- S. Lee and H. F. Xu, Using powder XRD and pair distribution function to determine anisotropic atomic displacement parameters of orthorhombic tridymite and tetragonal cristobalite, Acta Crystallogr., Sect. B: Struct. Sci., Cryst. Eng. Mater., 2019, 75(2), 160–167 CrossRef CAS PubMed.
- F. Esenli, I. Kumbasar and V. Esenli, A study on the characteristics of some opals from Turkey, Neues Jahrb. Mineral., Monatsh., 2003,(4), 177–192 CrossRef CAS.
- F. Esenli, I. Kumbasar and R. H. Eren, et al., Characteristics of opals from Simav, Turkey, Neues Jahrb. Mineral., Monatsh., 2001, 97–113 CAS.
- M. Liesegang and F. Tomaschek, Tracing the continental diagenetic loop of the opal-A to opal-CT transformation with X-ray diffraction, Sediment. Geol., 2020, 398, 105603 CrossRef CAS.
- G. D. Guthrie and D. L. Bish, Modeling the X-ray diffraction pattern of opal-CT, Am. Mineral., 1995,(7–8), 869–872 CAS.
- J. García-Rivas, M. Río and E. García-Romero, et al., An insight in the structure of a palygorskite from Palygorskaja: some questions on the standard model, Appl. Clay Sci., 2017, 148, 39–47 CrossRef.
- W. C. Isphording, Discussion of the Occurrence and Origin of Sedimentary Palygorskite-Sepiolite Deposits, Clays Clay Miner., 1973, 21(5), 391–401 CrossRef CAS.
- H. A. Graetsch Structural Characteristics of Opaline and Microcrystalline Silica Minerals, Silica, 1994 Search PubMed.
- C. Ghisoli, Opals: characterization, nomenclature definition and proposal of a new varieties’ classification following the discovery of new materials in Peru, Scientifica Acta, 2008, 2, 27–34 Search PubMed.
- E. Fritsch, M. Ostrooumov and A. Barreau, et al., Mexican Gem Opals: nano-and micro-structure, origin of colour, comparison with other common opals of gemmological significance, Eleventh Annual V. M. Goldschmidt Conference, 2002, 3159 Search PubMed.
- J. A. Webb and B. L. Finlayson, Incorporation of Al, Mg, and water in opal-A; evidence from speleothems, Am. Mineral., 1987, 72, 1204–1210 CAS.
- Z. Karacik, S. C. Genc and F. Esenli, et al., The Gümüldür Fire Opal: Mode of Occurrence and Mineralogical Aspects, Turk. J. Earth Sci., 2011, 1, 99–114 Search PubMed.
- A. A. Christy, New insight into the surface functionalities and adsorption evolution of water molecules on silica gel surface: a study by second derivative near infrared spectroscopy, Vib. Spectrosc., 2010, 54(1), 42–49 CrossRef CAS.
- B. Chauviré, B. Rondeau and F. Mazzero, et al., The Precious Opal Deposit at Wegel Tena, Ethiopia: Formation Via Successive Pedogenesis Events, Can. Mineral., 2017, 55, 701–723 CrossRef.
- A. A. Christy, Near infrared spectroscopic characterisation of surface hydroxyl groups on hydrothermally treated silica gel, Int. J. Chem. Environ. Eng., 2011, 2, 27–32 CAS.
- H. Yamatera, B. Fitzpatrick and G. Gordon, Near infrared spectra of water and aqueous solutions, J. Mol. Spectrosc., 1964, 14(1), 268–278 CrossRef CAS.
- G. G. Litvan and R. S. Yamasaki, Simultaneous determination of the spectroscopic and adsorption isotherms of water on silica, Mater. Constr., 1972,(4), 199–207 CrossRef CAS.
- J. Workman, Practical Guide to Interpretive Near-Infrared Spectroscopy, Angewandte Chemie, 2008, 47, 4628–4629 CrossRef.
- S. Newman, E. M. Stolper and S. Epstein, Measurement of water in rhyolitic glasses; calibration of an infrared spectroscopic technique, Am. Mineral., 1986,(11–12), 1527–1541 CAS.
- D. M. Dodd and D. B. Fraser, Optical Determinations of OH in Fused Silica, J. Appl. Phys., 1966, 37(10), 3911 CrossRef CAS.
- H. Graetsch and O. W. Flörke, et al., The nature of water in chalcedony and opal-C from brazilian agate geodes, Phys. Chem. Miner., 1985, 12(5), 300–306 CrossRef CAS.
- P. L. King, T. W. Vennemann and J. R. Holloway, et al., Analytical techniques for volatiles: A case study using intermediate (andesitic) glasses, Am. Mineral., 2002,(8–9), 1077–1089 CrossRef CAS.
- G. R. Rossman, Vibrational spectroscopy of hydrous components, Rev. Mineral. Geochem., 1988,(1), 193–206 CAS.
- L. V. Danyushevsky, T. J. Falloon and A. V. Sobolev, et al., The H2O Content of Basalt Glasses from Southwest Pacific Back-ARC Basins, Earth Planet. Sci. Lett., 1993,(3–4), 347–362 CrossRef CAS.
- H. Graetsch, Structural characteristics of opaline and microcrystalline silica minerals, Rev. Mineral. Geochem., 1994,(1), 209–232 CAS.
| This journal is © The Royal Society of Chemistry 2022 |