 Open Access Article
A carbon nanotube-based textile pressure sensor with high-temperature resistance†
Yankun Chena,
Xue Yanb,
Yanlong Zhua,
Meng Cuia,
Lei Kongb,
Minxuan Kuang *a,
Xiuqin Zhang
 *a and
Rui Wanga
aBeijing Key Laboratory of Clothing Materials R & D and Assessment, Beijing Engineering Research Center of Textile Nanofiber, School of Materials Design & Engineering, Beijing Institute of Fashion Technology, Beijing 100029, China. E-mail: mxkuang@bift.edu.cn; clyzxq@bift.edu.cn
bScience and Technology on Advanced Functional Composites Laboratory, Aerospace Research Institute of Materials & Processing Technology, Beijing 100076, China
First published on 16th August 2022
Abstract
Textile pressure sensors capable of withstanding high temperatures have attracted increasing interest due to their potential applications in harsh conditions. In this work, a textile pressure sensor with high-temperature resistance was realized based on multi-wall carbon nanotubes (MWCNTs) and quartz fabrics. The textile pressure sensors exhibited low fatigue over 20![[thin space (1/6-em)]](https://www.rsc.org/images/entities/char_2009.gif) 000 cyclic loadings. Owing to the high-temperature resistance of MWCNTs and quartz fabrics, the textile sensor can work at temperatures up to 300 °C and can maintain good sensitivity after calcination at 900 °C in N2 for 30 min. This work provides a simple, facile, and inexpensive method for fabricating textile pressure sensors with high-temperature resistance.
000 cyclic loadings. Owing to the high-temperature resistance of MWCNTs and quartz fabrics, the textile sensor can work at temperatures up to 300 °C and can maintain good sensitivity after calcination at 900 °C in N2 for 30 min. This work provides a simple, facile, and inexpensive method for fabricating textile pressure sensors with high-temperature resistance.
Introduction
Smart textiles are capable of sensing changes in external conditions and responding on time.1 Flexible sensors are important parts of smart textiles. A flexible sensor usually has characteristics of good flexibility, and ductility, or even can adapt to the measurement of external stress signals on complex curved surfaces.2–4 Textile pressure sensors are one of the flexible electronic devices, which are realized by building electrical pressure sensors on textiles with various operation modes, including resistive,5–7 capacitive,8–10 triboelectric,11–13 and piezoelectric14–16 types. The main concerns for pressure-sensitive textiles focus on exploring new materials or developing novel structures to improve the pressure sensitivity, response speed, fatigue resistance, etc. For example, Wang et al. fabricated textile-based pressure sensors by the assembly of mask-assisted Ni-coating and CNT fabric. They demonstrated that the textile pressure sensor could detect various forces and vibrations, as well as monitor human pulse in real-time.17 Matusik et al. realized a smart textile for the study of human activities based on piezoresistive fibers, which was composed of a conductive stainless-steel core and a piezoresistive shell.18 Kim et al. demonstrated highly sensitive, conformable, and reliable ionic textile (i-textile) pressure sensors using sheath-core carbon nanotube (CNT) microyarns encapsulated with ionic thermoplastic polyurethane (i-TPU) dielectrics.19Although various textile pressure sensors have been developed, the reliability of pressure-sensitive textiles working in harsh environments such as at high temperatures is rarely reported. Smart textiles capable of working in harsh conditions of high temperatures have potential applications in extreme environments, including firefighting, aerospace, automotive, petroleum industry, geothermal, etc.20,21 For example, intelligent protective closings are designed to monitor the firefighter's physiological signal in the fire ground and send emergency signals to the command center. In these circumstances, the temperature can reach a few hundred degrees Celsius or higher. The sensors should be capable of withstanding high temperatures and still working after being exposed to high-temperature flames. A high-temperature-resistant sensing unit enables real-time monitoring of the systems, providing early warning signals of critical components before their failures.22,23 Ordinary intelligent textiles are usually based on natural fibers or synthetic fibers, such as cotton,24,25 polyester,26,27 spandex,28–30 and so on. These fibers hardly withstand a high temperature, resulting in the failure of the electronics on their surfaces. Inorganic materials, such as ceramics,31 silicon,32 and silicon carbide33 are commonly used to fabricate high-temperature-resistant electronics. However, these sensors are usually rigid and not compatible with textiles. To obtain a flexible pressure sensor capable of operating under high temperatures, Guo et al. designed a TiO2 nanofiber-based flexible sensor and demonstrated a reliable sensing performance at a high temperature of up to 370 °C.34 Xu et al. fabricated superelastic and pressure-sensitive aerogel sensors based on polyimide and reduced graphene oxide, which maintained stable piezoresistive performance at −50 °C, 100 °C, and 200 °C in air.35 In our previous work, we printed multiwall carbon nanotube (MWCNT)-based temperature and bending sensors for high-temperature-resistant intelligent textiles.36
CNTs have good conductivity and thermal stability, making them ideal candidates for high-temperature-resistant flexible electronics.37,38 For example, CNT fibers can retain conductivity in an extremely high temperature of up to 1100 °C in N2.39 CNT-based pressure sensors presented good sensitivity from 30 °C to 450 °C in a vacuum.40 These works advanced the research of high-temperature-resistant flexible electronics. However, the fabrication of textile pressure sensors for high-temperature applications remains challenging.
Here, we fabricated high-temperature-resistant textile pressure sensors by the face-to-face assembling of an MWCNT interdigitated electrode and an MWCNT connecting electrode on quartz fabrics. Due to the excellent thermal stability of quartz fabrics and MWCNTs, the textile pressure sensor exhibited good pressure responsiveness at 300 °C. It can adapt to cyclic pressures at various rates. After being calcinated at 900 °C in N2, the textile sensor maintained good cyclic pressure responsiveness over 10![[thin space (1/6-em)]](https://www.rsc.org/images/entities/char_2009.gif) 000 cycles. This work provides a simple and low-cost method for fabricating high-temperature-resistant smart textiles.
000 cycles. This work provides a simple and low-cost method for fabricating high-temperature-resistant smart textiles.
Experimental section
Experimental raw materials
The aqueous dispersion of MWCNTs (10.8 wt%, diameter > 50 nm, length < 10 μm) was purchased from XFNANO. The MWCNT dispersion was heated at 80 °C for 3 min, 5 min, 7 min, 10 min, 13 min to condense the dispersion. The solid content of the condensed MWCNTs dispersion was 12.8 wt%, 13.7 wt%, 20.9 wt%, 23.8 wt%, and 33.4 wt%, respectively. The plain-weaved quartz fabric was purchased from HENAN SHENJIU TIANHANG NEW MATERIALS CO., Ltd. The thread count of the quartz fabric is 20/cm × 20/cm. Silver pastes purchased from Imperial Scientific were used to connect the sensors and copper wires for electrical performance tests.Fabrication of sensors
The pressure sensor consists of an interdigitated electrode and a connecting electrode. The width of the interdigitated electrode is 1 mm, 2 mm, and 4 mm, respectively. The width of the connecting electrode is 4 mm. The MWCNT electrodes on the quartz fabrics were prepared by blade coating the aqueous dispersions of different viscosities with a template. The obtained MWCNT patterns were dried at 80 °C for 30 min.Characterization
The viscosity was measured on a cone plate rheometer (Brookfield DV2TLV). The morphology of MWCNTs was characterized by a scanning electron microscope (SEM) (FSM-7500F). Thermogravimetric analysis (TGA) was performed in the flow of air and nitrogen (N2) at a heating rate of 10 °C min−1 from 30 °C to 800 °C. X-ray photoelectron spectroscopy (XPS) analysis was performed using an ESCALAB250Xi XPS (Thermo Scientific) equipped with an Al Kα X-ray source to determine the chemical composition of the MWCNTs. The sheet resistance was measured on a four-point probes resistivity tester (Guangzhou 4-Probes Tech). The cyclic pressure-response measurements were performed on a set-up consisting of a motorized horizontal stage in combination with a source meter (Keithley 2450).Results and discussion
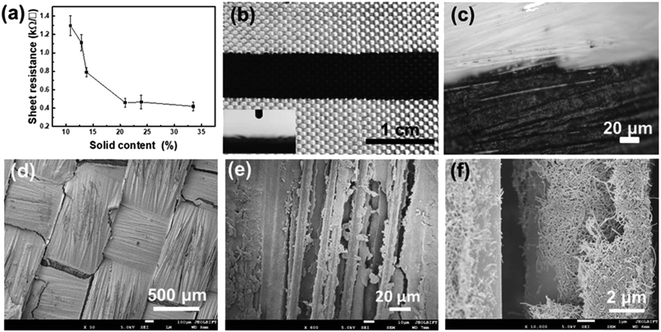
Table 1 shows that the viscosities of the MWCNT inks increased with the increasing solid contents. When the solid contents were high (e.g. 23.8 wt%), the viscosity was larger than 4000 mPa s, which was higher than that of the instrument's up limit. Solid content plays a critical role in blade-coating patterns with sharp edges. As shown in Fig. S1(a),† the inks with solid content lower than 13.7 wt% diffused obviously on the quartz fabrics, while the inks with higher solid content formed straight lines with sharp edges. During the blade coating process, the MWCNT inks penetrated from the surface to the inside of porous fabrics by a capillary process. Hollies et al. investigated this phenomenon to understand the fluid transportation in fiber bundles.41 Fibers in each yarn form capillary channels to absorb inks. Liquids with low viscosities are easier to diffuse between the channels driven by the capillary forces. After blade coating, the MWCNTs adhere to the fibers' surface and are immobilized inside of the bundles as the ink dries. Consequently, the MWCNTs form conductive paths between the fiber bundles. The conductivity of electrodes also was affected significantly by the MWCNT contents. Fig. 1a shows the sheet resistance of a single electrode fabricated by MWCNT inks with different solid contents. When the solid content was increased from 10.8 wt% to 20.9 wt%, the sheet resistance decreased obviously from 1.29 kΩ □−1 to 0.46 kΩ □−1. When the solid content further increased to 23.8 wt% and 33.4 wt%, the changing trend of sheet resistance became relatively gentle; it declined from 0.46 kΩ □−1 to 0.42 kΩ □−1. Because the viscous inks were more difficult to spread laterally, the MWCNT electrodes presented higher conductivity.| Solid content (%) | Viscosity (mPa s) |
|---|---|
| 10.8 | 355 |
| 12.8 | 394 |
| 13.7 | 617 |
| 20.9 | 3053 |
| 23.8 | >4000 |
| 33.4 |
Fig. 1b–f shows the optical microscope and SEM photos of the MWCNT electrodes printed from the inks with a solid content of 23.8 wt% on quartz fabrics. Because the quartz fabric was superhydrophilic (inserted in Fig. 1b), the MWCNT inks easily penetrated downward. The outlines of quartz fibers were observed on the surface (Fig. 1c and d), which indicated that the MWCNT inks penetrated into the porous fabrics. Additionally, a regular line with clear edges on the fabric surface was also observed for the MWCNT inks with higher solid contents, implying that lateral spreading was limited. The SEM images in Fig. 1d, e show that the MWCNTs covered the surfaces of quartz fibers. Although MWCNTs did not form a continuous and compacted film on the surface of the fabric, the detailed depositing morphology of the MWCNTs on fibers in Fig. 1f shows that MWCNTs contacted each other, forming continuous conductive paths.
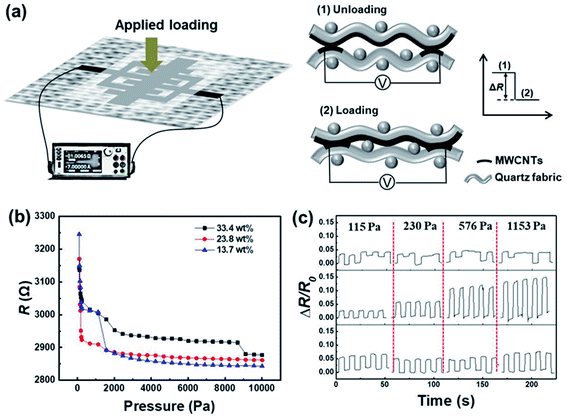
Fig. 2a illustrates the structure and the sensing mechanism of the MWCNTs-based textile pressure sensor. The pressure sensor in this work is a resistive sensor composed of an interdigitated electrode and a connecting electrode, which were prepared by blade coating MWCNT inks onto quartz fabrics. By face-to-face assembly of the interdigitated electrode and the connecting electrode, which functioned as the sensing layer and the electrode layer respectively, the pressure sensor was obtained. When the pressure is loaded, a deformation of the quartz fabrics will be caused and hence the contact area between the connecting electrode and the interdigitated electrode will increase. The increase in the contact area leads to increased conductive pathways between MWCNTs in the interdigitated electrode and the connecting electrode. Therefore, the resistance decreases when increasing the applied pressure.
The pressure responsiveness of the sensors prepared from inks with different solid contents was then tested. As shown in Fig. 2b, with increasing the applied pressure, the resistance dropped dramatically at first, then decreased slowly, and finally reached a constant value, presenting a pressure responsibility. We notice that there is no significant difference in the responsiveness caused by solid contents. Taking into account factors such as the degree of surface diffusion, sheet resistance, and pressure responsiveness, the MWCNT ink with a solid content of 23.8 wt% was used to fabricate electrodes and sensors in subsequent experiments. The pressure-sensitivity curve for the ink of 23.8 wt% can be divided into three regions. In the first region of ΔP < 240 Pa, the resistance value decreased rapidly with the increase of pressure. In the second region of 240–2800 Pa, the resistance decreased slowly with increasing pressures. When the pressure was higher than 2800 Pa, the resistance value decreased slightly, implying that the sensor was close to its upper responding limit. When ΔP > 2800 Pa, the connecting electrode and the interdigitated electrode were already in close contact, and the resistance was basically fixed. Therefore, it was difficult to change the resistance when larger pressure was applied. After the ink solid content was determined, the effect of the interdigitated electrode width on the pressure responsiveness was further explored. The interdigitated electrodes with widths of 1 mm, 2 mm, and 4 mm were printed and tested for pressure responsiveness. To better present the sensing performance, we calculated the relative resistance change (ΔR/R0), where R0 is the initial resistance and ΔR is calculated by R0–R. The results are shown in Fig. 2c. The sensor with an electrode width of 1 mm cannot respond effectively to pressure. The ΔR/R0 value did not vary with the applied pressures instantaneously. Sensors with 2 mm-width electrodes formed a stable response to the applied pressure. With increasing the pressure, ΔR/R0 increased gradually, exhibiting pressure responsibility. Further increasing the electrode width to 4 mm, ΔR/R0 varied with the applied pressures instantaneously. However, the ΔR/R0 value did not increase with the increased pressure. The above results indicate that the electrode width of 2 mm can be employed to prepare pressure sensors.
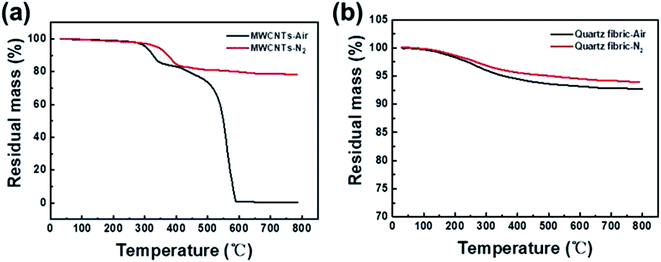
To investigate the sensing performance of the pressure sensors at high temperatures, we first carried out TGA tests on the dried MWCNT powders and the quartz fabric. It can be seen from Fig. 3a that the mass of MWCNTs started to drop at 300 °C and dropped to 85% of the initial mass at 350 °C in the air. After leveling the temperature to ∼400 °C, the quality began to decrease dramatically. When the temperature increased to 590 °C, the remaining mass fraction decreased to ∼0%. The main components of the MWCNT inks include MWCNTs and organic additives. When the temperature rises above 300 °C, the carboxylic groups on the MWCNT walls and the additives began to thermally decompose. Further increasing the temperature to ∼400 °C, MWCNTs started to oxidize. In contrast, the pyrolysis temperature of the carboxylic groups and the additives in the nitrogen atmosphere was much higher than that in the air atmosphere. As shown in Fig. 3a, the pyrolysis in the nitrogen atmosphere started at ∼350 °C. When the temperature was higher than 410 °C, the remaining mass fraction decreased very slowly and remained a mass fraction of 78% up to 800 °C, indicating that the MWCNTs are stable in an oxygen-free atmosphere at high temperatures. Fig. 3b shows the thermal stability of quartz fibers from 30 °C to 800 °C in the air and nitrogen atmosphere. The mass loss of the quartz fiber was about 7.3% and 6.2% in the air and in the nitrogen atmosphere respectively when the temperature was raised from 30 °C to 800 °C. The TGA results showed that the pressure sensors prepared from MWCNTs and quartz fabrics are possible to be applied under a high temperature of up to ∼300 °C in air and up to 800 °C in oxygen-free environments.
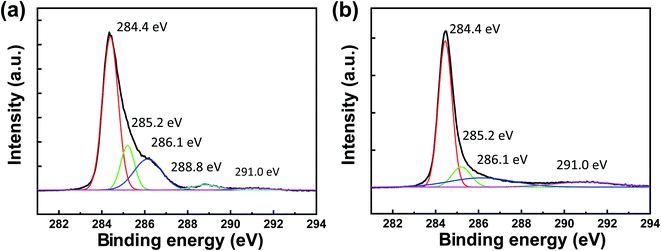
Fig. 4a shows the XPS spectrum in C1s region of the CNT powders before calcination. The C1s peaks were fit to five components: the components at 284.4 and 285.2 eV corresponded to the sp2 and sp3 carbons, respectively, in MWCNTs; 286.1 eV to C–OH bond; 288.8 eV corresponded to C![[double bond, length as m-dash]](https://www.rsc.org/images/entities/char_e001.gif) O bond; and the remaining peak of 291.0 eV corresponded to π–π* shakeup feature. Fig. 4b shows the XPS spectrum in C 1s region of the MWCNT powders after being calcinated at 600 °C in N2 for 30 min. The peaks at 284.4 and 285.2 eV corresponded to the sp2 and sp3 carbons, respectively, in the MWCNTs. The peak at 286.1 eV corresponded to the C–OH, which remained after calcination. It was found that the 288.8 eV peak which corresponded to C
O bond; and the remaining peak of 291.0 eV corresponded to π–π* shakeup feature. Fig. 4b shows the XPS spectrum in C 1s region of the MWCNT powders after being calcinated at 600 °C in N2 for 30 min. The peaks at 284.4 and 285.2 eV corresponded to the sp2 and sp3 carbons, respectively, in the MWCNTs. The peak at 286.1 eV corresponded to the C–OH, which remained after calcination. It was found that the 288.8 eV peak which corresponded to C![[double bond, length as m-dash]](https://www.rsc.org/images/entities/char_e001.gif) O bond disappeared and the shakeup peak at 290.1 eV was more pronounced after calcination. These changes could be attributed to the decomposition of the organic composites of the MWCNTs after calcination. The shakeup peak (290.1 eV) became more prominent due to the decarboxylation of the MWCNTs.
O bond disappeared and the shakeup peak at 290.1 eV was more pronounced after calcination. These changes could be attributed to the decomposition of the organic composites of the MWCNTs after calcination. The shakeup peak (290.1 eV) became more prominent due to the decarboxylation of the MWCNTs.
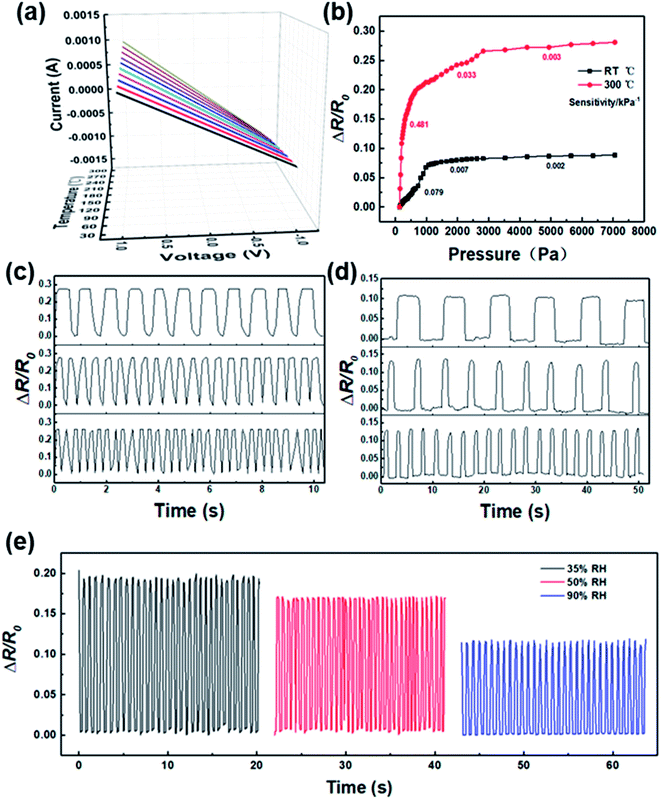
Fig. 5a shows the current versus voltage (I–V) curves of an MWCNT electrode at temperatures varied from 30 °C to 300 °C with an interval of 30 °C. It is found that the MWCNT electrode exhibited an excellent linear I–V characteristic at all temperatures. To investigate the sensing performance of the textile pressure sensor, I–V curves of the sensor at room temperature and 300 °C were measured (Fig. S2†). We calculated the ΔR/R0 values from the I–V curves. Fig. 5b shows that ΔR/R0 gradually increased with the increasing pressures both at room temperature and 300 °C. The pressure sensitivity is defined as S = (ΔR/R0)/ΔP. The sensor tested at 300 °C presented a low-pressure (0–590 Pa) sensitivity of 0.481 kPa−1, a middle-pressure (590–2800 Pa) sensitivity of 0.033 kPa−1, and a high-pressure (2800–7000 Pa) sensitivity of 0.003 kPa−1, which are higher than its sensitivity at room temperature. Compared with that at room temperature, the sensitivity at 300 °C was much higher. The sensor has better sensing performance in a high-temperature environment. The improvement in the sensing performance could be attributed to the increased conductivity of MWCNTs at a high temperature. As shown in Fig. S3,† the resistance of a single MWCNT electrode decreased from 1.562 kΩ to 1.016 kΩ as the temperature increased from 30 °C to 300 °C, exhibiting a semiconductor character. At a higher temperature, the contact resistance between MWCNTs decreases, which results in more conduction channels. Because the resistance variation of the sensor under pressure is mainly induced by the change of the contact resistance between MWCNTs, more conduction channels can improve the pressure sensitivity. Fig. 5c shows the cycling pressure response curves at various loading frequencies at room temperature. The resistance changed synchronously with the dynamic loadings at different loading frequencies. The resistance of the sensor recovered to its initial value when it was released from different loading frequencies, exhibiting stable pressure responses and insensitive to loading frequency. Taking advantage of the good thermal stability of the MWCNTs and the quartz fabrics, the pressure sensor also exhibited reliable pressure responding performance at an elevated temperature as expected. As shown in Fig. 5d, ΔR/R0 changed in accordance with the dynamical pressure at various loading frequencies at 300 °C. Fig. 5e shows the sensing performance in different humidity environments. The pressure sensor maintains good pressure sensing performance at 35% RH, 50% RH, and 90% RH. As the humidity increases, ΔR/R0 decreases gradually. This reduction could be attributed to the increased contact resistance at higher humidity.
The consistency of the results and the reliability are indispensable requirements for a sensor. In order to ensure the consistency of the results, all experiments in this work were performed at least three times on different samples. Remarkably, the textile pressure sensor exhibited a consistent response over 20![[thin space (1/6-em)]](https://www.rsc.org/images/entities/char_2009.gif) 000 compressive cycles, demonstrating high-performance stability and outstanding robustness (Fig. 6a). During the cyclic pressure tests, ΔR/R0 retained a consistent value of ∼0.28 without performance degradation. The high reliability under cyclic compression indicates that the MWCNTs/quartz fabric-based sensor is a promising candidate for long-term detecting pressure. Notably, the sensor can survive a calcination process with a high temperature of up to 900 °C. We calcinated the pressure sensor at 900 °C in N2 for 30 min and measured the responsibility for 20
000 compressive cycles, demonstrating high-performance stability and outstanding robustness (Fig. 6a). During the cyclic pressure tests, ΔR/R0 retained a consistent value of ∼0.28 without performance degradation. The high reliability under cyclic compression indicates that the MWCNTs/quartz fabric-based sensor is a promising candidate for long-term detecting pressure. Notably, the sensor can survive a calcination process with a high temperature of up to 900 °C. We calcinated the pressure sensor at 900 °C in N2 for 30 min and measured the responsibility for 20![[thin space (1/6-em)]](https://www.rsc.org/images/entities/char_2009.gif) 000 compressive cycles at room temperature. As shown in Fig. 6b, the calcinated pressure sensor exhibited a stable response over the first 10
000 compressive cycles at room temperature. As shown in Fig. 6b, the calcinated pressure sensor exhibited a stable response over the first 10![[thin space (1/6-em)]](https://www.rsc.org/images/entities/char_2009.gif) 000 compressive cycles. During the next 10
000 compressive cycles. During the next 10![[thin space (1/6-em)]](https://www.rsc.org/images/entities/char_2009.gif) 000 compressive cycles, the ΔR/R0 value also varied with the dynamic pressure but with an unsteady fluctuation. The sensing performance degradation may be due to the reduced structural robustness of the quartz fabric after being calcinated at a high temperature for a long time. Besides, both the uncalcinated and the calcinated sensors exhibited a stable dynamic response performance at various frequencies (Fig. S4 and S5†). The results of the above compression tests show that the textile pressure sensor gives reliable and reversible resistance signals in response to applied dynamic pressures at room temperature, 300 °C, and after calcination at 900 °C, indicating its potential applications at elevated temperatures.
000 compressive cycles, the ΔR/R0 value also varied with the dynamic pressure but with an unsteady fluctuation. The sensing performance degradation may be due to the reduced structural robustness of the quartz fabric after being calcinated at a high temperature for a long time. Besides, both the uncalcinated and the calcinated sensors exhibited a stable dynamic response performance at various frequencies (Fig. S4 and S5†). The results of the above compression tests show that the textile pressure sensor gives reliable and reversible resistance signals in response to applied dynamic pressures at room temperature, 300 °C, and after calcination at 900 °C, indicating its potential applications at elevated temperatures.
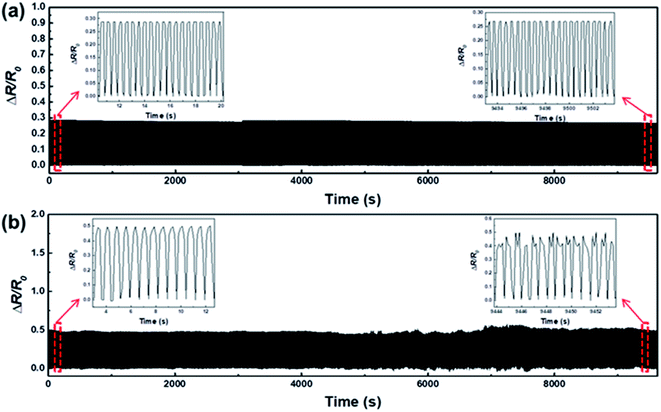 | ||
| Fig. 6 Fatigue performance of the textile pressure sensor. (a) Cyclic pressure test for the uncalcinated sample, (b) cyclic pressure test for the sample after calcination at 900 °C in N2 for 30 min. | ||
Fig. S6† shows the sensing performance of the pressure sensor after being soaked in water for 40 h. The soaked pressure sensor exhibited good sensing performance both at room temperature and 300 °C. The ΔR/R0 value increased with the increasing pressures and changed synchronously with the dynamic loadings. When pressure load was released, the resistance of the sensor recovered to its initial value. Fig. S7† shows that the soaked textile pressure sensor maintained a consistent response over 20![[thin space (1/6-em)]](https://www.rsc.org/images/entities/char_2009.gif) 000 compressive cycles and exhibited a stable dynamic response performance at various frequencies. The above results demonstrated that the sensing performance of the textile sensor did not degrade obviously after immersion in water.
000 compressive cycles and exhibited a stable dynamic response performance at various frequencies. The above results demonstrated that the sensing performance of the textile sensor did not degrade obviously after immersion in water.
Table 2 summarized the materials and performance of our sensor and other pressure sensors in the literature. The pressure sensor in this work has advantages in high-temperature resistance, facile fabrication, and flexibility.
| Device type | Conductive materials | Device preparation | Flexibility | Sensitivity | Stability | Temperature resistance (°C) | Ref. |
|---|---|---|---|---|---|---|---|
| Resistive | MWCNTs | Simple | Yes | 0.481 kPa−1 | 20![[thin space (1/6-em)]](https://www.rsc.org/images/entities/char_2009.gif) 000 cycles 000 cycles |
900 | This work |
| Capacitance | AgNWs | Complicate | Yes | 4.4 kPa−1 | 50![[thin space (1/6-em)]](https://www.rsc.org/images/entities/char_2009.gif) 000 cycles 000 cycles |
370 | 34 |
| Piezoelectric | Cu | Complicate | Yes | 0.523 mV/psi | Not available | 350 | 42 |
| Resistive | CNT | Simple | No | 0.16 (450 °C) | Not available | 450 | 43 |
| Piezoelectric | SOI | Complicate | No | ±0.50% FSO | 62 h | 400 | 44 |
| Capacitance | 4H-SiC | Complicate | No | 18.7 fF kPa−1 | Not available | 600 | 45 |
Conclusions
In this work, we prepared textile pressure sensors with high-temperature resistance based on MWCNTs and quartz fabrics. Owing to the excellent high-temperature resistance of quartz fabrics and MWCNTs, the textile pressure sensors are capable of working at an elevated temperature of 300 °C. The textile pressure sensors exhibited low fatigue over 20![[thin space (1/6-em)]](https://www.rsc.org/images/entities/char_2009.gif) 000 cyclic loading. After calcination at 900 °C in N2 for 30 min, the sensor exhibited reasonable responsive performance during 20
000 cyclic loading. After calcination at 900 °C in N2 for 30 min, the sensor exhibited reasonable responsive performance during 20![[thin space (1/6-em)]](https://www.rsc.org/images/entities/char_2009.gif) 000 cyclic loading. We anticipate that this work could advance smart textiles for applications in high-temperature conditions.
000 cyclic loading. We anticipate that this work could advance smart textiles for applications in high-temperature conditions.
Author contributions
The manuscript was written through contributions of all authors. All authors have given approval to the final version of the manuscript.Conflicts of interest
The authors declare no conflict of interest.Acknowledgements
This work was financially supported by the National Natural Science Foundation of China (52173027), the Science and Technology Plan of Beijing Municipal Education Commission (KM202110012008), the Foundation for High-Level Teachers in Beijing Institute of Fashion Technology (BIFTXJ202224), and the Beijing Scholars Program (RCQJ20303).Notes and references
- J. D. Shi, S. Liu, L. S. Zhang, B. Yang, L. Shu, Y. Yang, M. Ren, Y. Wang, J. W. Chen, W. Chen, Y. Chai and X. M. Tao, Adv. Mater., 2019, 32, 1901958 CrossRef PubMed.
- T. Z. Hong, T. Z. Shen, J. L. Yang, Y. C. Sun, J. M. Zhang, H. Y. Pan, Y. Hong, Y. Wang, S. Chen, Y. Zhao and C. F. Guo, Int. J. Smart Nano Mater., 2020, 11, 1–10 CrossRef.
- X. J. Wang, H. Li, T. Y. Wang, X. Niu, Y. Wang, S. Y. Xu, Y. M. Jiang, L. Chen and H. Liu, RSC Adv., 2022, 12, 14190 RSC.
- M. Y. Jung, S. H. Jeon and J. Y. Boe, RSC Adv., 2018, 8, 39992–39999 RSC.
- Y. C. Lai, B. W. Ye, C. F. Lu, C. T. Chen, M. H. Jao, W. F. Su, W. Y. Hang, T. Y. Lin and Y. F. Chen, Adv. Funct. Mater., 2016, 26, 1286–1295 CrossRef CAS.
- X. Y. Hou and C. F. Guo, Acta Physica Sinica, 2020, 69, 70–85 Search PubMed.
- Y. Zhang, Y. G. Hu, P. L. Zhu, F. Han, Y. Zhu, R. Sun and C. P. Wong, ACS Appl. Mater. Interfaces, 2017, 9, 35968–35976 CrossRef CAS PubMed.
- D. A. D. S. Simão, M. Murad, C. Martins, V. C. Fernandes, K. M. Captein and A. L. Teixeira, Revista Dor, 2015, 16, 215–220 CrossRef.
- R. Y. Li, Y. Si, Z. J. Zhu, Y. J. Guo, Y. J. Zhang, N. Pan, G. Sun and T. R. Pan, Adv. Mater., 2017, 29, 1700253 CrossRef PubMed.
- R. H. Wu, L. Y. Ma, C. Hou, Z. H. Meng, W. X. Guo, W. D. Yu, R. Yu, F. Hu and X. Y. Liu, Small, 2019, 15, 1901558 CrossRef PubMed.
- X. Pu, M. M. Liu, X. Y. Chen, J. M. Sun, C. H. Du, J. Y. Zhai, W. G. Hu and Z. L. Wang, Sci. Adv., 2017, 3, e1700015 CrossRef PubMed.
- P. K. Yang, Z. H. Lin, K. C. Pradel, L. Lin, X. H. Li, X. N. Wen, J. H. He and Z. L. Wang, ACS Nano, 2015, 9, 901–907 CrossRef CAS PubMed.
- M. Y. Ma, Z. Zhang, Q. L. Liao, F. Yi, L. H. Han, G. J. Zhang, S. Liu, X. Q. Liao and Y. Zhang, Nano Energy, 2017, 32, 389–396 CrossRef CAS.
- J. S. Lee, K. Y. Shin, O. J. Cheong, J. H. Kim and J. Jang, Sci. Rep., 2015, 5, 1–8 Search PubMed.
- M. T. Chorsi, E. J. Curry, H. T. Chorsi, R. Das, J. Baroody, P. K. Purohit, H. Ilies and T. D. Nguyen, Adv. Mater., 2019, 31, 1802084 CrossRef PubMed.
- Y. R. Wang, J. M. Zheng, G. Y. Ren, P. H. Zhang and C. Xu, Smart Mater. Struct., 2011, 20, 045009 CrossRef.
- M. M. Liu, X. Pu, C. Y. Jiang, T. Liu, X. Huang, L. B. Chen, C. H. Du, J. G. Sun, W. G. Hu and Z. L. Wang, Adv. Mater., 2017, 29, 1703700 CrossRef PubMed.
- Y. Y. Luo, Y. Z. Li, P. Sharma, W. Shou, K. Wu, M. Foshey, B. C. Li, T. Palacios, A. Torralba and W. Matusik, Nat. Electron., 2021, 4, 193–201 CrossRef.
- S. Y. Kim, E. S. Jee, J. S. Kim and D. H. Kim, RSC Adv., 2017, 7, 23820 RSC.
- Z. Li, S. Khuje, A. Chivate, Y. L. Huang, Y. Hu, L. An, Z. F. Shao, J. Y. Wang, S. Q. Chang and S. Q. Ren, ACS Appl. Electron. Mater., 2020, 2, 1867–1873 CrossRef CAS.
- A. Al-zubaidi, N. Asai, Y. Ishii and S. Kawasaki, RSC Adv., 2020, 10, 41209–41216 RSC.
- D. J. Young, J. Du, C. A. Zorman and W. H. Ko, IEEE Sens. J., 2004, 4, 464–470 CrossRef CAS.
- M. A. Fonseca, J. M. English, M. Von Arx and M. G. Allen, J. Microelectromech. Syst., 2002, 11, 337–343 CrossRef.
- A. Rasheed, Fibers for Technical Textiles, 2020, pp. 49–64 Search PubMed.
- R. M. Laing, SN Appl. Sci., 2019, 1, 1–8 CAS.
- T. Sabir, High-performance apparel, 2018, 7–32 Search PubMed.
- J. Hu, M. A. Jahid, N. Harish Kumar and V. Harun, Handbook of Fibrous Materials, 2020, 1–36 Search PubMed.
- L. M. Castano and A. B. Flatau, Smart Mater. Struct., 2014, 23, 053001 CrossRef CAS.
- D. Kongahage and J. Foroughi, Fibers, 2019, 7, 21 CrossRef CAS.
- A. Quye, Polym. Degrad. Stab., 2014, 107, 210–218 CrossRef CAS.
- A. Sharif, C. L. Gan and Z. Chen, Microelectron. Reliab., 2014, 54, 2905–2910 CrossRef CAS.
- G. Li, E. M. Song, G. S. Huang, Q. G. Guo, F. Ma, B. Zhou and Y. F. Mei, Adv. Funct. Mater., 2018, 28, 1801448 CrossRef.
- N. Zhang, C. M. Lin, D. G. Senesky and A. P. Pisano, Appl. Phys. Lett., 2014, 104, 073504 CrossRef.
- M. Fu, J. M. Zhang, Y. I. Jin, Y. Zhao, S. Y. Huang and C. F. Guo, Adv. Sci., 2020, 7, 2000258 CrossRef CAS PubMed.
- Q. Xu, X. H. Chang, Z. D. Zhu, L. Xu, X. C. Chen, L. B. Luo, X. Y. Liu and J. Q. Qin, RSC Adv., 2021, 11, 11760 RSC.
- X. Y. Peng, X. Q. Zhang, R. Wang, Y. K. Chen, X. M. Chu, L. Kong, X. Yan and M. X. Kuang, ACS Appl. Electron. Mater., 2022, 4, 1949–1957 CrossRef CAS.
- W. Gao, N. Komatsu, L. W. Taylor, G. V. Naik, K. Yanagi, M. Pasquali and J. Kono, J. Phys. D: Appl. Phys., 2019, 53, 063001 CrossRef.
- W. H. Chiang, G. L. Chen, C. Y. Hsieh and S. C. Lo, RSC Adv., 2015, 5, 97579–97588 RSC.
- X. S. Zhang, L. W. Yang and H. T. Liu, Appl. Phys. Lett., 2018, 112, 164103 CrossRef.
- S. I. Ahn, Mater. Lett., 2020, 268, 127643 CrossRef CAS.
- N. R. Hollies, M. M. Kaessinger, B. S. Watson and H. Bogaty, Text. Res. J., 1957, 27, 8–13 CrossRef.
- N. Kim, Y. L. Chang, J. Chen, T. Barbee, W. Wang, J. Y. Kim, M. K. Kwon, S. Shervin, M. Moradnia, S. Pouladi, D. Khatiwada, V. Selvamanickam and J. H. Ryou, Sens. Actuators, A, 2020, 111940 CrossRef CAS.
- S. I. Ahn, Mater. Lett., 2020, 127643 CrossRef CAS.
- A. Giuliani, L. Drera, D. Arancio, B. Mukhopadhyayb and H. Ngo, ScienceDirect, 2014, 11, 720–723 Search PubMed.
- Z. W. Cao, Y. G. Yin, J. Xu, S. M. Zhang and J. B. Zou, Nanotechnol. Precis. Eng., 2015, 13, 179–185 Search PubMed.
Footnote |
| † Electronic supplementary information (ESI) available. See https://doi.org/10.1039/d2ra04036k |
| This journal is © The Royal Society of Chemistry 2022 |

