 Open Access Article
A resistive sensor for humidity detection based on cellulose/polyaniline†
Ilaria Ragazzinia,
Riccardo Castagnolia,
Isacco Gualandi *abc,
Maria Cristina Cassani
 ab,
Daniele Nanni
 a,
Francesca Gambassia,
Erika Scavettaabc,
Elena Bernardiac and
Barbara Ballarin
 *abc
*abc
aDepartment of Industrial Chemistry “Toso Montanari”, Bologna University, UdR INSTM Bologna, Via Risorgimento 4, I-40136, Bologna, Italy. E-mail: barbara.ballarin@unibo.it; isacco.gualandi2@unibo.it; Tel: +390512093704 Tel: +390512093386
bCenter for Industrial Research-Advanced Applications in Mechanical Engineering and Materials Technology CIRI MAM University of Bologna, Viale del Risorgimento 2, I-40136 Bologna, Italy
cCenter for Industrial Research-Fonti Rinnovabili, Ambiente, Mare e Energia CIRI FRAME University of Bologna, Viale del Risorgimento 2, I-40136 Bologna, Italy
First published on 4th October 2022
Abstract
Ambient humidity is an important parameter that affects the manufacturing and storage of several industrial and agricultural goods. In the view of the Internet of Things (IoT), single sensors could be associated with an object for smart monitoring enabling optimum conditions to be maintained. Nevertheless, the production of cost-effective humidity sensors for indoor and outdoor environmental monitoring currently represents the main bottleneck in the development of this technology. Herein we report the results obtained with sensors exclusively made of cellulose and polyaniline (cell/PANI) under strictly controlled relative humidity (30–50 RH%) and temperature (21 ± 1 °C) achieved with a climatic chamber that simulates the conditions of indoor air humidity, and at different RH% in a lab test chamber set-up. Cell/PANI sensors, prepared with a simple, inexpensive, and easily scalable industrial paper process, show a linear trend with a slope of 1.41 μA RH%−1 and a percentage of sensitivity of 13%. Response time as well as percentage of sensitivity results are similar to those of a commercial digital-output relative humidity and temperature sensor (DHT22) employed in parallel for comparison. The commercial sensor DHT22 has a sensitivity of 14%. This low-cost sensor has potential applications in agriculture, food monitoring, and medical and industrial environments as a disposable sensor for humidity detection.
1. Introduction
Monitoring and controlling the ambient humidity are highly important in many industrial sectors, for example for food processing and packaging, drug manufacturing and storage, semiconductor fabrication, preservation of antiques and paintings, etc.1–3 Moreover, humidity is an essential criterion in many biological processes and can significantly influence people's health and physiological comfort.4,5 The widespread distribution of electronic devices connected to the internet has made it possible to exchange, share and process data in real-time by objects, giving life to the Internet of Things (IoT). Therefore, humidity monitoring may no longer be limited to closed environments, as is currently the case for museums, production plants and hospitals, but could be associated with a single object or person allowing custom-made actions to improve the efficiency of their management. For example, one-third of the food produced for human consumption ($990 billion) is wasted,6 with excess moisture being a major cause.7Sensors embedded in the packaging would detect spoilage conditions early, allowing the countermeasures to be taken to preserve the food. At the same time, humidity measurement can be used in health applications to evaluate the status of skin or to monitor the respiratory rate.5,8 The bottleneck in the development of these uses is the fabrication of transducers that can be embedded into and work in packaging or everyday objects because the commercially available humidity sensors can be hardly exploited due their high fabrication and maintenance costs, significant power adsorption and the high temperature employed for synthesis and/or operation.9 Beyond the obvious sensing ability, these devices should be low-cost and recyclable to be compatible with an eco-friendly large-scale production.3,10,11 Moreover, they should be flexible, lightweight, and deformable to have the features of the materials wherein they are embedded to preserve their functionality. A promising approach to face these challenges is the combination of the paper and conductive polymer that works as sensing elements.3,10,11
Polymer thin film-based humidity sensors have the advantages of large scale processability, flexibility and lightweight, and application over a wide range of substrate geometries. Conducting polymers (CP) such as polyaniline, polypyrrole, polythiophene, polycarbazole etc., exhibit unique electrical, electrochemical and optical properties. Polycarbazoles are mainly employed in the production of host materials in OLED, mainly in the form of poly(N-vinylcarbazole) because they exhibit a high energy blue-emissive singlet excited state and could act as electron donor and hole transporting material.12 Polypyrroles and polythiophenes are instead widely used in many applications due to the stabilization of radical cations in the aromatic system involving the hetero atoms.13 Among them, poly(3,4-ethylenedioxythiophene) has the 3,4 positions of aromatic system linked to oxygen atoms that ensures a boosting effect on the stability of the oxidized form without losing the electrical and electrochemical features.13 Among the different CPs, polyaniline (PANI) has been largely used due to its stability, possibility to control size and formation of hybrid structure. It is of great interest in device applications due to stability of doped/undoped states, ease of structural modification and solution processability.9,14–19 Its winning property is the simplicity of preparation that allows the functionalization of commonly used materials such as fabrics and paper.20–24 Moreover, when exposed to humidity the effective resistance of PANI film changes due to the formation of hydrogen bonds between water molecules and the nitrogen present in the amine group.17,25,26 The conductivity of PANI increases with increasing humidity due to continuous proton exchange and this makes PANI-based derivatives and composites attractive candidates for humidity sensing materials.3,9,17,19,26
In the past few years there was an improved interest in the paper electronics because of the economic advantages and the unique physical and chemical characteristics.11,27–29 Cellulose is a biopolymer composed by an intermolecular network of linear β-1,4-linked D-glucose units that is among the most abundant and widespread natural resources.30 Simple cellulosic substrate exhibits high surface-to-volume ratio, porous structure, flexibility, reasonably good physical and mechanical properties and lightweight. Paper based on cellulose is also an eco-friendly solution to produce economically sustainable disposable devices because it is easy to recycle, biodegradable and made from renewable resources.31 In addition, the paper industry exhibits a high maturity level when it is compared to the manufacturing of synthetic polymers, ceramics, glass, and silicon. It makes papers the least expensive material suitable for fabricating various devices. PANI and cellulose strongly interact thanks to the presence of hydrogen bonds between the hydroxyl groups of glucose and the repeating N-functionality in polyaniline that helps the paper modification and the preparation of composite materials.9,32,33 Since these interactions can affects the sensing behavior of polyaniline, several humidity sensors have been fabricated by exploiting these materials as reported in a recent review by Anisimov et al.32
The most used strategy for the fabrication of these paper sensors is the direct deposition of a thin film of PANI through in situ polymerization or printing on a paper sheet.3,9 Sandhu et al.9 improved the in situ polymerization protocol for the fabrication of PANI humidity sensor by increasing the electrical conductivity to 1.1 × 10⁻¹ from 1.9 × 10⁻⁶ S cm−1. Morais et al.3 proposed a humidity sensor composed of conductive PEDOT:PSS poly(3,4-ethylenedioxythiophene):poly(styrene sulfonate) and PANI. However, the conductive layer is confined onto the surface, the sensing material usually exhibits low electrical conductivity.
The chemical modification can also take place at the level of single cellulose fibers to prepare a material that could be directly employed by the paper industry to produce conductive paper sheets with enhanced conductivity because the charge transport involved all the bulk of the object. Within this framework, our group has recently optimized this technology to prepare high conductive paper whose superior performances have been demonstrated by the fabrication of an all-paper capacitive touch sensor.22 We herein explore the performance of bulk conductive PANI paper sheets as low-cost, eco-friendly and flexible humidity transducer with potential application in innovative sensors embedded in packaging or wearable devices. The cell/PANI synthesis has been further optimized by vacuum treatment to enhance the electrical conductivity and the stability under operation conditions. The prepared devices have been tested in the range 30–50 RH% in a climatic chamber and at different RH% in a lab test chamber set-up, all the measurements have been performed at room temperature (21 ± 1 °C). The sensors response to humidity changes in few seconds with an appropriate recovery time. The variation in the parameters was nearly linear and was repeatable; the sensor response was compared with commercial sensor. The estimate cost of cell/PANI sensor results cheaper than those on the market, normally between 4 and 9 USD.34
2. Experimental section
2.1. Materials
All chemicals and solvents are ACS reagent grade, were purchased from commercial vendors and used directly unless otherwise stated. Sulfuric acid (H2SO4, 95.0–98.0%), ammonium persulfate [(NH4)2S2O8), ≥98%, APS] and aniline (≥99%), were purchased from Sigma-Aldrich (now Merck KGaA, Darmstadt, Germany); aniline was distilled under nitrogen prior to use. Hydrocloric acid (HCl, ≥37%) was purchased from VWR Chemicals (Vienna, Austria); a solution of ca. 25 wt% of Al2(SO4)3 in water (commercial name FLOCLINE S8C) was purchased from Bio-Line s.r.l. (Milano, Italy). Bare cellulose fibers (pine tree long fiber with sulfate treatment) were kindly provided by Cromatos s.r.l. (Forlì, Italy). Universal pH paper test (Jovitec) was used for the pH measures.2.2. Syntheses of the cell/PANI sheets
The synthesis is well-described in our previous work.22 Briefly, in a 1 L round bottom flask, 2.5 g of bare cellulose fibers were dispersed in demineralized water (250 mL) for 30 min; successively a solution made of 2.5 mL of aniline in 150 mL of 1.0 M HCl was added to the fiber suspension and stirred for 3 h at room temperature. In turn, the oxidative polymerization was carried out adding dropwise to the stirred suspension, previously cooled to 0 °C in an ice bath, a solution of 7.0 g of (NH4)2S2O8 dissolved in 200 mL of 1.0 M HCl (Scheme 1A). After 24 h the coated fibers were filtered in a Buchner funnel and washed several times with 1.0 M citric acid solution. The conductive fibers were dried in air atmosphere for 24 h. To obtain a 0.25 mm thickness sheet, 10 g of cell/PANI fibers were added to 1.0 L of an acid solution (ca. pH 3.0, 25 wt% Al2(SO4)3 in demineralized water) and stirred for 5 min, then the fibers were partially dried in a square sieve (21.0 cm × 14.8 cm size). To obtain different thickness, it is sufficient to proportionally increase the amount of cell/PANI fibres. Finally, the sheet was pressed at 50 bar (P50 AXA manual hydraulic press) for 10 s (Scheme 1B). The final sensor (see next paragraph) appears as shown in Scheme 1C.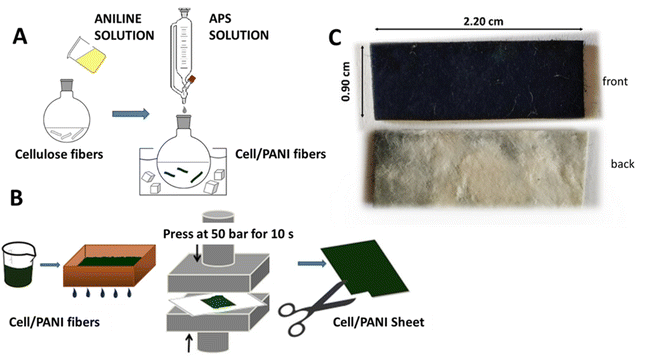 | ||
| Scheme 1 (A) Cell/PANI fibers preparation; (B) cell/PANI sheet preparation; (C) cell/PANI sensor: front and back. | ||
2.3. Fabrication of the humidity sensors
To increase the mechanical resistance of the conductive sheets we employed the industrially wet coupling method: a cell/PANI sheet of 0.40 mm thickness was coupled with a bare cellulose sheet (thickness 0.40 mm), previously moistened with water. The two sheets were then pressed (50 bar, 10 s, final thickness of 0.80 mm) and dried at 80 °C for 10 min. A cost analysis of the sensing element was evaluated considering the declared price of materials on Sigma-Aldrich catalogue and related to the dimension of a single sensor (1.8 cm2); it was estimated to be 0.33 USD and the details of the analysis are reported in Table S1.†2.4. Humidity sensing set-up
In order to make preliminary stability tests a simple controlled-humidity enclosures constructed using a sealed container, connected with different saturated salt solution flushing with nitrogen (N2) at a fixed flow (3.0 mL s−1) and temperature (21 ± 1 °C) to obtain different % RHs (i.e., 22% and 44%) was used, see Fig. 1 and S1.†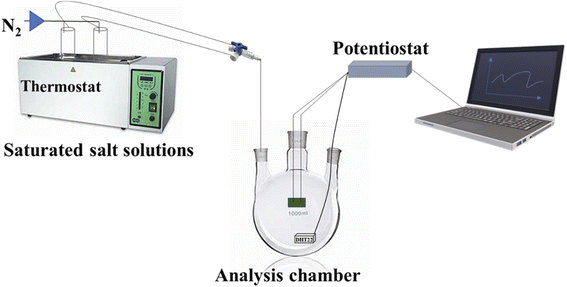 | ||
| Fig. 1 Schematic diagram of the lab test chamber set-up: chamber volume 500 cm3, RH% stabilized by saturated salt solutions in N2; alternatively dry or wet N2 has been used. | ||
A potentiostat/galvanostat Autolab PGSTAT128N (Metrohm-Autolab) controlled by NOVA 2.10 software was used to monitor the current flowing in the humidity sensor when a potential of 0.100 V was being applied in the two-electrode configuration. The voltage values have been chosen to avoid the occurrence of electrochemical side reactions.35 In particular, the PANI overoxidation can takes place at high applied voltage due the partly ionic conductivity of the polymers. These phenomena act as a charge trapping in the conductivity of the polymer at high applied voltage. One of the extremities of PANI sensors was connected to the working electrode terminal of the potentiostat while the other extremity was connected to the shortcutting cables of counter electrode and the reference electrode. The detailed descriptions of the lab test chamber set-up and protocol employed are presented in the ESI (Fig. S1†). The specific relative humidity into the closed glass chamber was maintained by saturated solution (SS) of different salts, namely potassium acetate (CH3COOK, 22 RH%) and potassium carbonate (K2CO3, 44 RH%);36–38 the 2 RH% was obtained with dry N2. Finally, to the other end of the glass chamber is connected a commercial digital-output relative humidity & temperature sensor, DHT22 (also named as AM2302, Guangzhou Aosong Electronics Co., Ltd, China, temperature from −40 to +80 °C and relative humidity from 0 to 100%; ±0.5 °C; ±2.0%, prize 9.9 USD) for calibration and comparison.
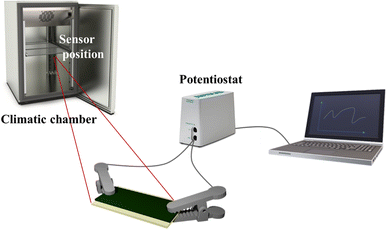
Alternatively, a cooling incubator with controlled humidity and temperature (climatic chamber, ClimaCell 111 comfort, MMM Group, Fig. 2) with a chamber volume of 111![[thin space (1/6-em)]](https://www.rsc.org/images/entities/char_2009.gif) 000 cm3 and air flow in the chamber that ensure fast and accurate distribution of the selected temperature and humidity, has been used to obtain an exact and reproducible simulation of variable climatic conditions. In this case the tests have been carried out at a fixed temperature of 21 ± 1 °C. The chronoamperometric responses of cell/PANI humidity sensor were following at an applied potential of 0.100 V with a set step uphill (5%) from 30% up to 50 RH%, each step maintained for 1 h and 15 min (total time for each measure: 7.5 h).
000 cm3 and air flow in the chamber that ensure fast and accurate distribution of the selected temperature and humidity, has been used to obtain an exact and reproducible simulation of variable climatic conditions. In this case the tests have been carried out at a fixed temperature of 21 ± 1 °C. The chronoamperometric responses of cell/PANI humidity sensor were following at an applied potential of 0.100 V with a set step uphill (5%) from 30% up to 50 RH%, each step maintained for 1 h and 15 min (total time for each measure: 7.5 h).
Even in this case the DHT22 was used as comparison sensor to monitor the RH% and temperature inside the climatic chamber at each test. It is worthy to underline that the experiments performed under nitrogen atmosphere in saturated salt water solutions or as dry pristine nitrogen were performed in order to study the sensor performance during rapid changes of humidity levels. At the same time, the investigation carried out in the climate chamber demonstrates the operation in air under finely controlled conditions of temperature and humidity.
All the tests have been repeated three times with the same sensor and three different sensors have been employed for each test.
2.5. Instruments
ATR-FTIR analyses were performed using a PerkinElmer Spectrum Two spectrophotometer, equipped with a Universal ATR accessory, with a resolution of 0.5 cm−1 in the range 4000–400 cm−1. The samples were directly analyzed performing 40 scans for any analysis. SEM images were recorded at 25 kV with a Sem Zeiss EVO 50 EP equipped with Oxford INCA 350; EDS Spectrometer equipped with a Bruker Z200 energy dispersive microanalysis (EDX) system was used for semi-quantitative chemical analysis and mapping. TGA characterization was carried out using a PerkinElmer TGA-7 instrument. In each analysis, a piece of weight ca. 4.0 mg of the target electrode was heated in a platinum crucible from temperature of 38 °C to 950 °C (or 800 °C for cellulose), at a rate of 10 °C min−1, under N2 atmosphere.3. Results and discussion
3.1. Device structure and cell/PANI characterization
The structure of the sensor is very simple because it is made of a cell/PANI sheet (usually a 0.90 × 2.20 cm rectangle) whose extremities are directly linked to measure apparatus by alligator connectors, Fig. 2. Since no interdigitated electrodes or other complex electrical connection are required, the system can be easily prepared by cutting the cell/PANI in wanted shape, highlighting the versatility of the material, and suggesting an easy embedding into real-life objects.The structural and morphological properties of cell/PANI have been investigated by SEM, EDX, ATR-FTIR. The results were reported in our previous work22 and for sake of clarity briefly reported in the ESI.† SEM micrographs of pristine cellulose and cell/PANI (Fig. S2, ESI†) showed that PANI coatings were uniformly deposited on the cellulose fiber substrates.22 ATR-FTR spectrum of cell/PANI reported in our previous work22 and in Fig. S3,† shows the characteristic bands of PANI emeraldine salts at the wave numbers of 1560–1570 cm−1, 1480–1490 cm−1 (attributed to the C![[double bond, length as m-dash]](https://www.rsc.org/images/entities/char_e001.gif) C stretching vibration bands to the quinonoid and benzenoid units appeared respectively), 1302–1304 cm−1, 1243–1245 cm−1, 1108–1119 cm−1.39–41 Fig. S4† displays the comparison of TGA curves for the PANI paper and bare cellulose. All samples have three weight loss stages; due to the highly hygroscopic nature of cellulose and polyaniline, the first mass loss (about 5%) from room temperature to 160–180 °C is ascribed to the loss of water. The second stage that starts at around 160 °C is due to loss of dopant and low molar mass oligomers, cross-linked fragments of chains and the initiation of polymer degradation (81% and 65% for cellulose and cell/PANI, respectively). The last stage, that occurs at around 500 °C, corresponds to the total rupture of polymer bonds (polyaniline and cellulose), as well as heavier fragments in even smaller fractions and gaseous by-products.
C stretching vibration bands to the quinonoid and benzenoid units appeared respectively), 1302–1304 cm−1, 1243–1245 cm−1, 1108–1119 cm−1.39–41 Fig. S4† displays the comparison of TGA curves for the PANI paper and bare cellulose. All samples have three weight loss stages; due to the highly hygroscopic nature of cellulose and polyaniline, the first mass loss (about 5%) from room temperature to 160–180 °C is ascribed to the loss of water. The second stage that starts at around 160 °C is due to loss of dopant and low molar mass oligomers, cross-linked fragments of chains and the initiation of polymer degradation (81% and 65% for cellulose and cell/PANI, respectively). The last stage, that occurs at around 500 °C, corresponds to the total rupture of polymer bonds (polyaniline and cellulose), as well as heavier fragments in even smaller fractions and gaseous by-products.
Summarizing, the cell/PANI characterization shows that the cellulose fiber has been uniformly covered by PANI, highlighting that all the bulk of the material is involved in the charge transport.
3.2. Electrical measurements
The conducting emeraldine form of PANI exists when the polymer is doped with counter anions;40,41 normally small acid molecules, such as hydrochloric acid, that could be released during the aging time. The behaviour of cell/PANI was therefore analyzed in a close chamber in the presence of a pH tester paper for 72 h. As shown in Fig. S5A,† when exposed in proximity to cell/PANI the pH tester paper turns to red in about 48 h indicating an acid release. This behaviour was also confirmed when measuring the drift of the current with time registered at room temperature and 60 RH% before and after the vacuum treatment (figure not showed). To avoid this problem all cell/PANI samples were therefore always kept under vacuum for 67 h before use; such timing was chosen after studying the trend of the electrical conductivity versus the treatment time, which showed that stable values are reached after 67 h.Cell/PANI conductivity before and after vacuum treatment was measured with a Keysight B2902A source meter units in a 4-line-probe configuration by exploiting a home-made holder that is composed by 4 parallel copper electrodes on a glass slide (see Fig. S6 for details†). The data reported in Table 1 represent averages from three measurements. No significant variations have been observed in the conductivity of the cell/PANI when vacuum treatment was applied. These results are in keeping with literature data where the conductivity of deposited polyaniline films have been found in the range from 10−1 to 21 S cm−1.42,43 Moreover, the long-term stability is proved by the fact that the value of conductivity observed after one year from its preparation is still consistent with that required for applications such as material for electromagnetic interference shielding, sensors and catalysis.43 Indeed, the reduction of conductivity after one year is imputable to the loss of the dopants used for doping PANI. The small molecule of HCl can evaporate at room or higher temperature, causing a depression of the conductivity of the acid-doped polymers.40,44 For this reason, a long-time storage under sealed packaging is recommended for these devices.
| No vacuum treatment (S cm−1) | After vacuum treatment (S cm−1) | No vacuum treatment (after one year) (S cm−1) |
|---|---|---|
| 3.45 ± 0.01 10−1 | 4.58 ± 0.01 10−1 | 1.05 ± 0.04 10−1 |
Finally, the cell/PANI conductivity has been studied after repeated bending (angle = 30°). The test usually breaks the sheets after more than 200 cycles, and the conductivity decreases about 20% for every 100 cycles as reported in Fig. S7.† Cell/PANI maintains the sensing ability after bending, but the sensitivity changes due the variation of electrical features.
3.3. Humidity sensing studies
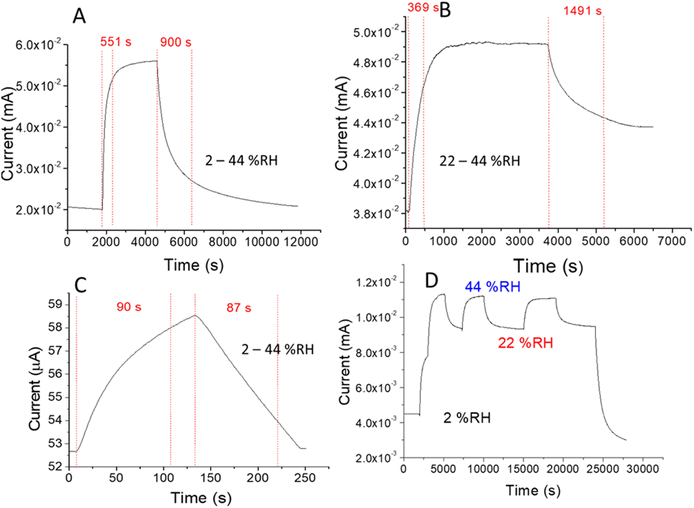
The sensing mechanism can be described as reported in literature.17 Briefly, conduction mechanism in PANI is significantly due to the hopping of electrons, from the protonated reduced form (NH2+) to the protonated oxidized form (NH+). As (NH2+) unit unable to lose an electron without prior losing a proton, hence the electron hopping occurs conditionally with a preliminary, prior transformation of a proton. However, this kind of proton transfer takes place in the polymer only in the presence of water molecules. Thus, the adsorption of water plays a vital role in altering the conductivity of PANI and thereby supporting the humidity sensing mechanism, through the hopping of electrons assisted by the proton transfer.The pulse-stimuli characteristics of the sensors were analyzed based on a series of current responses on dynamic switches between two different RH% range: (i) dry and wet nitrogen (N2) flow, 2–44 RH% or 2–99 RH% and (ii) two different wet N2 flow 22 and 44 RH%, employing the homemade controlled set-up and a flow rate of 3 mL s−1 with long and short cycling time (see Fig. 3 and Fig. S8†). The cell/PANI humidity sensor displayed good dynamic reproducible responses on moisture at both cycling times. As shown in Fig. 3, when the cell/PANI was exposed to the wet flow, the current of the sensor promptly showed an increased response before reaching a relative stable equilibrium value, depending on the cycling time used. Once the moist flow was switched to dry nitrogen, the current begins its decrement after 4–5 s indicating the rapid response of the sensors. However, the signal needs hundreds of second to reach a stable current value. The recovery (or response) times, defined as the time required to reach the 90% of the final signal,16 as well as the orders of magnitude in the current change recorded before and after the stimuli, are reported in Table 2. Additionally, Fig. 3D shows that the sensor exhibits a stable response, after periodically changing the humidity level (3 cycles between 22 and 44%) for 7 h and Fig. S8† shows the response stability during humidity variations occurring at higher frequency. On the other hand, the shell-life is 1 year. It is worthy to note that these devices are being developed to be embedded into disposable objects that have a relative short lifetime, suggesting that the cell/PANI could be a promising sensing material for further technological improvements. The absorbed water plays an important role in the conductivity of PANI through an increase in the interchain electron transfer and/or by increasing the mobility of dopant ions. The humidity sensing property of PANI to water vapor can be regarded as electron hopping assisted by proton exchange.17,25
| Range RH% | Response time (s) | Recovery time (s) | Order of magnitude of current change |
|---|---|---|---|
| 2–44 (long cycling time) | (5.5 ± 0.2) 102 | (1.75 ± 0.08) 103 | 2.8 ± 0.2 |
| 22–44 (long cycling time) | (3.7 ± 0.1) 102 | (1.49 ± 0.05) 103 | 1.3 ± 0.1 |
| 2–44 (short cycling time) | 90 ± 9 | 87 ± 4 | 1.1 ± 0.1 |
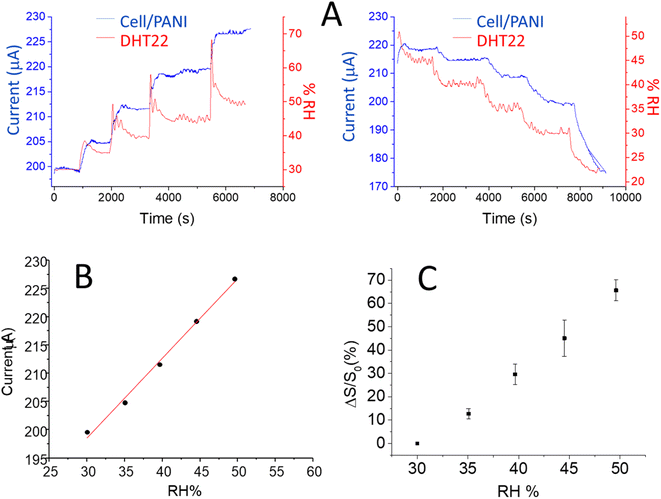
Finally, the cell/PANI has been tested in a climatic chamber at a fixed temperature of 21 ± 1 °C following the current response of the humidity sensor at an applied potential of 0.100 V, under a set step uphill (5%) from 30 up to 50 RH% in air atmosphere; each step was maintained for 1 h and 15 min, that is time sufficient to reach and stabilize the set values. The RH range and temperature in this case were chosen in accordance with recommended indoor air relative humidity.45–47 As previously reported, during the tests a commercial digital-output relative humidity and temperature sensor (DHT22) was employed in parallel with cell/PANI and climatic chamber sensors for comparison; in this case the measurements were directly in RH%. The current vs. time curves for cell/PANI sensor and RH% vs. time curves registered with DHT22 are shown in Fig. 4A; the oscillation in the signal, observed with all the sensors employed are due to the fluctuations present in the chamber for each RH% variation (in order to remain as close as possible to the programmed temperature and RH% ramp, inside the climatic chamber heating/cooling and humidification/dehumidification processes iteratively occur). It is worthy to note that PANI paper maintains the sensing ability also in the presence of oxygen.
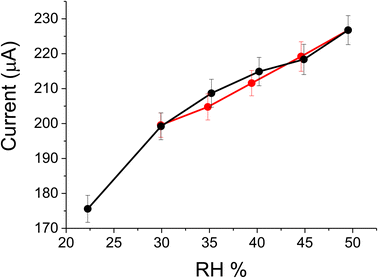
From the response values obtained (considering the values in the middle of the plateau registered for each step), the current vs. RH% curves have been calculated, as presented in Fig. 4B.
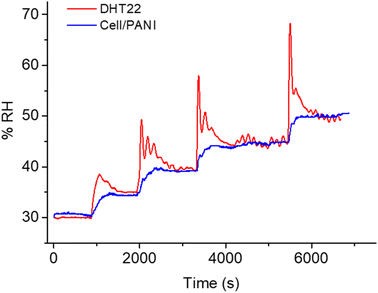
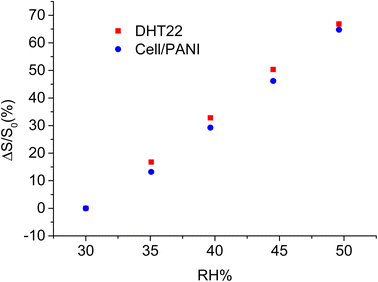
A linear trend was observed with a slope of response 1.41 μA RH%−1. Using the eqn (1) and the parameters of the linear curve, it is possible to transform the current into an RH% signal, so that results directly comparable the DHT22 response with those of our sensor, as reported in Fig. 5.
 | (1) |
A perfect overlap is observed between the two signals, moreover the signal obtained with cell/PANI is affected by a lower noise especially in the first part of each increase RH% step and is more comparable with the changes recorded by the climate chamber sensor. In order to compare the humidity sensitivity between the two different sensors, the current signal was treated as the normalized response, which is defined as eqn (2).15,48
 | (2) |
The comparison of the slope of the curves for cell/PANI and DHT22 (3.34 ± 0.11 and 3.44 ± 0.03 respectively) show that the rate of change response of cell/PANI sensor is clearly statistically equal to the commercial one.
The humidity hysteresis characteristic curve for cell/PANI was evaluated. At first the device was exposed in different humidity environments in increasing order from 20 to 50 RH% and the respective current values were recorded. Afterward, the device was reverted by exposing it again in the same RH air environments in the decreasing order from 50 to 20% RH and the corresponding current were noted down. From Fig. 7 it was observed that the current values acquired during decreasing ramp results very close to the values obtained in the increase ramp, highlighting the high reversibility of the sensor response.
Table 3 compares the performances of different PANI sensors obtained on paper.
| Material | Fabrication method | Electrical conductivity (S cm−1) | Sensitivity (kΩ RH%−1)/range (% RH) | Response time (s)/recovery time (s) | Ref. |
|---|---|---|---|---|---|
| Thin PANI film | In situ polymerization on Whatman filter paper | 1.1 × 10⁻¹ | 9.79/16–96.2 | 1300/2809 | 9 |
| PANI/PEDOT:PSS | Printed onto paper by a commercial HP printer | — | —/16–100 | 540/— | 3 |
| Cell/PANI | In situ polymerization on cellulose fibre | 4.58× 10⁻¹ | 70.9/2–50 | 90/87 (short cycling) 370/1490 (long cycling) | Our work |
Previous papers exploited a fabrication approach wherein a thin film of conductive polymer was deposited onto a paper sheet. Therefore, their electrical conductivities appear lower than the here proposed cell/PANI wherein the conductive material covers each paper fibers and all the paper volume is involved in charge transport. Despite the lowest resistivity of cell/PANI, the sensitivity of our device is very high though it is expressed as variation of resistance. On the other hand, the measurement range of cell/PANI is the narrowest among examined sensors. Finally, cell/PANI exhibits the fast response and recovery times. It is worthy to note that devices, which exploit paper sheets, exhibit lower performance than the ones of consolidated devices composed by interdigitated electrodes.37,49 However, the last sensors can hardly be implanted in real life objects for realizing a punctual humidity monitoring. Summarizing, the here proposed sensor exhibits high performances improving the knowledge in the design of innovative devices for humidity monitoring in packaging and health applications.
4. Conclusions
Humidity monitoring plays a key role in maintaining optimal storage conditions for numerous assets, ranging from pharmaceuticals, artefact, to personal health. Commercial sensors do not allow extensive monitoring due to their high cost and difficulties in embedding them into everyday objects, such as packaging. Organic conductive materials represent a promising answer to these demands. We explored the humidity sensing performance of conductive cellulose fibers coated with polyaniline (cell/PANI). The current which flows in the material due to an applied potential is recorded while the sensor is placed in a climate chamber (30–50 RH%, 21 ± 1 °C), used to vary humidity and simulate an indoor air humidity. The sensor shows a linear and rapid response and a stability in the signal for short and long-time humidity cycling. Moreover, the rate of change response of our device results perfectly comparable with that of a commercial digital output of a relative humidity and temperature sensor highlighting the promising performance in low-cost humidity monitoring. Finally, the use of paper as substrate could pave the way to new applications in packaging with a potential improvement of the storage conditions of preserved goods.Conflicts of interest
There are no conflicts to declare.Acknowledgements
The authors wish to thank Dr Katia Rubini, Department of Chemistry Giacomo Ciamician, UNIBO, for providing the TGA measurements.References
- T. A. Blank, L. P. Eksperiandova and K. N. Belikov, Sens. Actuators, B, 2016, 228, 416–442 CrossRef CAS.
- W. Ahmad, B. Jabbar, I. Ahmad, B. M. Jan, M. M. Stylianakis, G. Kenanakis and R. Ikram, Materials, 2021, 14, 1–19 Search PubMed.
- R. M. Morais, M. D. S. Klem, G. L. Nogueira, T. C. Gomes and N. Alves, IEEE Sens. J., 2018, 18, 2647–2651 CAS.
- G. Chen, X. Xiao, X. Zhao, T. Tat, M. Bick and J. Chen, Chem. Rev., 2022, 122, 3259–3291 CrossRef CAS.
- Z. Duan, Y. Jiang and H. Tai, J. Mater. Chem. C, 2021, 9, 14963–14980 RSC.
- M. F. Bellemare, M. Çakir, H. H. Peterson, L. Novak and J. Rudi, Am. J. Agric. Econ., 2017, 99, 1148–1158 CrossRef.
- S. Gopalakrishnan, S. Sedaghat, A. Krishnakumar, Z. He, H. Wang and R. Rahimi, Adv. Electron. Mater., 2022, 2101149, 1–14 Search PubMed.
- S. Kano, N. Jarulertwathana, S. Mohd-noor, J. K. Hyun, R. Asahara and H. Mekaru, Sensors, 2022, 22, 1–30 CrossRef PubMed.
- S. S. Sandhu, S. Kumar, S. Augustine, U. Saha, K. Arora, S. Bayan, S. K. Ray, N. K. Puri and B. D. Malhotra, IEEE Sens. J., 2020, 20, 12574–12581 CAS.
- S. Ahmad, K. Rahman, M. Shakeel, T. A. K. Qasuria, T. A. Cheema and A. Khan, J. Mater. Res., 2021, 36, 3667–3678 CrossRef CAS.
- E. W. Nery and L. T. Kubota, Anal. Bioanal. Chem., 2013, 405, 7573–7595 CrossRef CAS PubMed.
- V. Nayana and B. Kandasubramanian, J. Polym. Res., 2020, 27, 29–32 CrossRef.
- K. R. Andreas Elschner, S. Kirchmeyer, W. Lovenich and U. Merker, PEDOT Principles and Applications of an Intrinsically Conductive Polymer, 2010, https://doi.org/10.1201/b10318 Search PubMed.
- G. Alberti, C. Zanoni, V. Losi, L. R. Magnaghi and R. Biesuz, Chemosensors, 2021, 9, 108 CrossRef CAS.
- S. Jain, S. D. S. Chakane, S. V. Bhoraskar, A. B. Samui and V. N. Krishnamurthy, Smart Struct. Devices, 2001, 4235, 305–310 CAS.
- T. F. Wu and J. D. Hong, RSC Adv., 2016, 6, 96935–96941 RSC.
- S. Manjunatha, T. Machappa, Y. T. Ravikiran, B. Chethan and A. Sunilkumar, Phys. B, 2019, 561, 170–178 CrossRef CAS.
- P. Cavallo, D. F. Acevedo, M. C. Fuertes, G. J. A. A. Soler-Illia and C. A. Barbero, Sens. Actuators, B, 2015, 210, 574–580 CrossRef CAS.
- P. Singh and S. K. Shukla, J. Mater. Sci., 2020, 55, 1331–1365 CrossRef CAS.
- D. T. Nga, A. D. Phan, V. D. Lam, L. M. Woods and K. Wakabayashi, RSC Adv., 2020, 10, 28447–28453 RSC.
- G. Yin, Y. Wang, W. Wang, Z. Qu and D. Yu, Adv. Mater. Interfaces, 2021, 8, 1–12 Search PubMed.
- I. Ragazzini, I. Gualandi, S. Selli, C. Polizzi, M. C. Cassani, D. Nanni, F. Gambassi, F. Tarterini, D. Tonelli, E. Scavetta and B. Ballarin, Carbohydr. Polym., 2021, 254, 117304 CrossRef CAS PubMed.
- S. I. A. Razak, N. F. A. Sharif and N. H. M. Nayan, Fibers Polym., 2014, 15, 1107–1111 CrossRef.
- W. Gao, H. Ota, D. Kiriya, K. Takei and A. Javey, Acc. Chem. Res., 2019, 52, 523–533 CrossRef CAS PubMed.
- A. T. Ramaprasad and V. Rao, Sens. Actuators, B, 2010, 148, 117–125 CrossRef CAS.
- B. Deshkulkarni, L. R. Viannie, S. V. Ganachari, N. R. Banapurmath and A. Shettar, IOP Conf. Ser. Mater. Sci. Eng., 2018, 376, 012063 CrossRef.
- D. Tobjörk and R. Österbacka, Adv. Mater., 2011, 23, 1935–1961 CrossRef.
- R. Xiong, A. M. Grant, R. Ma, S. Zhang and V. V. Tsukruk, Mater. Sci. Eng., R, 2018, 125, 1–41 CrossRef.
- N. S. M. Ramdzan, Y. W. Fen, N. A. A. Anas, N. A. S. Omar and S. Saleviter, Molecules, 2020, 25, 2548 CrossRef CAS PubMed.
- S. M. Read and T. Bacic, Science, 2002, 295, 59–60 CrossRef CAS PubMed.
- A. T. Singh, D. Lantigua, A. Meka, S. Taing, M. Pandher and G. Camci-Unal, Sensors, 2018, 18, 1–22 CrossRef PubMed.
- Y. A. Anisimov, R. W. Evitts, D. E. Cree and L. D. Wilson, Polymers, 2021, 13, 2722 CrossRef CAS PubMed.
- V. Janaki, K. Vijayaraghavan, B. T. Oh, A. K. Ramasamy and S. Kamala-Kannan, Cellulose, 2013, 20, 1153–1166 CrossRef CAS.
- Y. Guide and R. H. Sensor, https://www.instrumentchoice.com.au/news/your-guide-to-finding-the-perfect-sensor-part-2.
- D. G. D. Teixeira, J. M. G. Laranjeira, E. A. De Vasconcelos, E. F. Da Silva, W. M. De Azevedo and H. J. Khoury, Microelectron. J., 2003, 34, 713–715 CrossRef CAS.
- F. E. M. O'Brien, J. Sci. Instrum., 1948, 25, 73–76 CrossRef.
- Q. Lin, Y. Li and M. Yang, Sens. Actuators, B, 2012, 161, 967–972 CrossRef CAS.
- D. L. Vu, Y. Y. Li, T. H. Lin and M. C. Wu, J. Taiwan Inst. Chem. Eng., 2019, 99, 250–257 CrossRef CAS.
- Z. Pang, Z. Yang, Y. Chen, J. Zhang, Q. Wang, F. Huang and Q. Wei, Colloids Surf., A, 2016, 494, 248–255 CrossRef CAS.
- J. E. Yoo and J. Bae, Bull. Korean Chem. Soc., 2013, 34, 3825–3828 CrossRef CAS.
- I. Rahayu, D. R. Eddy, A. R. Novianty, R. Rukiah, A. Anggreni, H. Bahti and S. Hidayat, IOP Conf. Ser. Mater. Sci. Eng., 2019, 509, 012052 CrossRef.
- B. S. Flavel, J. Yu, J. G. Shapter and J. S. Quinton, Soft Matter, 2009, 5, 164–172 RSC.
- N. C. Nepomuceno, A. A. A. Seixas, E. S. Medeiros and T. J. A. Mélo, J. Solid State Chem., 2021, 302, 122372 CrossRef CAS.
- J. E. Yoo, J. L. Cross, T. L. Bucholz, K. S. Lee, M. P. Espe and Y. L. Loo, J. Mater. Chem., 2007, 17, 1268–1275 RSC.
- O. Septpptianen, Rehva Eur. HVAC J., 2021, 58, 24–28 Search PubMed.
- UNI 10829, Works of art of Historical importance—Ambient Conditions for the Conservation—Measurement and Analysis, UNI Standard, Ente Nazionale Italiano di Unificazione, Milano, Italy, 1999 Search PubMed.
- A. V. Baughman and E. A. Arens, ASHRAE Trans., 1996, 102, 193–211 Search PubMed.
- H. Zhao, T. Zhang, R. Qi, J. Dai, S. Liu and T. Fei, ACS Appl. Mater. Interfaces, 2017, 9, 28002–28009 CrossRef CAS PubMed.
- F. W. Zeng, X. X. Liu, D. Diamond and K. T. Lau, Sens. Actuators, B, 2010, 143, 530–534 CrossRef CAS.
Footnote |
| † Electronic supplementary information (ESI) available: Cost analysis and humidity measurements set-up; additional material characterization (SEM, ATR-IR, TGA); additional electrical measurements and sensing studies. See https://doi.org/10.1039/d2ra03982f |
| This journal is © The Royal Society of Chemistry 2022 |

