 Open Access Article
Novel Janus MoSiGeN4 nanosheet: adsorption behaviour and sensing performance for NO and NO2 gas molecules
Yixin Wenga,
Xinguo Ma *a,
Gang Yuana,
Hui Lv*b and
Zhongyong Yuan
 *c
*c
aSchool of Science, Hubei University of Technology, Wuhan 430068, China. E-mail: maxg@hbut.edu.cn
bHubei Engineering Technology Research Centre of Energy Photoelectric Device and System, Hubei University of Technology, Wuhan 430068, China. E-mail: lvhui@hbut.edu.cn
cKey Laboratory of Advanced Energy Materials Chemistry (Ministry of Education), College of Chemistry, Nankai University, Tianjin 300071, China. E-mail: zyyuan@nankai.edu.cn
First published on 1st September 2022
Abstract
A novel Janus MoSiGeN4 nanosheet is proposed for detecting poisonous gas molecules. Herein, the adsorption behaviour and sensing performance of both sides of the MoSiGeN4 monolayer to NO and NO2 gas molecules were investigated by first-principles calculations. Firstly, it is found that the MoSiGeN4 monolayer exhibits structural stability and indirect gap semiconductor characteristics. The largest adsorption energy of NO2 molecules on the MoSiGeN4 monolayer is −0.24 eV, which is higher than the −0.13 eV for NO molecules. Of course, the physisorption between gas molecules and the MoSiGeN4 monolayer appears with slight charge transfer. It is confirmed that NO molecules and NO2 molecules act as electron donors and electron acceptors, respectively. Meanwhile, the generation of small band gaps and impurity levels in the electronic structures after gas adsorption is in favour of the enhancement of electronic conductivity. Furthermore, the longest recovery times of NO and NO2 molecules are predicted to be 0.15 and 10.67 ns at room temperature, and the lateral diffusion at the surface requires crossing a large energy barrier. These findings provide indisputable evidence for further design and fabrication of highly sensitive gas sensors based on the MoSiGeN4 monolayer.
1. Introduction
Recently, an increasing number of environmental problems such as photochemical smog and acid rain caused by poisonous gas molecules have been gradually highlighted.1–3 Efficiently detecting these gas molecules is significant to industry, agriculture, and public health.4 Current gas sensors are mainly designed based on metal–oxide–semiconductor,5 polymers,6 nanowires,7 nanobelts8 and two-dimensional (2D) materials,9–11 etc. Among them, 2D materials have become a research hotspot due to their superior flexibility, large specific surface area, excellent electronic properties, and available active sites.12–14 After the discovery of graphene,15 gas sensors based on 2D materials have made significant progress.16–21 For instance, Zhao et al. studied the interaction between the MoS2 monolayer and various gas molecules and fully exploited its potential applications in gas sensors.20 Ai et al. investigated the charge transfer mechanism of the WTe2 monolayer with gas adsorption and presented that it could be used as a superior gas sensing material.21 However, existing materials are not commendably satisfied with the increasing application demands such as high sensitivity, good selectivity, perfect stability and appropriate recovery time.22Lately, a new 2D material of MoSi2N4 monolayer has been fabricated by chemical vapor deposition23 and exhibited potential applications for the detection of NO and NO2 molecules, while the deficiency still exists.24 In general, conventional strategies including doping, structural defects, and construction of heterojunctions can be used to enhance the performance of 2D materials.25–27 Interestingly, Cui et al. successfully synthesized a new 2D Janus structure of MoSSe monolayer, which showed better sensing performance than MoS2 monolayer.28 It is not unique, Dou et al. found that the sensitivity of WTe2 monolayer for CO, NO, and O2 molecules is significantly improved by constructing the Janus structure.29 Inspired by the above research about Janus structure,30–32 we envisaged to further enhance the adsorption performance of the MoSi2N4 monolayer for NO and NO2 molecules in this way. Excitingly, Yu et al. proposed a 2D Janus structure of MoSiGeN4 monolayer by first-principles calculations, which indeed exhibited more excellent stability and semiconducting properties.33 But so far, there is no report on the Janus MoSiGeN4 monolayer used in designing gas sensors.
Could Janus MoSiGeN4 monolayer be a high-performance gas sensor? It is understood that the presence of inherent dipole moments and electric field in the material caused by the mirror asymmetry of the Janus structure apparently change its electronic properties.34,35 Based on this idea, we explored the adsorption behaviour and sensing performance of the Janus MoSiGeN4 monolayer for NO and NO2 gas molecules using density functional theory (DFT). Firstly, the structural stability of the MoSiGeN4 monolayer was proved by the calculation of phonon dispersion spectra, elastic constants, and cohesive energy, respectively. Then, considering the feasible adsorption sites and orientations of the MoSiGeN4 monolayer, the most stable adsorption configurations for NO or NO2 molecules were determined by comparing the adsorption energy. Meanwhile, to explain the adsorption sensitivity in-depth, the energy band structures, the density of states (DOSs), and the charge density difference of the MoSiGeN4 monolayer with gas adsorption were calculated, respectively, and the corresponding electronic conductivity was assessed. Finally, the recovery time of gas desorption and the transition state of gas lateral diffusion on the MoSiGeN4 monolayer were discussed. Our research results demonstrate that the MoSiGeN4 monolayer possesses several advantages over the MoSi2N4 monolayer, such as better selectivity and enhanced sensitivity, which makes it more suitable for designing highly sensitive gas sensors.
2. Calculation methods and models
All DFT calculations were completed using the Perdew–Burke–Ernzerhof (PBE) exchange-correlation functional in the framework of generalized gradient approximation (GGA) implemented by the CASTEP code.36,37 The ultrasoft pseudo-potentials (USPs) were employed to optimize the structures. Simultaneously, Tkatchenko-Scheffler (TS) scheme for a hybrid semiempirical solution was used to describe the van der Waals (vdW) interaction between gas molecules and the substrate.38 Besides, the reliability of the results was checked by Ortmann–Bechstedt–Schmidt (OBS) within the Perdew–Wang (PW91) functional.39 The valence atomic configurations were taken as Mo: 4s24p64d55s1, Ge: 4s24p2, Si: 3s23p2, and N: 2s22p3, respectively. In the process of the geometric structure optimization, a k-mesh with Monkhorst–Pack form of 3 × 3 × 1 and a cut-off energy of 420 eV were taken.40 A convergence accuracy of 5 × 10⁻⁵ eV per atom was used to relax atomic positions by minimizing the force on each atom in the BFGS minimization scheme.41 The convergence criterion was 0.1 eV Å−1 for the maximal force on atoms. The maximum displacement was 0.005 Å, and the stress convergence was less than 0.2 Gpa. Furthermore, the transition states were calculated using the LST/QST method.42 Note that the spin polarization on all atoms was considered when calculating the magnetic moments of the NO and NO2 molecules.The top view and side view of two isomers M1 and M2 of Janus MoSiGeN4 monolayer were shown in Fig. 1(a and b). It can be seen that the Janus MoSiGeN4 monolayer is constructed by replacing Si atoms with Ge atoms on the side of the MoSi2N4 monolayer. Namely, the MoN2 layer is sandwiched by the Si–N layer and the Ge–N layer, which breaks the original mirror symmetry of the MoSi2N4 monolayer.33 In the M1 configuration, the outermost N and Mo atoms are at an angle in the horizontal plane. And in the M2 configuration, the outermost N atoms are located directly above the Mo atoms. To avoid the interactions between adjacent gas molecules, a 3 × 3 × 1 supercell was built for calculation, which contains 9 Mo atoms, 9 Ge atoms, 9 Si atoms, and 36 N atoms. In addition, a 20 Å vacuum layer was employed to prevent the periodic interactions between the neighbouring slabs.
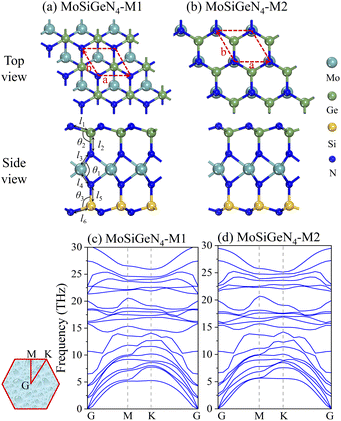 | ||
| Fig. 1 The geometric structures of two kinds of isomers and the phonon dispersion spectra for the Janus MoSiGeN4 monolayer. Here, the red dash line represents the rhombus primitive cell. | ||
3. Results and discussion
3.1. Stability and electronic properties
The optimized lattice constants of two isomers M1 and M2 of Janus MoSiGeN4 monolayer are 2.94 Å and 2.93 Å with PBE-TS, as shown in Table 1, which between those of MoSi2N4 (2.91 Å) and MoGe2N4 (3.02 Å).43 Firstly, the dynamical stability of M1 and M2 are examined by analyzing the phonon dispersion spectra,44 as shown in Fig. 1(c and d). Obviously, there are eighteen optical and three acoustical phonon branches can be observed, and the imaginary phonon modes are absent in the whole Brillouin zone, indicating that the two kinds of isomers are both dynamically stable. In addition, the mechanical stability of M1 and M2 was also checked by the elastic constants Cij.43 The Born criteria of the mechanical stability are C11 > 0, C11–C12 > 0 for hexagonal symmetry. The calculated two independent elastic constants are C11 = 496.474 N m−1, C12 = 151.152 N m−1 for M1, and C11 = 493.394 N m−1, C12 = 146.491 N m−1 for M2. All results meet the above Born criteria, which demonstrates the mechanical stability of the MoSiGeN4 monolayer.| Model | Method | a = b (Å) | l1 (Å) | l2 (Å) | l3 (Å) | l4 (Å) | l5 (Å) | l6 (Å) | θ1 (°) | θ2 (°) | θ3 (°) | Cohesive energy (eV·per atom) |
|---|---|---|---|---|---|---|---|---|---|---|---|---|
| M1 | PBE-TS | 2.94 | 1.83 | 1.86 | 2.09 | 2.10 | 1.74 | 1.77 | 71.60 | 110.74 | 105.43 | −7.35 |
| PW91-OBS | 2.94 | 1.82 | 1.86 | 2.09 | 2.10 | 1.74 | 1.76 | 71.65 | 111.11 | 106.43 | −7.33 | |
| M2 | PBE-TS | 2.93 | 1.82 | 1.87 | 2.09 | 2.10 | 1.75 | 1.77 | 72.09 | 111.88 | 105.64 | −6.87 |
| PW91-OBS | 2.93 | 1.82 | 1.87 | 2.09 | 2.10 | 1.75 | 1.76 | 72.17 | 111.74 | 106.29 | −6.85 |
To further quantitatively compare the structural stability of M1 and M2, the cohesive energy was calculated, which defines as the energy released by atoms in the process of transforming from free-state into bound-state: Ecoh = (Etotal − ∑iniEi)/∑ini, where Etotal and ni are the total energy and the amount of i-th atom in one unit cell, and Ei is the chemical potential of the i-th atom in its bulk element crystal.33,45 Table 1 shows that the Ecoh of M1 is −7.35 eV, which is higher than the −6.87 eV of M2. Generally, the higher the value of Ecoh, the more stable the structure. Hence, M1 is more stable than M2, and M1 is chosen as the basis for the subsequent calculations. Meanwhile, Table 1 shows that the structural parameters of the two isomers are not significantly different, but two sides of the structure are asymmetric for a specific isomer. In the M1 configuration, the Ge–N bond lengths (l1 = 1.83 Å, l2 = 1.86 Å) are greater than Si–N bond lengths (l6 = 1.77 Å, l5 = 1.74 Å), and the angles of N–Ge–N (θ2 = 110.74°) are also larger than the angles of N–Si–N (θ3 = 105.43°).
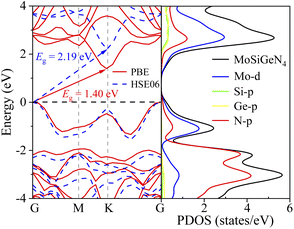
The energy band structure along the G–M–K–G path and the partial DOSs (PDOSs) of the Janus MoSiGeN4 monolayer were displayed in Fig. 2, respectively. It is found that the valence band maximum (VBM) and the conduction band minimum (CBM) are located at the G-point and K-point, respectively. The MoSiGeN4 monolayer has an indirect band gap of 1.40 eV using GGA-PBE and 2.19 eV using HSE06.46 Since the band gap of MoSi2N4 monolayer calculated by GGA-PBE (1.84 eV) is in good agreement with the experimental result.23 To unify the calculation method and facilitate the comparison, the GGA-PBE method was also used in the electronic calculations of the MoSiGeN4 monolayer. Besides, it can be found from PDOSs that the VBM and CBM are mainly contributed by Mo-d and N-p states. Thus, the adsorption behaviour and sensing performance of the gas molecules on the MoSiGeN4 monolayer can be evaluated by the changes in the properties of Mo and N atoms in the following work.
3.2. Adsorption behaviour
The adsorption behaviour of the Janus MoSiGeN4 monolayer can be characterized by adsorption energy, adsorption distance, and structural change. Here, to identify the optimal adsorption configurations for NO and NO2 molecules, different adsorption sites and orientations were considered. Take the Ge–N side as an example; four possible adsorption configurations for NO or NO2 molecules are shown in Fig. 3, namely: the top site of a N atom (Top-N), the top site of a Ge or Si atom (Top-Ge or Top-Si), the hollow site above the centre of the hexagon (Hollow) and the bridge site above the middle of a Ge–N or Si–N bond (Bridge).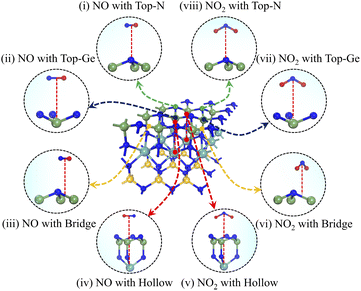 | ||
| Fig. 3 The schematic diagrams of different adsorption configurations of NO or NO2 molecules on the Janus MoSiGeN4 monolayer. | ||
The adsorption energy (Ea) of the Janus MoSiGeN4 monolayer for gas molecules is expressed as follows
| Ea = Etotal − (Esupercell + Egas) | (1) |
| Configuration | Ge–N side | Si–N side | |||||
|---|---|---|---|---|---|---|---|
| Ea (eV) | d (Å) | τ (ns) | Ea (eV) | d (Å) | τ (ns) | ||
| NO | Hollow | −0.12 | 2.91 | 0.10 | −0.13 | 2.80 | 0.15 |
| Top-Ge (Si) | −0.11 | 2.91 | 0.07 | −0.10 | 2.80 | 0.05 | |
| Top-N | −0.09 | 3.01 | 0.03 | −0.07 | 2.81 | 0.01 | |
| Bridge | −0.13 | 2.82 | 0.15 | −0.11 | 2.80 | 0.07 | |
| NO2 | Hollow | −0.14 | 2.64 | 0.22 | −0.20 | 2.81 | 2.27 |
| Top-Ge (Si) | −0.14 | 2.64 | 0.22 | −0.17 | 2.81 | 0.71 | |
| Top-N | −0.20 | 2.63 | 2.27 | −0.22 | 2.80 | 4.92 | |
| Bridge | −0.22 | 2.63 | 4.92 | −0.24 | 2.79 | 10.67 | |
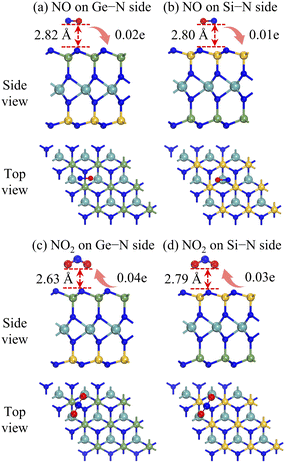
Fig. 4 presents the most favourable adsorption configurations of NO or NO2 molecule on the two sides of the Janus MoSiGeN4 monolayer. It is found that the NO molecule is above the Ge–N bond on the Ge–N side and the centre of the hexagon on the Si–N side, respectively, as shown in Fig. 4(a and b). The axis orientation of the NO molecule is nearly parallel to the surface of the MoSiGeN4 monolayer, and the O atom is slightly downward. The adsorption energies are both −0.13 eV, and the corresponding adsorption distances are 2.82 and 2.80 Å, respectively. Fig. 4(c and d) show that the NO2 molecule is located in parallel on the Ge–N bond or Si–N bond, respectively, and the O atoms are downward. The adsorption energies are −0.22 and −0.24 eV, and the adsorption distances are 2.63 and 2.79 Å, respectively. The results show that the adsorption interaction of the NO2 molecule is stronger than that of the NO molecule. Besides, compared with the adsorption behaviour of NO2 molecule on the MoSi2N4 monolayer (Ea = −0.11 eV, d = 2.75 Å),24 Janus structure possesses some advantages.
Due to the asymmetry of the Janus structure, the adsorption behaviour of the MoSiGeN4 monolayer for NO or NO2 molecules exhibit better selectivity than that of the MoSi2N4 monolayer. To be specific, the Ea for NO2 molecule is always higher than that for NO molecule no matter which side of the Janus MoSiGeN4 monolayer is adsorbed. Thus, it is inferred that its selectivity for NO2 molecule is better than that for NO molecule. Meanwhile, the NO molecule has larger adsorption energy on the Ge–N side, but the NO2 molecule has larger adsorption energy on the Si–N side, which indicates the selectivity of the Janus structure. Subsequently, the effects of NO or NO2 adsorption on the substrate structure were evaluated. It can be found that the MoSiGeN4 monolayer has a slight deformation around the adsorption sites, the bond length changed by about 0.1 Å, and the bond angle changed between 0.1° and 0.4°, as shown in Table 3. In summary, since the adsorption energy is small, the adsorption distance is large, and the structural deformation of the MoSiGeN4 monolayer is not obvious, it is demonstrated that the interactions between the gas molecules and the substrate are weak, which can be characterized as physisorption.24 Fortunately, the inherent magnetic properties of NO and NO2 molecules make them easier to be detected in the asymmetric Janus MoSiGeN4 monolayer, exhibiting excellent sensing performance.
| Configuration | l1 (Å) | l2 (Å) | l3 (Å) | l4 (Å) | l5 (Å) | l6 (Å) | θ1 (°) | θ2 (°) | θ3 (°) | Eg (eV) | M (μB) |
|---|---|---|---|---|---|---|---|---|---|---|---|
| NO on Ge–N side | 1.81 | 1.86 | 2.09 | 2.10 | 1.74 | 1.77 | 71.48 | 111.14 | 105.84 | 0.49 | 1.11 |
| NO on Si–N side | 1.85 | 1.86 | 2.09 | 2.10 | 1.74 | 1.76 | 71.52 | 111.37 | 105.65 | 0.46 | 1.12 |
| NO2 on Ge–N side | 1.82 | 1.86 | 2.09 | 2.10 | 1.74 | 1.77 | 71.41 | 111.14 | 105.84 | 0.47 | 1.13 |
| NO2 on Si–N side | 1.85 | 1.86 | 2.09 | 2.10 | 1.74 | 1.77 | 71.47 | 111.46 | 105.79 | 0.20 | 1.11 |
3.3. Sensing performance
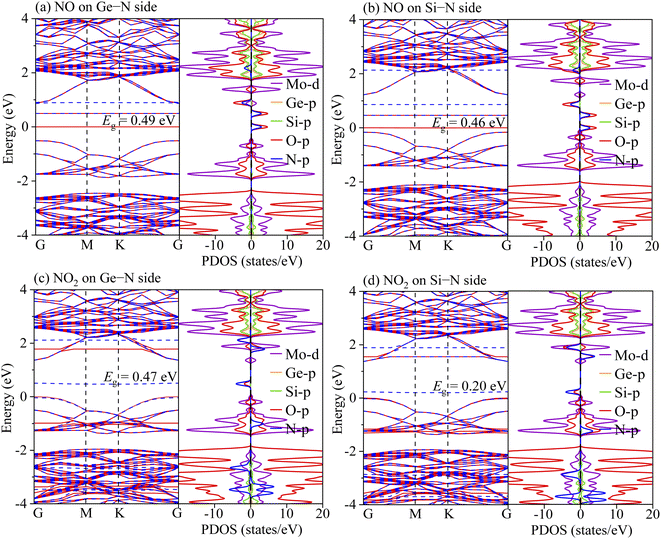
To understand the sensing performance of the Janus MoSiGeN4 monolayer, the energy band structures and PDOSs of the MoSiGeN4 monolayer with NO or NO2 adsorption were calculated, as shown in Fig. 5. It is found that some spin-down and spin-up impurity levels appear near the Fermi level in the energy band structures. Specifically, for NO molecule, after adsorption on the Ge–N side, two spin-up and one spin-down impurity levels are located at 0.08, 0.49 and 0.91 eV near the Fermi level. And after adsorption on the Si–N side, two spin-up and one spin-down impurity levels are located at 0.06, 0.44 and 0.86 eV. From the PDOSs, it is indicated that these new impurity levels are mainly derived from the N-p and O-p orbitals. For NO2 molecules, a spin-down impurity level is located at 0.47 eV near the Fermi level after adsorption on the Ge–N side, and a spin-down impurity level is located at 0.21 eV after adsorption on the Si–N side. Likewise, these impurity levels are also mainly contributed by the N-p and O-p orbitals. The appearance of these impurity levels induced by the NO or NO2 adsorption significantly changes the electronic properties of the MoSiGeN4 monolayer. Compared with the pristine Janus MoSiGeN4 monolayer (see Fig. 2), it can be found that the band gap of the MoSiGeN4 monolayer with NO or NO2 adsorption on the Ge–N side decreases by 0.91 and 0.93 eV, respectively, while those on the Si–N side decreases by 0.94 and 1.20 eV, respectively. There is an exponential relationship between the electronic conductivity and the band gap of a material:
 | (2) |
Meanwhile, to verify the influence of gas adsorption on the Janus MoSiGeN4 monolayer in-depth, we presented the DOSs of NO and NO2 molecules before and after adsorption. The DOSs curves of NO and NO2 molecules are flipped and shifted, which are induced by the charge transfer between the gas molecules and the MoSiGeN4 monolayer, as shown in Fig. 6. For NO adsorption, the DOSs curves are flipped, but the relative displacement is small near the Fermi level. For NO2 adsorption, the DOSs curves are flipped and shifted apparently to the lower energy. Moreover, the pristine MoSiGeN4 monolayer is nonmagnetic, but the NO or NO2 adsorption introduces spin polarization in the system with a magnetic moment of approximately 1 μB, as shown in Table 3. It is concluded that the magnetic property of the MoSiGeN4 monolayer is obviously caused by the gas adsorption, which reflects good sensing performance and makes these gas molecules easier to be detected.
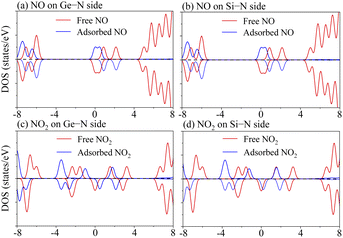 | ||
| Fig. 6 Total density of states (TDOSs) of free NO or NO2 molecules and partial density of states (PDOSs) of NO or NO2 molecules in adsorption system. | ||
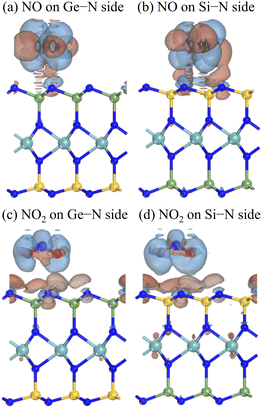
More profoundly, we presented the charge density difference and the Mulliken populations to understand the sensitivity of the Janus MoSiGeN4 monolayer for NO and NO2 molecules. The charge density difference is defined as
| Δρ = ρtotal − (ρlayer + ρgas) | (3) |
3.4. Possibility as a gas sensor
Due to the physisorption of NO or NO2 molecules, the electronic properties of the Janus MoSiGeN4 monolayer change with the slight charge transfer. Meanwhile, the decrease of band gap improves the electronic conductivity. Therefore, a resistive type gas sensor based on the MoSiGeN4 monolayer can be designed to distinguish and detect NO and NO2 molecules through the measurement of electronic signals affected by the resistance. Here, we discuss two important indicators of gas sensors, namely recovery time and sensitivity.The recovery time is an essential parameter for gas sensors, which represents the time for gas molecules to desorb from the substrate. Gas sensors with good performance should possess the reusable characteristic, which requires a relatively short recovery time. According to the transition station theory, the functional relationship between the recovery time (τ) and the adsorption energy (Ea) can be expressed as
 | (4) |
In addition to considering the gas desorption from the Janus MoSiGeN4 monolayer, whether or not the gas molecules will diffuse laterally on the surface of the substrate is another crucial issue, since it is directly related to the accuracy of the gas sensors and the stability of sensing signal.52,53 Based on this consideration, the most stable adsorption configuration and the second stable adsorption configuration of NO or NO2 molecules on the MoSiGeN4 monolayer were taken as the initial state and the final state, respectively. Fig. 8 shows the transition states in the diffusion processes of NO or NO2 molecules on two sides of the Janus MoSiGeN4 monolayer. On the Ge–N side, the energy barrier of NO2 molecule diffused from the Bridge site to the Top-N site is about 0.27 eV, which is close to that on the Si–N side. Compared with the diffusion of NO molecule, the energy barriers of NO2 molecule are significantly larger, which indicates that the NO2 adsorption is more conducive to the stable transmission of sensing signals. This conclusion is consistent with the previous discussion about adsorption energy and charge transfer. Additionally, it is worth noting that the diffusion of the NO molecule on the two sides of the Janus MoSiGeN4 monolayer is different, which may originate from the selectivity of the MoSiGeN4 monolayer to the NO molecule. A large energy barrier provides a guarantee for the accuracy of the gas sensors and the stability of the sensing signal. Thus, the sensing signal of the NO2 adsorption on the MoSiGeN4 monolayer is reliable.
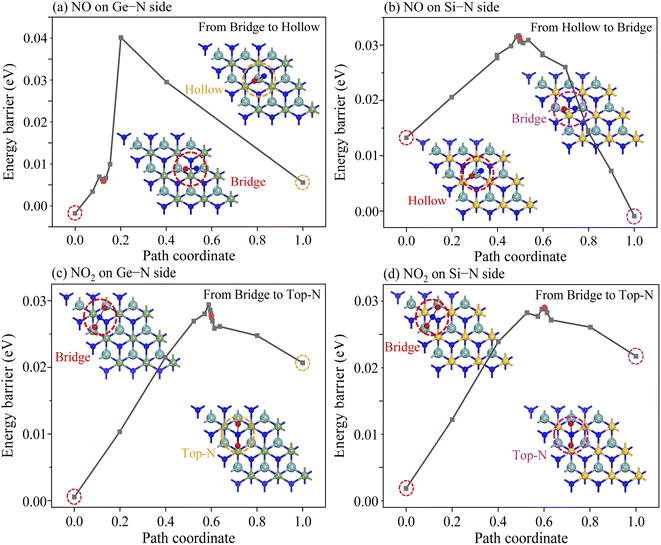 | ||
| Fig. 8 Energy evolution profiles of NO and NO2 molecules adsorbed on the Janus MoSiGeN4 monolayer from the most stable site to the second stable site. | ||
4. Conclusions
The adsorption behaviour and sensing performance of the Janus MoSiGeN4 monolayer for NO and NO2 molecules had been systematically investigated by first-principles calculations. It is found that the MoSiGeN4 monolayer exhibits structural stability and indirect gap semiconductor characteristic. The adsorption strength of the NO2 molecule on the Si–N side is stronger than that on the Ge–N side, while the NO molecule is opposite. Of course, both sides exhibit stronger adsorption interaction to the NO2 molecule, which indicates that the MoSiGeN4 monolayer has better selectivity to the NO2 molecule. Besides, the NO or NO2 adsorption can both induces the decrease of band gap and the emergence of impurity levels in the band structures, which significantly improves the electronic conductivity. The charge transfer of 0.03–0.04e between the NO2 molecule and the substrate surface shows that the MoSiGeN4 monolayer is sensitive to the NO2 molecule. In addition, it is confirmed that the recovery time of the NO2 desorption on the Si–N side of the MoSiGeN4 monolayer is longer, and the lateral diffusion is not easy to happen at an ambient temperature. Thus, it is predicted that the sensing signal of the NO2 molecule is possible to be detected on the MoSiGeN4 monolayer. The above conclusions provide guidance and support for the practical application of the MoSiGeN4 monolayer as gas sensors, especially as a NO2 gas sensor.Author contributions
The manuscript was written through contributions from all authors. All authors have given approval to the final version of the manuscript.Conflicts of interest
The authors declare no competing financial interest.Acknowledgements
This work was supported by the National “111 Research Centre” of Microelectronics and Integrated Circuits, the Outstanding Talent Foundation for Green Industry Leading Plan of HBUT (JCRC2021003), the Technology Cooperation Key Research and Development Program of Science and Technology Agency in Hubei Province (2021EHB018).Notes and references
- Z. Zhang, M. Haq, Z. Wen, Z. Ye and L. Zhu, Appl. Surf. Sci., 2018, 434, 891–897 CrossRef CAS.
- J. S. Kim, J. W. Yoon, Y. J. Hong, Y. C. Kang, F. Abdel-Hady, A. A. Wazzan and J. H. Lee, Sens. Actuators, B, 2016, 229, 561–569 CrossRef CAS.
- M. R. Wu, W. Z. Li, C. Y. Tung, C. Y. Huang, Y. H. Chiang, P. L. Liu and R. H. Horng, Sci. Rep., 2019, 9, 7459–7467 CrossRef PubMed.
- M. Kampa and E. Castanas, Environ. Pollut., 2008, 151, 362–367 CrossRef CAS PubMed.
- K. Wetchakun, T. Samerjai, N. Tamaekong, C. Liewhiran, C. Siriwong, V. Kruefu, A. Wisitsoraat, A. Tuantranont and S. Phanichphant, Sens. Actuators, B, 2011, 160, 580–591 CrossRef CAS.
- B. Hua and G. Shi, Sensors, 2007, 7, 267–307 CrossRef.
- J. Kong, N. R. Franklin, C. Zhou, M. G. Chapline and H. Dai, Science, 2000, 287, 622–625 CrossRef CAS PubMed.
- E. Comini, G. Faglia, G. Sberveglieri, Z. Pan and Z. L. Wang, Appl. Phys. Lett., 2002, 81, 1869–1871 CrossRef CAS.
- Y. Yong, X. Su, H. Cui, Q. Zhou, Y. Kuang and X. Li, ACS Omega, 2017, 2, 8888–8895 CrossRef CAS PubMed.
- N. Hakimi Raad, N. Manavizadeh, I. Frank and E. Nadimi, Appl. Surf. Sci., 2021, 565, 150454–150460 CrossRef.
- S. Thomas, V. Kumar, D. R. Roy and M. A. Zaeem, ACS Appl. Nano Mater., 2020, 3, 10073–10081 CrossRef CAS.
- J. Zhang, L. Liu, Y. Yang, B. Green and D. Zeng, Phys. Chem. Chem. Phys., 2021, 23, 15420–15439 RSC.
- J. Zhao, X. Huang, Y. Yin, Y. Liao, H. Mo, Q. Qian, Y. Guo, X. Chen, Z. Zhang and M. Hua, J. Phys. Chem. Lett., 2021, 12, 5813–5820 CrossRef CAS PubMed.
- Y. Kim, K. C. Kwon, S. Kang, C. Kim, T. H. Kim, S. P. Hong, S. Y. Park, J. M. Suh, M. J. Choi, S. Han and H. W. Jang, ACS Sens., 2019, 4, 2395–2402 CrossRef CAS PubMed.
- K. S. Novoselov, A. K. Geim, S. V. Morozov, D. Jiang, Y. Zhang, S. V. Dubonos, I. V. Grigorieva and A. A. Firsov, Science, 2004, 306, 666–669 CrossRef CAS PubMed.
- Q. He, S. Wu, Z. Yin and H. Zhang, Chem. Sci., 2012, 3, 1764–1772 RSC.
- F. Schedin, A. K. Geim, S. V. Morozov, E. W. Hill, P. Blake, M. I. Katsnelson and K. S. Novoselov, Nat. Mater., 2007, 6, 652–655 CrossRef CAS PubMed.
- Z. W. Hao, M. M. Dong, R. Q. Zhang, C. K. Wang and X. X. Fu, Phys. Chem. Chem. Phys., 2021, 23, 11852–11862 RSC.
- S. Yang, C. Jiang and S. H. Wei, Appl. Phys. Rev., 2017, 4, 021304–021337 Search PubMed.
- S. Zhao, J. Xue and W. Kang, Chem. Phys. Lett., 2014, 595–596, 35–42 CrossRef CAS.
- W. Ai, X. H. Hu, L. Pan, C. C. Chen, Y. F. Wang and X. D. Shen, Acta Phys. Sin., 2019, 68, 197101–197108 CrossRef.
- W. Yuan and G. Shi, J. Mater. Chem. A, 2013, 1, 10078–10091 RSC.
- Y. L. Hong, Z. Liu, L. Wang, T. Zhou and W. Ren, Science, 2020, 369, 670–674 CrossRef CAS PubMed.
- A. Bafekry, M. Faraji, M. M. Fadlallah, A. Abdolahzadeh Ziabari, A. Bagheri Khatibani, S. A. H. Feghhi, M. Ghergherehchi and D. Gogova, Appl. Surf. Sci., 2021, 564, 150326–150332 CrossRef CAS.
- W. Li, C. Ding, J. Li, Q. Ren, G. Bai and J. Xu, Appl. Surf. Sci., 2020, 502, 144140–144149 CrossRef CAS.
- C. Xiao, Z. Ma, R. Sa, Z. Cui, S. Gao, W. Du, X. Sun and Q. Li, ACS Omega, 2022, 7, 8706–8716 CrossRef CAS PubMed.
- X. Song, J. Hu and H. Zeng, J. Mater. Chem. C, 2013, 1, 2952–2969 RSC.
- J. Cui, T. Xiao, T. Xin, S. C. Smith, D. Ying and L. Kou, J. Mater. Chem. A, 2019, 7, 1099–1106 RSC.
- H. Dou, B. Yang, X. Hu, C. Huo, X. Wang and C. Shi, Comput. Theor. Chem., 2021, 1195, 113089–113096 CrossRef CAS.
- Q. Wu, L. Cao, Y. S. Ang and L. K. Ang, Nano Express, 2020, 1, 010042–010049 CrossRef.
- D. Wang, T. Lan, J. Pan, Z. Liu and M. Rong, Sens. Actuators, A, 2020, 311, 112049–112071 CrossRef CAS.
- D. Singh and R. Ahuja, Nanomaterials, 2020, 10, 2554–2570 CrossRef CAS PubMed.
- Y. Yu, J. Zhou, Z. Guo and Z. Sun, ACS Appl. Mater. Interfaces, 2021, 13, 28090–28097 CrossRef CAS PubMed.
- X. Tang and L. Kou, Phys. Status Solidi B, 2022, 259, 2100562–2100569 CrossRef CAS.
- Z. Wu, L. Li, T. Liao, X. Chen, W. Jiang, W. Luo, J. Yang and Z. Sun, Nano Today, 2018, 22, 62–82 CrossRef CAS.
- W. Kohn and L. J. Sham, Phys. Rev., 1965, 140, A1133–A1138 CrossRef.
- M. D. Segall, P. J. D. Lindan, M. J. Probert, C. J. Pickard, P. J. Hasnip, S. J. Clark and M. C. Payne, J. Phys.: Condens. Matter, 2002, 14, 2717–2744 CrossRef CAS.
- A. Tkatchenko and M. Scheffler, Phys. Rev. Lett., 2009, 102, 073005–073008 CrossRef PubMed.
- F. Ortmann, F. Bechstedt and W. G. Schmidt, Phys. Rev. B: Condens. Matter Mater. Phys., 2006, 73, 205101–205110 CrossRef.
- H. J. Monkhorst and J. D. Pack, Phys. Rev. B: Solid State, 1976, 13, 5188–5192 CrossRef.
- F. L. Hirshfeld, Theor. Chim. Acta, 1977, 44, 129–138 CrossRef CAS.
- B. Y. Wang, Z. R. Li, N. X. Tan, Q. Yao and X. Y. Li, J. Phys. Chem. A, 2013, 117, 3279–3291 CrossRef CAS PubMed.
- S. D. Guo, W. Q. Mu, Y. T. Zhu, R. Y. Han and W. C. Ren, J. Mater. Chem. C, 2021, 9, 2464–2473 RSC.
- Y. Yin, D. Li, Y. Hu, G. Ding, H. Zhou and G. Zhang, Nanotechnology, 2020, 31, 315709–315741 CrossRef CAS PubMed.
- X. Zhang, Y. Cui, L. Sun, M. Li, J. Du and Y. Huang, J. Mater. Chem. C, 2019, 7, 13203–13210 RSC.
- M. Marsman, J. Paier, A. Stroppa and G. Kresse, J. Phys.: Condens. Matter, 2008, 20, 064201–064210 CrossRef CAS PubMed.
- F. Li and C. Shi, Appl. Surf. Sci., 2018, 434, 294–306 CrossRef CAS.
- Y. Yong, H. Cui, Q. Zhou, X. Su, Y. Kuang and X. Li, RSC Adv., 2017, 7, 51027–51035 RSC.
- B. Cho, M. G. Hahm, M. Choi, J. Yoon, A. R. Kim, Y. J. Lee, S. G. Park, J. D. Kwon, C. S. Kim, M. Song, Y. Jeong, K. S. Nam, S. Lee, T. J. Yoo, C. G. Kang, B. H. Lee, H. C. Ko, P. M. Ajayan and D. H. Kim, Sci. Rep., 2015, 5, 8052–8057 CrossRef CAS PubMed.
- G. D. Re, P. Otto and J. Ladik, Isr. J. Chem., 2013, 19, 265–271 CrossRef.
- Y. Yong, X. Su, Q. Zhou, Y. Kuang and X. Li, Sci. Rep., 2017, 7, 17505–17516 CrossRef PubMed.
- P. Hu, S. Wang and Y. Zhuo, Sep. Purif. Technol., 2021, 275, 119182–119190 CrossRef CAS.
- P. Hu, Q. Weng, D. Li, T. Lv, S. Wang and Y. Zhuo, Chemosphere, 2020, 257, 127243–127256 CrossRef CAS PubMed.
| This journal is © The Royal Society of Chemistry 2022 |

