 Open Access Article
Novel fluorescence sensor for the selective recognition of tetracycline based on molecularly imprinted polymer-capped N-doped carbon dots†
Qihui Wanga,
Yiwen Wua,
Xumei Baoa,
Min Yanga,
Jun Liu b,
Kang Suna,
Zhonghui Li*a and
Guowei Deng
 *a
*a
aCollege of Chemistry and Life Science, Sichuan Provincial Key Laboratory for Structural Optimization and Application of Functional Molecules, Chengdu Normal University, Chengdu, 611130, China. E-mail: zhonghli@sohu.com; guoweideng86@163.com
bSichuan Key Laboratory of Medical Imaging & Department of Chemistry, School of Preclinical Medicine, North Sichuan Medical College, Nanchong, 637000, China
First published on 31st August 2022
Abstract
A novel fluorescent probe based on molecularly imprinted polymers (MIPs) coupled with N-doped carbon dots (CDs) was prepared and used for specific recognition and sensitive determination of tetracycline (TC). N-doped CDs were synthesized using citric acid as a carbon source and ethylenediamine as a nitrogen source by a microwave assisted pyrolysis method. The determination conditions such as the solvents, material amount, pH value, and temperature were optimized. The CDs-MIPs have the best quenching on TC in water. The proposed method used for TC determination in milk powder samples had a detection limit of 0.054 μg mL−1 and a wide range of 0.5–30 μg mL−1. Meanwhile, satisfactory recoveries were obtained ranging from 95 to 108%. Oxytetracycline, chlorotetracycline and most of the coexisting substances showed no obvious interference indicating that the CDs-MIP probe exhibited high selectivity due to the presence of imprinted sites. Charge transfer from CDs-MIPs to TC may be through the mechanism of fluorescence quenching. This work gives a feasible strategy for the synthesis of N-doped carbon dot based molecularly imprinted polymers used as a fluorescent sensor in the food analysis field.
Introduction
Tetracycline (TC) is a broad-spectrum antibiotic produced by Streptomyces.1 It has been widely used in the treatment of edible animal diseases and drug additives.2 Because of its broad spectrum, ease of use, economy3 and other characteristics, it is often used to prevent and treat animal diseases.4 Excessive tetracycline will remain in animal derived food and enter the human body with the food chain,5 which is a serious threat to human health.6 In order to effectively prevent the abuse of tetracycline drugs, the European Union directive of 675/92 requires that the total amount of tetracycline compounds in milk shall not exceed 100 μg kg−1. The maximum residue limit of veterinary drugs in animal food issued by the Ministry of agriculture of China stipulates that the residue limit of tetracycline, oxytetracycline and chlorotetracycline in milk is 100 μg L−1. Therefore, an efficient approach to detect trace TC in milk is of great significance.Nowadays, many methods were used to determination of TC, such as high-performance liquid chromatography,7 high performance liquid chromatography-mass spectrometry,8 adsorptive voltammetry,9 electrochemical sensor,10 capillary electrophoresis,11 etc. Traditional chromatographic techniques have good sensitivity and high repeatability. However, there are some disadvantages, such as complex sample pretreatment, expensive equipment, large use of organic solvents, long determination time and so on, which limits its application. Hence, it is still necessary to construct a kind fast respond method, such as the fluorescence analysis.12 The selective fluorescence probes showed a potential application in the field of TC determination.
Carbon dots (CDs) are a kind of fluorescent nanomaterials, which have attracted extensive attention due to excellent optical properties and biocompatibility, simple preparation process, low toxicity and relatively low cost.13,14 Because of these advantages, CDs are widely applied in many fields such as bio-imaging, photocatalysis, sensors, and drug delivery. CDs can be synthesized by many methods including hydrothermal reactions,15 microwave-assisted technique,16 laser ablation,17 chemical oxidation18 and solid-state reaction.19 Compared with other methods, microwave-assisted technology has many advantages, such as simplicity, environmental protection, economy, short reaction time, low energy consumption and high reaction yield. The synthesis of CDs can use the microwave oven. However, CDs with poor selectivity will limited application in some chemical sensor applications. In order to improving selectivity, molecularly imprinted polymers (MIPs) are also an ideal choice.
In recent years, molecularly imprinting is used as a technique for the preparation of polymers with recognition sites of molecules. Molecularly imprinting comes from immunology and is developed by imitating the interaction between antigen and antibody. The MIPs have high specificity and have the advantages of resistance to high temperature, high pressure, acid-base and organic solvents, and can be reused for many times. Pengqi Guo et al. developed MIP coated CdTe quantum dots (MIP@CdTe QDs) were prepared as fluorescence sensors for AFB1.20 A new type of thermo-sensitive receptor carbon dots/SiO2/molecularly imprinted polymer (CDs/SiO2/MIP) was prepared to recognition cytochrome c with the detection limit was 89 nM.21 However, MIPs base on carbon dots synthesized by many methods were used in organic solvents,22 which will increases the determination cost, causes environmental pollution, and also limits the practical application. Therefore, it is necessary to synthesize MIPs base on carbon dots used in water environment.
In this work, a novel fluorescent probe based on molecularly imprinted technique coupled with N-doped carbon dots was prepared using microwave assisted pyrolysis method and used for specific recognition and sensitive determination of tetracycline in water. The determination conditions such as the solvents, material amount, pH value, and temperature were optimized. The proposed method used for TC determination in milk powder samples with satisfactory results.
Experimental
Chemicals
The tetracycline (TC), oxytetracycline (OTC), chlorotetracycline (CTC), tetraethoxysilane (TEOS), ethylenediamine and 3-aminopropyl triethoxysilane (APTES) were purchased from Adamas-Beta® (Shanghai, China). Ammonia, diethyl ether, Na2HPO4, methanol, acetonitrile, acetone, anhydrous ethanol, Na2EDTA and citric acid monohydrate were obtained from Chengdu Kelong Chemical Reagent Factory (Chengdu, China). The milk powder samples were purchased from markets in Chengdu (China). All chemicals were of analytical pure grade otherwise stated. Distilled water was used throughout. The stock standard solution of TC (1.0 mg mL−1) was prepared by dissolving TC in distilled water. The working standard solutions were prepared by diluting stock standard solutions with distilled water. The Na2EDTA-McIlvaine buffer (0.1 mol L−1, pH 4.0) solution was produced by dissolving Na2HPO4 (8.86 g), Na2EDTA (16.81 g) and citric acid monohydrate (5.90 g) in 500 mL of water.23Instrumentation
Powder X-ray diffraction (XRD) measurements were performed on a SmartLab (Rigaku) laboratory diffractometer with a Cu Kα radiation in the 2θ range of 10–80° at 298 K. Fourier transform infrared (FT-IR) spectrum was observed with a Nicolet NEXUS spectrometer (Madison, WI, USA). The morphology of the CDs-MIPs was visualized using a scanning electron microscope (SEM, ZEISS Merlin, Germany) and Transmission electron microscope (TEM, FEI Talos F200S, Thermo Scientific, USA). Raman spectroscopy was observed with Thermo Scientific DXR 2Xi (USA). The fluorescent lifetimes and quantum yield were performed on FLS 1000-STM steady/transient fluorescence spectra instrument. X-ray photo-electron spectroscopy (XPS) was performed with a Thermo Fisher Scientific K-Alpha electron spectrometer. The UV spectrum was collected by UV-2600 spectrometer (Shimadzu instrument, Suzhou, China). Fluorescence determination was carried out on an F-4600 fluorescence spectrophotometer (Hitachi, Japan). A pHs-3C digital pH meter (Shanghai Lei Ci Device Works, Shanghai, China) was used for the pH adjustments.Synthesis and surface modification of CDs
N-doped CDs (N-CDs) was synthesized using microwave assisted pyrolysis method as the literature reported.16 Citric acid (0.2 g) was dissolved in 5 mL water followed by the dropwise addition of 1 mL ethylenediamine under vigorous magnetic stirring. The mixture was pyrolyzed at 700 W for 5 min in a microwave oven (Midea, China) to form the red-brown product. Anhydrous ethanol (20 mL) was added, and the sample was sonicated for 30 min to form muddy dispersion. The purified N-CDs were separated after several cycles of centrifugation and wash with anhydrous ethanol. Finally, the sample was rotary evaporation and vacuum-dried overnight at 80 °C. The modified CDs (N-CDs-NH2) was prepared by 20 mL of N-CDs (1 mg mL−1) and 2 mL of APTES (dropwise). The resulting solution was stirred for 24 h at 60 °C. Finally, N-CDs-NH2 were extracted by diethyl ether twice.24Preparation of CDs-MIPs and CDs-NIPs
The imprinted polymer-coated CDs (CDs-MIPs) were synthesized via a sol-gel process.25 Firstly, 125 mg TC (template molecule) was dissolved in 50 mL ethanol by ultrasound, and 100 mg N-CDs-NH2 were added. Then, TEOS (1.25 mL), APTES (250 μL) and NH3·H2O (500 μL) were added into the mixture with stirring for 24 h at room temperature. The product was washed with ethanol and water. The TC template was washed by soxhlet extraction with methanol and acetic acid (95![[thin space (1/6-em)]](https://www.rsc.org/images/entities/char_2009.gif) :
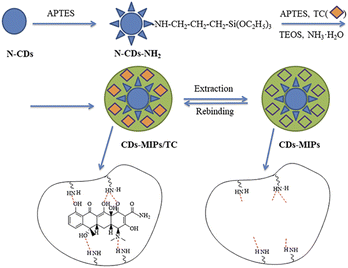
:![[thin space (1/6-em)]](https://www.rsc.org/images/entities/char_2009.gif) 5, v/v) until no TC detecting. The CDs-MIPs were dried under vacuum oven at 60 °C for 8 h. The non-imprinted polymer-coated CDs (CDs-NIPs) were synthesized consistent with the described method without adding TC. The sample was analysed using FTIR, XPS, SEM, TEM, raman spectroscopy and XRD analysis to confirm the successful formation of CDs-MIPs. The synthetic route of CDs-MIPs is illustrated in Fig. 1.
5, v/v) until no TC detecting. The CDs-MIPs were dried under vacuum oven at 60 °C for 8 h. The non-imprinted polymer-coated CDs (CDs-NIPs) were synthesized consistent with the described method without adding TC. The sample was analysed using FTIR, XPS, SEM, TEM, raman spectroscopy and XRD analysis to confirm the successful formation of CDs-MIPs. The synthetic route of CDs-MIPs is illustrated in Fig. 1.
Fluorescent measurement
For obtaining the fluorescent spectra, the excitation wavelength was set at 360 nm, and the spectral range was selected between 400 and 700 nm. The parameters such as excitation voltage (600 V) and slit widths (10 nm) were set. The TC standard solution (25 μg mL−1, 2 mL) was mixed well with 1.5 mg CDs-MIPs at 25 °C at pH = 7 adjusted by 0.1 mol L−1 HCl and 0.1 mol L−1 NaOH. The fluorescence intensity was recorded in the absence and presence of TC and assigned as F0 and F, respectively. Each parameter was measured three times in parallel.The pretreatment of milk powder sample
The milk powder sample (2 g) was firstly dissolved completely in 20 mL of 0.1 mol L−1 Na2EDTA-McIlvaine buffer (pH 4.0). Three different concentrations (1.25, 5 and 25 μg mL−1) of TC were separately spiked into the milk powder sample solution, sonicated for 2 minutes. The resulting milk powder samples were filtered with a 0.22 μm membrane to remove impurities. The spiked milk powder samples (2 mL) were mixed with the 1.5 mg CDs-MIPs at 25 °C under the condition of pH = 7 adjusted by 0.1 mol L−1 HCl and 0.1 mol L−1 NaOH. After fully reacting, the samples were used for fluorescence analysis. Three parallel experiments for each sample.Results and discussion
Characterization of CDs-MIPs
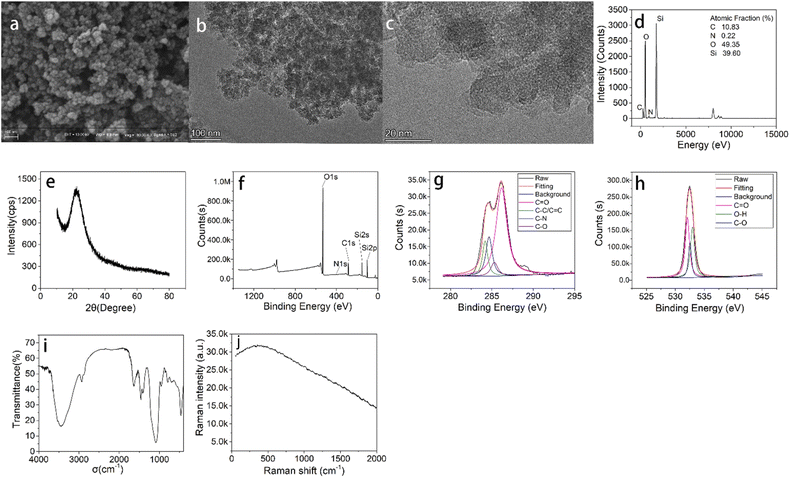
The N-doped CDs were prepared within five minutes by microwave assisted pyrolysis method. The introduction of ethylenediamine makes the CDs with more surface functional groups. Before polymerization, the surface of N-CDs was chemically modified by the APTES which was used as the precursor of silica layer (N-CDs-NH2). Then, the CDs-MIPs nanoparticles were synthesized by polymerization reaction by sol-gel hydrolysis. In this system, APTES as functional monomer, TEOS as crosslinker, NH3·H2O as catalyst in the presence of CDs-NH2 and TC. Fluorescence quenching occurred after TC was introduced into the CDs-MIPs. This was mainly due to the addition of an effective electron acceptor (template molecule, TC) which affected the electron-hole recombination at the CDs-MIPs interface. When the template molecule TC is absent in the complex, the recombination of electrons and holes can lead to fluorescence. To confirm the successful synthesis of the CDs-MIPs composite and further investigate its physical and chemical properties, a series of characterizations were conducted, and the results are shown in Fig. 2.SEM and TEM are used to observe the morphology. Fig. 2a displays the SEM image of as-prepared CDs-MIPs showing that the CDs-MIPs is mostly spherical in structure but there is some aggregation.
The TEM image of CDs-MIPs (Fig. 2b and c) also shows CDs-MIPs has a similar spherical and loose structure, indicating that the CDs-MIPs probably has a large surface area and is beneficial to the adsorption of TC molecules. The EDX spectra of the CDs-MIPs of CDs-MIPs was showed in Fig. 2d. The component of CDs-MIPs contains C, N, O, and Si elements and the atomic fraction of them are 10.83%, 0.22%, 49.35% and 39.60%, respectively. Higher atomic fraction of Si element revealed that the MIP was successfully attached to N-CDs.
As can be seen from Fig. 2e, CDs-MIPs has a broad peak around 2θ = 22° can correspond to the C (002) plane, indicating that the CDs-MIPs is amorphous structure.26
The surface elements of the N-CDs and CDs-MIPs are analysed by XPS. The full-scan XPS spectra of N-CDs is showed in Fig. S2.† The component of N-doped carbon dots contains C, O, and N elements and the ratio of them are 61.55%, 29.54%, 8.91%, respectively. Therefore, it can be explained by XPS results that the carbon dots are doped with N element in this work. The full range XPS analysis clearly showed (Fig. 2f) five peaks at 109.98, 153.89, 285.87, 409.98, and 544.98 eV, which were attributed to Si 2p, Si 2s, C 1s, N 1s, and O 1s, respectively. The XPS spectra of CDs-MIPs confirmed the presence of Si element. The result supported that the CDs-MIPs have been successfully synthesized. The strength of the peaks of XPS for CDs-MIPs were shown in Table S1.† In addition, C 1s, O 1s high resolution spectra of CDs-MIPs were shown in Fig. 2g and h. High-resolution C 1s spectra revealed the presence of C![[double bond, length as m-dash]](https://www.rsc.org/images/entities/char_e001.gif) O, C–O, C–N and C
O, C–O, C–N and C![[double bond, length as m-dash]](https://www.rsc.org/images/entities/char_e001.gif) C bonds owing to the presence of peaks at 286.2, 285.3, 284.7 and 284.2 eV, respectively. In the case of high resolution O 1s spectra: one peak is located at about 533.5 eV, correlated to C
C bonds owing to the presence of peaks at 286.2, 285.3, 284.7 and 284.2 eV, respectively. In the case of high resolution O 1s spectra: one peak is located at about 533.5 eV, correlated to C![[double bond, length as m-dash]](https://www.rsc.org/images/entities/char_e001.gif) O bonds, the other peak is located at 536.4 eV assigned to C–O bonds, the third peak is located at 537.3 eV assigned to O–H bonds.
O bonds, the other peak is located at 536.4 eV assigned to C–O bonds, the third peak is located at 537.3 eV assigned to O–H bonds.
The FTIR spectroscopy of CDs-MIPs was shown in Fig. 2i. The peak around 3451.9 cm−1 is the N–H vibration absorption peak. The peak around 2929.3 cm−1 is the vibration absorption peak of C–H. The appearance of the peak at 1637.2 cm−1 was attributed to C![[double bond, length as m-dash]](https://www.rsc.org/images/entities/char_e001.gif) O vibration of carboxylic acids, possibly emanated from the free carboxyl functions of CDs. The absorption band at 1455.9 cm−1 correspond to stretching vibrations of C–O–C group. Additionally, the strong peak identified at 1085.7 cm−1 most likely correspond to O–Si–O stretching vibration. The asymmetric stretching vibration peaks show the vibrational peak of Si–O bond at 460.9 cm−1 and 790.7 cm−1, which are the same as the previous literature.27
O vibration of carboxylic acids, possibly emanated from the free carboxyl functions of CDs. The absorption band at 1455.9 cm−1 correspond to stretching vibrations of C–O–C group. Additionally, the strong peak identified at 1085.7 cm−1 most likely correspond to O–Si–O stretching vibration. The asymmetric stretching vibration peaks show the vibrational peak of Si–O bond at 460.9 cm−1 and 790.7 cm−1, which are the same as the previous literature.27
The Raman spectrum of CDs-MIPs is presented in Fig. 2j. The 1350 cm−1 (D band) and 1598 cm−1 (G band) which corresponded to the degree of crystal disorder and scattered vibration mode were not observed.28 Therefore, the carbon lattice content of the CDs-MIPs was quite low. In addition, CDs-MIPs have high fluorescence intensity, the Raman characteristic is probably destroyed.29
Luminescence properties of N-CDs and CDs-MIPs
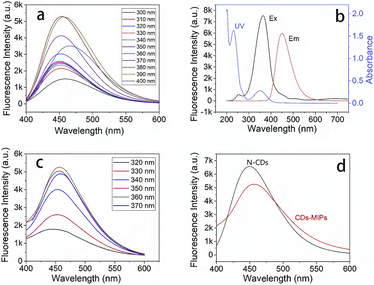
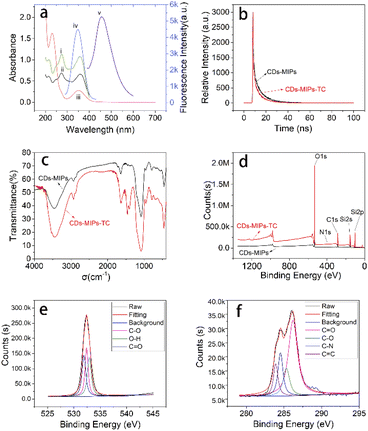
Luminescence properties of N-CDs and CDs-MIPs were showed in Fig. 3. For N-CDs (Fig. 3a), as the excitation wavelength increased (300–400 nm), the emission peak showed a slight red shift. A possible reason is the existence of surface energy trap distribution and different particle sizes of N-CDs. As shown in Fig. 3b, the absorption peak at 350 nm of UV absorption spectra of N-CDs (iii), which is ascribed to the n–π* transition of C![[double bond, length as m-dash]](https://www.rsc.org/images/entities/char_e001.gif) O, which partially overlays the excitation spectra of N-CDs (i). The maximum emission wavelength was 449 nm (ii). For CDs-MIPs, as showed in Fig. 3c, there is no obvious difference in the emission wavelength when the excitation wavelength increased (320–370 nm). The maximum emission wavelength was 455 nm. The quantum yield of CDs-MIPs was measured using the absolute quantum yield method, and the measurement result was 0.79%. Compared with the emission spectra of N-CDs, the maximum emission wavelength of CDs-MIPs was slightly red shifted and the shape also widens slightly (Fig. 3d). Fluorescence intensity of CDs-MIPs was the lower compared with N-CDs at 1.0 mg mL−1. This might be assigned to the variability of groups present on the surface of CDs-MIPs. In addition, after continuous irradiation for 5 minutes, the emission intensity of CDs-MIPs did not change significantly.
O, which partially overlays the excitation spectra of N-CDs (i). The maximum emission wavelength was 449 nm (ii). For CDs-MIPs, as showed in Fig. 3c, there is no obvious difference in the emission wavelength when the excitation wavelength increased (320–370 nm). The maximum emission wavelength was 455 nm. The quantum yield of CDs-MIPs was measured using the absolute quantum yield method, and the measurement result was 0.79%. Compared with the emission spectra of N-CDs, the maximum emission wavelength of CDs-MIPs was slightly red shifted and the shape also widens slightly (Fig. 3d). Fluorescence intensity of CDs-MIPs was the lower compared with N-CDs at 1.0 mg mL−1. This might be assigned to the variability of groups present on the surface of CDs-MIPs. In addition, after continuous irradiation for 5 minutes, the emission intensity of CDs-MIPs did not change significantly.
Optimization of determination conditions of CDs-MIPs
In order to obtain the best determination conditions, the solvents, material mass, pH value, and temperature were optimized respectively. Firstly, we explored the effect of solvents on the quenching fluorescence intensity of CDs-MIPs on TC. The CDs-MIPs were used in methanol, acetonitrile, water, acetone and ethanol, respectively when fixed concentration of TC (25 μg mL−1, 2 mL) and CDs-MIPs mass (2 mg). It can be seen from Fig. 4a that water was the most suitable solvent. Compared with other solvents, the polarity of water is the largest. CDs-MIPs have the best quenching on TC in water was probably due to quenching require the activation of hydrogen proton. Compared with determination in organic solvents,22,30 it has better applicability in aqueous solution determination.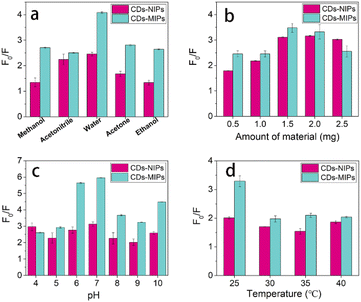 | ||
| Fig. 4 Optimization of experimental conditions for TC ((a) solvents. (b) Material amount. (c) pH Value. (d) temperature). | ||
The interaction between the CDs-MIPs and TC was affected by the amount of material. The results in Fig. 4b showed that the value of F0/F increase first and then decrease with the increase of CDs-MIPs mass when fixed concentration of TC (25 μg mL−1, 2 mL). The optimum CDs-MIPs amount was 1.5 mg. When the mass of CDs-MIPs>1.5 mg, the value of F0/F decrease due to the self-quenching effect and the aggregation of the CDs-MIPs. Therefore, the selected the mass of CDs-MIPs was 1.5 mg.
The pH value is a very important parameter due to its relationship with the ionic form of the TC. As shown in Fig. S1,† The pKa values of TC were 3.3, 7.7, and 9.7.31 At different pH values, TC molecules had different ion states, such as H3TC+, H2TC0, HTC−, and TC2−. The pH value of the solution was selected as pH 4–10 when fixed concentration of TC (25 μg mL−1, 2 mL) and CDs-MIPs mass (1.5 mg), and the results were shown in Fig. 4c. The value of F0/F was decreased whether increasing or decreasing the pH, indicating that the reaction was best under pH = 7. When pH = 7, TC molecules existed mainly as anions state (H3TC+ and H2TC0), which electrostatically repelled the positive charged APTES amino (pKa = 9.7) in CDs-MIPs. Therefore, the hydrogen bonds were proposed to be the mechanism between CDs-MIPs and TC.
The temperature has a significant influence on the quenching process. Considering the possible influence of the temperature (25, 30, 35, 40 °C, Fig. 4d) on the detecting process when fixed concentration of TC (25 μg mL−1, 2 mL) and CDs-MIPs mass (1.5 mg), the value of F0/F for CDs-MIPs quenched by TC reached a maximum when the temperature was 25 °C.
In addition, the solvents, material mass, pH value, and temperature were studied of CDs-NIPs on TC determination. The quenching effects were not as good as that of CDs-NIPs on TC. Experimental results showed that CDs-MIPs have greater fluorescence intensity reduction than CDs-NIPs at the same concentration of TC.
Tetracycline recognition by CDs-MIPs
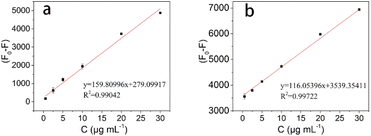
Since the fluorescence of the CDs-MIPs composite can be sensitively quenched by TC, the as-prepared CDs-MIPs was applied for determination of TC. The calibration curve for TC was established after optimizing experimental conditions. To investigate the fluorescence quenching efficiency of TC for CDs-MIPs, the Stern–Volmer equation ((F0–F)/F=KSV c) was used to assess the quenching efficiencies of CDs-MIPs and CDs-NIPs, where KSV is the Stern–Volmer constant and c is the concentration of TC. The relationship between the difference fluorescence intensity (F0–F) and TC concentration was plotted and results are shown in Fig. 5. As can be seen, (F0–F) have a better linear relationship than (F0–F)/F with TC concentration between 0.5 and 30 μg mL−1 (Fig. S2†), which is similar with that in the literature.32 The regression equations of CDs-MIPs and CDs-NIPs were listed as follows: (F0–F) = 159.80996c + 279.09917 (CDs-MIPs) and (F0–F) = 116.05396c + 3539.35411 (CDs-NIPs). The correlation coefficients (R2) of above calculated equations of CDs-MIPs and CDs-NIPs were 0.99042 and 0.99722, respectively. The limit of detection (LOD) based on the three times ratio of the blank standard deviation to slope (LOD = 3σ/K). The K is the slope of the calibration curve. The blank standard deviation (σ) is obtained by measuring a blank solution without adding tetracycline 12 times. The LOD was calculated to be 0.054 μg mL−1. The relative standard deviation (RSD) for three replicate determinations was 3.7%.Evaluation of specificity and anti-interference capability
As can be seen in Fig. 6a, TC has a best effect on the fluorescence quenching of CDs-MIPs than OTC and CTC even if they have similar structures (Fig. S3†). This is due to the surface of the CDs-MIPs provides specific binding sites to TC. Therefore, CDs-MIPs have specific recognition for TC molecule. The imprinting factor (IF) was used to assess the selectivity of materials based on KSV,MIP/KSV,NIP. Under optimal conditions, the IF was 1.4, which indicated that CDs-MIPs can increase selectivity to TC determination.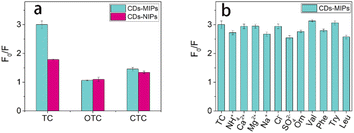 | ||
| Fig. 6 (a) Selective adsorption of TC, OTC and CTC by the CDs-MIPs and CDs-NIPs. (b) Selectivity study of interfering substances to the CDs-MIPs on the determination system of TC. | ||
Interfering substances that may exist in the samples are also important factors that must be considered before the probe can be used in practice. Ions NH4+, Ca2+, Mg2+, Na+, Cl−, and SO42−(800 μM for each); amino acids and small biological molecules (800 μM for each) including ornithine (Orn), valine (Val), phenylalanine (Phe), tryptophan (Try), and isoleucine (Leu) were introduced to a detected system (TC, 25 μg mL−1, 2 mL), respectively. As shown in Fig. 6b, most of the coexisting substances showed no obvious interference suggesting that the CDs-MIPs on TC determination had high anti-interference ability.
Real sample analysis
The accuracy and practicality of the developed CDs-MIPs fluorescent probe for TC analysis in the real milk powder samples were assessed. Three different concentrations (1.25, 5 and 25 μg mL−1) of TC were separately spiked into the milk powder sample solution, sonicated for 2 minutes. The determination of TC in milk power sample was also based on optimized experimental conditions. The fluorescence signals at 455 nm were recorded under the excitation wavelength of 360 nm. As can been seen in Table 1, satisfying recoveries were obtained that ranged from 95 to 108% for TC with RSDs lower than 7.0%. The results demonstrating the developed fluorescent sensor has good accuracy and reproducibility and can be used for sensing TC in real sample. Comparative information from some studies on determination of TC by various methods is given in Table 2. Compared with other methods, the determination limit of was slightly higher, and it will be improved in future experiment. However, the sample pre-treatment process of liquid chromatography is complex, fluorescence analysis has the advantages of simple and fast. On the other hand, the molecular imprinting technique used in this method improve the selectivity and anti-interference ability.| Method | Probe | Linear range (μg mL−1) | LOD (μg mL−1) | RSD (%) | Recovery (%) | Ref. |
|---|---|---|---|---|---|---|
| Spectrophotometric | Yttrium (III) complex | 4.4–178 | 2.18 | 1.5–3.3 | 99.8–100.6 | 33 |
| Electrochemical | Antimony film electrode | 0.178–1.33 | 0.67 | 0.41–8.23 | 91.81–109.7 | 34 |
| Surface plasmon resonance | Silver nanoparticles | 0.05–5.0 | 0.013 | 3.6 | 100.0–103.3 | 35 |
| Localized surface plasmon resonance | Silver nanoparticles | 0.2–0.8 | 0.0527 | 6.22 | 82.8–116 | 36 |
| LC-MS/MS | — | 0.1 × 10⁻³–0.1 | 0.66 × 10⁻³ | 7.9–14.8 | 87.4 | 37 |
| HPLC-UV | — | 0.02–1.0 | 5 × 10⁻³ | 3.27–5.73 | 80.92–86.84![[thin space (1/6-em)]](https://www.rsc.org/images/entities/char_2009.gif) |
38 |
| Fluorescent | CDs-MIPs | 0.5–30 | 0.054 | 1.35–6.33 | 95–108 | This work |
Mechanism of the TC determination system
Several techniques including UV-vis, FTIR, XPS, and fluorescence lifetimes analysis were used to discuss determination mechanisms of TC determination. Charge transfer or energy transfer from CDs-MIPs to TC may be the mechanism of fluorescence quenching.39 Fig. 7a indicated the UV absorption peaks of the CDs-MIPs+TC (359 nm) changed slightly compared with TC (357 nm), which indicated that the CDs-MIPs have an interaction with TC through a static process. In addition, the absorption band of TC had overlap with the CDs-MIPs’ excitation, the possible reason for the decrease of the observed intensity due to the inner filter effect process (IFE). On the other hand, the fluorescence intensity (F0–F) changes linearly with the TC concentration is linear (Fig. 5), static quenching is also considered.40 In addition, the UV absorption spectrum of TC has two peaks located at 274 nm and 357 nm, which was close to the band gap of the CDs-MIPs (360 nm). Therefore, the excited electron could transfer to the lowest unoccupied molecular orbital of the TC, leading to the quenching of CDs-MIPs fluorescence.41As shown in Fig. 7b, fluorescence lifetime experiments were also carried out to study the fluorescence attenuation characteristics of CDs-MIPs in the presence and absence of TC at 360 nm excitation wavelength. The fluorescence lifetime (τ value) of CDs-MIPs and CDs-MIPs+TC is 7.22 and 6.05 ns, respectively. The fluorescence lifetimes of CDs-MIPs with and without TC changed very small indicating that the fluorescence resonance energy transfer effect (FRET) is not exist in this work.42 In addition, there was no significant overlap between the UV absorption spectrum of TC and the emission spectrum of CDs-MIPs (Fig. 7a). This also shows that the fluorescence quenching of CDs-MIPs is not caused by FRET when TC is present.
As can been seen in Fig. 7c, the vibration peaks of FTIR spectra at 3451.9, 1637.2, 1455.9 and 1085.7 cm−1 of CDs-MIPs showed no obvious shift when TC was introduced in CDs-MIPs. The results showed that new functional group was not founded during the binding process of the TC with CDs-MIPs. In addition, the XPS spectra of CDs-MIPs and CDs-MIPs+TC also were shown in Fig. 7d. The O 1s and C 1s high resolution spectra of CDs-MIPs+TC were shown in Fig. 7e and f. The strength of the peaks of XPS for CDs-MIPs+TC were shown in Table S2†. Compared with the XPS spectra of CDs-MIPs, the XPS spectra of CDs-MIPs+TC showed no obvious peak. High-resolution O 1s and C 1s spectra of CDs-MIPs+TC revealed no new chemical bonds when TC was added in CDs-MIPs. In summary, the fluorescence quenching of the CDs-MIPs for TC determination mechanisms in this study could be IEF and charge transfer.
Conclusions
In this work, a novel molecularly imprinted fluorescent probe toward to TC based on N-doped CDs was designed. OTC, CTC and most of the coexisting substances showed no obvious interference indicated CDs-MIPs probe exhibited the high selectivity due to the presence of imprinted sites. For TC determination, LOD was 0.054 μg mL−1 within a wider range of 0.5–30 μg mL−1. Satisfying recoveries were obtained that ranged from 95 to 108% demonstrating this developed fluorescent sensor has good accuracy and reproducibility and can be used for sensing TC in real samples.Author contributions
Qihui Wang: data curation, methodology, investigation, writing-original draft. Yiwen Wu: data curation. Xumei Bao: data curation. Min Yang: writing-review. Jun Liu: writing-review & editing. Kang Sun: investigation, writing-review & editing. Zhonghui Li: funding acquisition, project administration. Guowei Deng: writing-review & editing, funding acquisition, project administration.Conflicts of interest
The authors declared that they have no conflicts of interest in this study.Acknowledgements
This work was funded by the project of Chengdu Normal University (No. CS18ZDZ01), the Sichuan Provincial Students' Innovation and Entrepreneurship Training Program (No. S202114389151), Scientific Research Innovation Team Funds of Chengdu Normal University (No. CSCXTD2020A05) and the Special Projects of Central Government Guiding Development of Local Science and Technology (No. 2021ZYD0065).References
- F. Correddu, A. Nudda, M. G. Manca, G. Pulina and T. K. Dalsgaard, J. Agric. Food Chem., 2015, 63, 3980–3986 CrossRef CAS PubMed.
- T. Wu, Q. Xue, F. Liu, J. Zhang, C. Zhou, J. Cao and H. Chen, Chem. Eng. J., 2019, 366, 577–586 CrossRef CAS.
- Y. Jin, J. Zhang, W. Zhao, W. Zhang, L. Wang, J. Zhou and Y. Li, Food Chem., 2017, 221, 1298–1307 CrossRef CAS PubMed.
- N. W. Shappell, W. L. Shelver, S. J. Lupton, W. Fanaselle, J. M. Van Doren and H. Hakk, J. Agric. Food Chem., 2017, 65, 938–949 CrossRef CAS PubMed.
- J. A. O. Granados, P. Thangarasu, N. Singh and J. M. Vázquez-Ramos, Food Chem., 2019, 278, 523–532 CrossRef CAS PubMed.
- X. Liu, Z. Zhang, J. Peng and Y. He, Anal. Methods, 2014, 6, 9361–9366 RSC.
- H. Saleh, M. Elhenawee, E. M. Hussien, N. Ahmed and A. E. Ibrahim, Food Anal. Methods, 2021, 14, 36–43 CrossRef.
- F. C. Sun, X. W. Li, L. L. Li, Y. Q. Ding and H. Zhao, Adv. Mat. Res., 2013, 718–720, 1071–1076 Search PubMed.
- A. Sultana, K. Sazawa, M. S. Islam, K. Sugawara and H. Kuramitz, Anal. Lett., 2019, 52, 1153–1164 CrossRef CAS.
- L. Devkota, L. T. Nguyen, T. T. Vu and B. Piro, Electrochim. Acta, 2018, 270, 535–542 CrossRef CAS.
- G. Islas, J. A. Rodriguez, I. Perez-Silva, J. M. Miranda and I. S. Ibarra, J. Anal. Methods Chem., 2018, 2018, 5394527 Search PubMed.
- T. Wang, Q. Mei, Z. Tao, H. Wu, M. Zhao, S. Wang and Y. Liu, Biosens. Bioelectron., 2020, 148, 111791 CrossRef CAS PubMed.
- L. Cao, M. Zan, F. Chen, X. Kou, Y. Liu, P. Wang, Q. Mei, Z. Hou, W.-F. Dong and L. Li, Carbon, 2022, 194, 42–51 CrossRef CAS.
- J. Liu, R. Li and B. Yang, ACS Cent. Sci., 2020, 6, 2179–2195 CrossRef CAS PubMed.
- Y. Wang, Y. Yang, X. Chang, R. Duan and Y. Zhang, J. Nanosci. Nanotechnol., 2021, 21, 1728–1734 CAS.
- L. Zhang, Y. Han, J. Zhu, Y. Zhai and S. Dong, Anal. Chem., 2015, 87, 2033–2036 CrossRef CAS PubMed.
- D. Reyes, M. Camacho, M. Camacho, M. Mayorga, D. Weathers, G. Salamo, Z. Wang and A. Neogi, Nanoscale Res. Lett., 2016, 11, 424 CrossRef PubMed.
- M. Javed, A. N. S. Saqib, R. Ata ur, B. Ali, M. Faizan, D. A. Anang, Z. Iqbal and S. M. Abbas, Electrochim. Acta, 2019, 297, 250–257 CrossRef CAS.
- Y. Bu, L. Yu, P. Su, L. Wang, Z. Sun, M. Sun, X. Wang, D. Huang and S. Wang, Anal. Bioanal. Chem., 2022, 414, 2651–2660 CrossRef CAS PubMed.
- P. Guo, W. Yang, H. Hu, Y. Wang and P. Li, Anal. Bioanal. Chem., 2019, 411, 2607–2617 CrossRef CAS PubMed.
- D.-Y. Li, X.-M. Zhang, Y.-J. Yan, X.-W. He, W.-Y. Li and Y.-K. Zhang, Biosens. Bioelectron., 2016, 79, 187–192 CrossRef CAS PubMed.
- X. Sun, Y. Liu, N. Niu and L. Chen, Anal. Bioanal. Chem., 2019, 411, 5519–5530 CrossRef CAS PubMed.
- U. Koesukwiwat, S. Jayanta and N. Leepipatpiboon, J. Chromatogr. A, 2007, 1140, 147–156 CrossRef CAS PubMed.
- H. Liu, L. Ding, L. Chen, Y. Chen, T. Zhou, H. Li, Y. Xu, L. Zhao and N. Huang, J. Ind. Eng. Chem., 2019, 69, 455–463 CrossRef CAS.
- M. Yan, B. Yu, D. Han, F. Li and N. Li, Biosens. Bioelectron., 2012, 38, 55–60 CrossRef PubMed.
- R. Atchudana, T. N. J. I. Edison, M. G. Sethuraman and Y. R. Lee, Appl. Surf. Sci., 2016, 384, 432–441 CrossRef.
- Z. Qiao, Y. Wang, Y. Gao, H. Li, T. Dai, Y. Liu and Q. Huo, Chem. Commun., 2010, 46, 8812–8814 RSC.
- C. L. Ye, Y. J. Qin, P. C. Huang, A. F. Chen and F. Y. Wu, Anal. Chim. Acta, 2018, 1034, 144–152 CrossRef CAS PubMed.
- S. Zhu, Q. Meng, L. Wang, J. Zhang, Y. Song, H. Jin, K. Zhang, H. Sun, H. Wang and B. Yang, Angew. Chem., Int. Ed., 2013, 52, 3953–3957 CrossRef CAS PubMed.
- Q. Du, P. Wu, F. Hu, G. Li, J. Shi and H. He, New J. Chem., 2019, 43, 7044–7050 RSC.
- T. W. Wu, Q. Xue, F. Liu, J. Zhang, C. S. Zhou, J. W. Cao and H. H. Chen, Chem. Eng. J., 2019, 366, 577–586 CrossRef CAS.
- A. A. Ensafi, P. Nasr-Esfahani and B. Rezaei, Sens. Actuators, B, 2018, 257, 889–896 CrossRef CAS.
- W. Thanasarakhan, S. Kruanetr, R. L. Deming, B. Liawruangrath, S. Wangkarn and S. Liawruangrath, Talanta, 2011, 84, 1401–1409 CrossRef CAS PubMed.
- G. Krepper, G. D. Pierini, M. F. Pistonesi and M. S. Di Nezio, Sens. Actuators, B, 2017, 241, 560–566 CrossRef CAS.
- M. Amjadi, J. L. Manzoori and F. Pakpoor, J. Anal. Chem., 2016, 71, 253–258 CrossRef CAS.
- D. B. Pistonesi, M. E. Centurión and V. Springer, J. Sci. Food Agric., 2021, 101, 5182–5189 CrossRef CAS PubMed.
- Y. Jin, J. Zhang, W. Zhao, W. Zhang, L. Wang, J. Zhou and Y. Li, Food Chem., 2017, 221, 1298–1307 CrossRef CAS PubMed.
- H. Saleh, M. Elhenawee, E. M. Hussien, N. Ahmed and A. E. Ibrahim, Food Anal. Methods, 2021, 14, 36–43 CrossRef.
- M. Amjadi and R. Jalili, Biosens. Bioelectron., 2017, 96, 121–126 CrossRef CAS PubMed.
- C. Liu, Z. Song, J. Pan, Y. Yan, Z. Cao, X. Wei, L. Gao, J. Wang, J. Dai, M. Meng and P. Yu, Talanta, 2014, 125, 14–23 CrossRef CAS PubMed.
- R. Jalili and M. Amjadi, Sens. Actuators, B, 2018, 255, 1072–1078 CrossRef CAS.
- C. Q. Zhou, X. X. He, D. M. Ya, J. Zhong and B. Y. Deng, Sens. Actuators, B, 2017, 249, 256–264 CrossRef CAS.
Footnote |
| † Electronic supplementary information (ESI) available. See https://doi.org/10.1039/d2ra03923k |
| This journal is © The Royal Society of Chemistry 2022 |

