 Open Access Article
Creative Commons Attribution 3.0 Unported Licence
Enhanced adsorptive removal of indigo carmine dye by bismuth oxide doped MgO based adsorbents from aqueous solution: equilibrium, kinetic and computational studies
Fatima A. Adam*a,
M. G. Ghoniema,
Moussa Diawarab,
Seyfeddine Rahali *c,
Babiker Y. Abdulkhaira,
M. R. Elamina,
Mohamed Ali Ben Aissa*c and
Mahamadou Seydou
 d
d
aDepartment of Chemistry, College of Science, Imam Mohammad Ibn Saud Islamic University (IMSIU), Riyadh 11432, Saudi Arabia. E-mail: Famohamedali@imamu.edu.sa
bLaboratoire de Centre de Calcul de Modélisation et de Simulation (CCMS), DER de Physique de La Faculté des Sciences et Techniques (FST), Université des Sciences des Techniques et des Technologies de Bamako (USTTB-Mali), Bamako, Mali
cDepartment of Chemistry, College of Science and Arts, Qassim University, Ar Rass, Saudi Arabia. E-mail: saif.rahali@gmail.com; dalibenissa@gmail.com
dUniversité de Paris, ITODYS, CNRS, UMR 7086, 15 Rue J-A de Baïf, 75013, Paris, France
First published on 31st August 2022
Abstract
Novel doped MgO nanoadsorbents were effectively fabricated at various Bi2O3 doping concentrations (0, 2.5, 5 and 10%). DFT-D3 study showed that the doping is done by substitution of two magnesium atoms by two bismuth atoms with the creation of a vacancy of one Mg atom. TEM, SEM, EDX, BET, XRD, and FTIR were used to characterize the obtained nanostructures. The removal of indigo carmine (IC) dyes from wastewater by doped MgO nanoparticles is investigated. Experimental parameters such as the initial dye concentration, contact time, Bi2O3 doping concentration, and pH were optimized to enhance the adsorption capacity. Bi2O3 doped MgO prepared at 5% (MgOBi2) is the best adsorbent with a maximum IC adsorption capacity of 126 mg g−1 at a solution pH equal to 7.00 and contact time of 74 min. The results indicated that the adsorption process followed pseudo-second-order (PSO) reaction kinetics, and the Freundlich isotherm model gave a better goodness-of-fit than the linear Langmuir model. The FTIR study established that IC molecules are successfully adsorbed onto the surface of MgOBi2 via a chemisorption process.
1. Introduction
Dyes and other organic pollutants have a tremendous effect on water resources and the total environment. Discharging of different organic pollutants such as pesticides, pharmaceuticals, oils, detergents, hydrocarbons, plastic, and dyes1 can negatively impact the quality of air, soil, and natural water resources through illegal discharge of industrial and domestic effluents. Nondegradable organic materials can disturb the food chain of the aquatic flora and fauna resulting in the death of fishes, algae, and other aquatic organisms leading to ecosystem collapse.2 The global annual production of natural and industrial dyes is about one million tons mainly consumed in textile, plastics, food, and other industries as coloring materials. Dyes can be toxic and carcinogenic in addition to their coloring properties.3 Color sustainability is one of the most desired characteristics of different industrial products such as textiles, leather, and plastics, hence the coloring materials, mainly dyes, should be stable compounds and nondegradable.4 This is a contradicted objective between the industrial sector and the environmental concerns bearing in mind that even a concentration of 1.0 ppm of dyes in the water can heavily impact its characteristics.5Indigo carmine, acid blue, is an organic compound with a chemical name, 5,5′-indigodisulfonic acid sodium salt (C16H8N2Na2O8S2, 466.36 g mol−1),5 with two sulphonated groups and four aromatic rings.6 It is utilized as dyeing material for many purposes including textile coloring, cosmetics, printing, biological staining, dermatological and antibacterial agent, and as an additive to poultry feed.7 It is considered as a potent toxic to mammalian cells, irritant, recalcitrant in addition to a high coloring capacity for aqueous solutions.8–10
Protection of the environment from the devastating impacts of dyes and other pollutants is a great challenge facing humanity recently. Many water treatment methodologies are adopted worldwide to enhance the quality of natural water resources and to treat the liquid effluent emerging from different sectors. Photodegradation, electrocoagulation, electrochemical, flocculation–coagulation, ultra-filtration, and adsorption are among the most used techniques.11–15 Based on efficiency, scalability, low operation cost, simplicity, adsorption can be considered as the most preferred method for water treatment among all other techniques. The nature and amount of pollutants are the most essential factors for selecting the treatment method.4 Activated carbon is a widely used adsorbent in addition to different types of clays. Recently, many special sorbents were practiced including metal oxides and their composites. Availability and relative safety of magnesium and bismuth metals in addition to other properties, nominate them as potential candidates for wastewater treatment through adsorption and photocatalytic actions.16,17 Metal oxides nanomaterials with layered double hydroxides and hierarchical nanostructures exhibit excellent adsorption capabilities for heavy metals removal due to their high surface area. Magnesium oxide and its nanoparticles can be prepared through different routes, including chemical, physical and biological methods.18 Many researchers investigated magnesium oxide nanoparticles and their composites to explore their capacities in removing various water pollutants. Feng et al. prepared aluminum and magnesium oxide nanoparticle composite through a one-step microwave assisted-solvothermal method to remove arsenic and lead ions from water successfully.19 Biosynthesized magnesium oxide was used to treat chromium successfully and reduce other pollutants in a tannery effluent.20 Jamil et al. synthesized magnesium oxide nanoparticles with a size of 19 nm for Reactive Orange 122 and removal of Reactive Black 5 from water, they attained maximum adsorption capacities, qmax, of 333.34 and 500 mg g−1 respectively.21 Ramesh et al. studied the interaction nature of the adsorption of indigo carmine on magnesium oxide, they found that the interaction followed Langmuir and Harkin–Jura isotherms at pH 7, confirming the occurrence of mono and multilayer adsorption simultaneously.5 Naga et al. used waste red mud from the alumina industry to remove indigo carmine from aqueous solutions, the maximum adsorption capacity was found to be 62 mg g−1, the adsorption mechanism followed the Langmuir model with mono-layer adsorption and endothermic and spontaneous.8 Many magnesium oxides nanomaterials were fabricated to enhance and add new properties to the adsorbent. Induni et al. prepared a composite made of magnesium oxide and granular activated carbon to adsorb hydrogen sulphide gas, H2S, the adsorption efficiency of the magnesium composite increased five times that of the granulated activated carbon alone.22 Magnesium bismuth oxides composites with silver iodide were prepared by Dai et al., as a photocatalytic active agent to remove some dyes from water, the composite showed a performance of 92.3–99.5% degradation within 10 min under visible light irradiation.23 The use of density functional theory has become increasingly common among chemists, providing them with a useful tool to study the mechanism of interaction between two chemical species24,25 in particular the adsorption of molecules on the surface of a solid,26–29 thus the rationalization of the doping mechanism of some metal oxides.30–32
The current study aims to fabricate magnesium bismuth oxide nanoparticles in different proportions and explore their removal capacities as environmentally safe sorbent for removing indigo carmine hazardous dye. The removal parameters will be optimized, and the kinetics and thermodynamic behavior will be investigated. To rationalize the MgO doping mechanism by substitution between Mg2+ and Bi3+, ab initio calculations based on the Density Functional Theory (DFT) as implemented in the Vienna Ab initio Simulation Package (VASP) were used.
2. Materials and methods
2.1. Chemicals
Bismuth(III) nitrate pentahydrate, magnesium nitrate hexahydrate, nitric acid (65%), ethanol (absolute), sodium hydroxide, sodium chloride, hydrochloric acid, and ammonium hydroxide were supplied commercially from Merck company and utilized without additional purification process. The IC concentrations (10 to 100 ppm) were obtained by diluting the IC stock solution (200 ppm).2.2. Nanoparticles synthesis
The co-precipitation method was utilized to synthesize Bi2O3 doping MgO nanoparticles. To fabricate 2.5% by weight of Bi2O3–MgO nanoparticles, 0.534 g of Bi(NO3)2·5H2O and 64.0 g of Mg(NO3)2·6H2O were added to 20 mL of nitric acid solution (1.12 M). After stirring for 15 min, NH4OH solution (33%) was added to the mixture until pH value 11 was reached. The solution was stirred for six hours at room temperature. Then, the mixture was filtered and washed with distilled water and absolute ethanol several times. The obtained powder was dried in an oven at 80 °C for 2.0 h and calcined at 450 °C for two hours.33 The other percentages by weight (0, 5, and 10%) were prepared similarly. The as-fabricated Bi2O3 doped MgO nanoparticles with different proportions of Bi2O3 (0, 2.5, 5, and 10%) were symbolized as MgOBi0, MgOBi1, MgOBi2, and MgOBi3, respectively.2.3. Characterization of the nano-adsorbents
The morphology of the as-fabricated nanopowders was analyzed by field emission scanning electron microscopy (JEOL JEM-6700F apparatus) and transmission electron microscope (Tecnai G20-USA). X-ray diffraction (XRD) was used to determine the structural properties using a Rigaku Mini Flex 600 (Tokyo, Japan) diffractometer equipped with a CuK radiation source (λ = 1.5417). The Brunauer, Emmett and Teller (BET) formula, as well as Lippens and de Boer's t-plot approach, were used to determine the surface area and porosity of nanopowders. The vibration modes of pure and Bi2O3 doped MgO nanoparticles before and after IC dye adsorption were determined using a JASCO FT-IR spectrometer.2.4. Adsorption study
Batch removal studies were carried out in 50 mL screw-top bottles containing 25 mL IC dye solutions to elucidate the influence of the operational parameters, including the pH solution (2–11), initial IC dye concentration (10–100 ppm), and contact time (2–210 min). The mixture was stirred at 400 rpm for 3.0 h. Following each experiment, the mixture was centrifuged, and the residual concentrations of IC dye were determined using a LABOMED: UVS-2800 spectrophotometer at a maximum wavelength of 610 nm.The equilibrium quantity of IC dye adsorbed per unit mass of Bi2O3 doped MgO nanoparticles was measured applying eqn (1):34
 | (1) |
The kinetic experiment's volume and initial concentration of dyes were 250 mL and 20 ppm, respectively. The Bi2O3 doped MgO nanoparticles mass was 50 mg. 5 mL of the suspension was removed and centrifuged at specific time intervals to determine the residual IC dye concentration. A related equation was utilized to calculate at time t the quantity sorbed qt (mg g−1):
 | (2) |
2.5. Computational methodology
The Vienna Ab initio Simulations Package35 was used to optimize the structures of MgO, and Bi2O3 doped MgO isolated and adsorbed to determine their adsorption energies. Periodic structures were built using Model View software. The slab model (200) was used with a vacuum size of 30 Å along the z-axis. The generalized gradient approximation (GGA) method with the Perdew–Burke–Ernzerhof of (PBE) functional36 was used to solve the Kohn–Sham equations. The projector augmented-wave method (PAW) was used to describe electron–ion interactions. The convergence of the plane-wave expansion was obtained with a cutoff of 500 eV. Sampling in the Brillouin zone was performed on a grid of (331) k-points for the geometry optimizations. The dispersion contribution was added using the DFT-D3 approach proposed by Grimme et al.373. Results and discussion
3.1. Nanomaterials characterizations
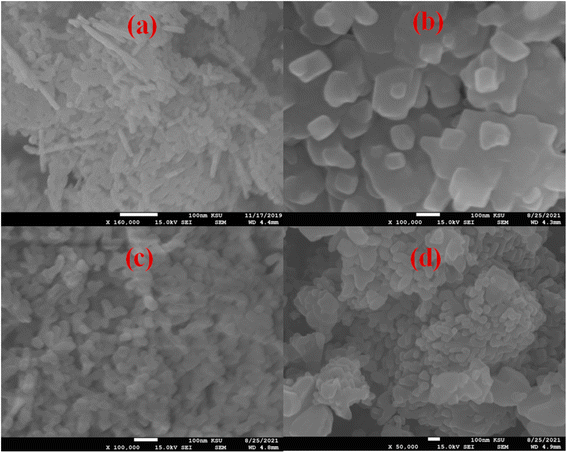
To highlight the morphological and structural properties of the synthesized nanomaterials, SEM and TEM micrographs of the produced nanomaterials are realized. Fig. 1a–d shows the micrographs obtained from the SEM investigation of pure MgO (MgOBi0) and Bi203 doped MgO (MgOBi1, MgOBi2, and MgOBi3). As illustrated in Fig. 1a, the rod-like structure was found in the SEM image of MgOBi0. The sheet structure was observed in the SEM images of doped MgO, as displayed in Fig. 1b–d.Additionally, the TEM was used to study the shape of Bi2O3 doped MgO. TEM micrographs of doped MgO were shown in Fig. 2a–c. The small-sized nanoparticles were observed with a length of about 100 nm. The TEM images for the three nanocomposites may be lookalike, which can be attributed to the slight similarity in their detailed morphology due to the domination of MgO. Elemental mapping analysis of MgOBi3 shown in Fig. 2e–g reveals that Bi2O3 doped MgO possesses all elements. i.e., Mg, Bi, and O elements.
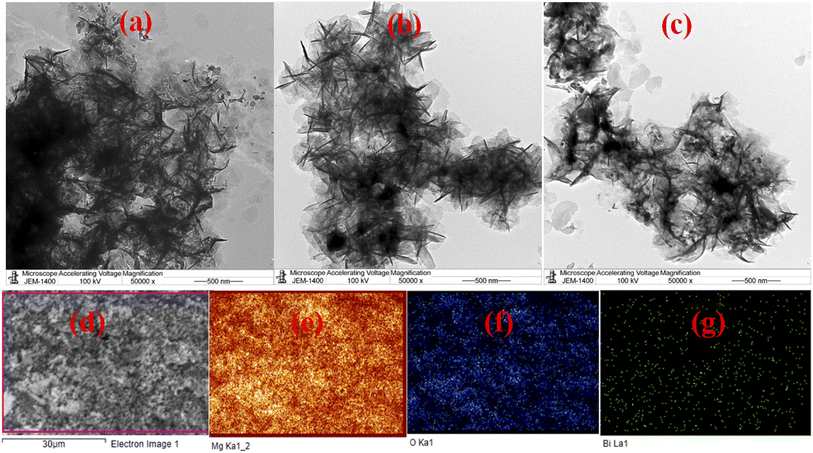 | ||
| Fig. 2 TEM images of (a) MgOBi1, (b) MgOBi2, and (c) MgOBi3, and. X-ray elemental mapping of (e) Mg−Ka, (f) O−Ka, and (g) Bi–La of the SEM MgOBi3 selected area (d). | ||
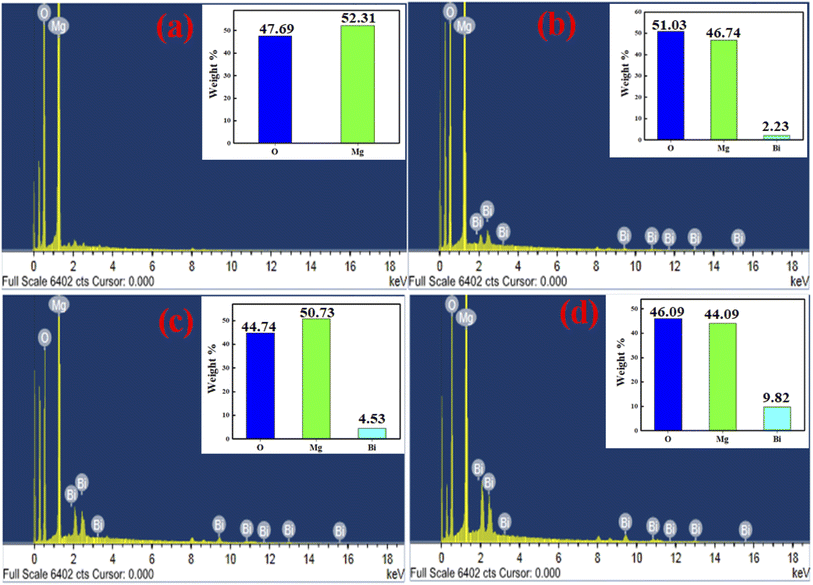
The EDX spectrums of pure MgO and Bi2O3 doped MgO nanoparticles are shown in Fig. 3a–d, where the spectrums confirm the presence of Mg, O, and Bi peaks in the absence of any other ingredient. Additionally, Fig. 3a and b shows the surface percentage compositions of Bi2O3 loaded on MgO. The weight percentages of all the elements (Mg, Bi, and O) in MgOBi0 (Fig. 3a), MgOBi1 (Fig. 3b), MgOBi2 (Fig. 3c), and MgOBi3 (Fig. 3d) are verified by EDS spectral peaks of these samples.
The BET isotherms for the developed nanomaterials with their pore size distributions are shown in Fig. 4. The N2 sorption isotherms are classified as Langmuir type IV by the IUPAC,38 which denotes the presence of mesoporous nanostructures.38,39 The BET isotherms of MgOBi0 and MgOBi1 showed some similarities attributed to minor doping amount and the domination of MgO properties; conversely, the increase of Bi2O3 in MgOBi2 and MgOBi3 showed noticeable alteration. The variation of pore size distribution illustrated in Fig. 4c and d indicated a different conformation take place as the Bi2O3 increased which is inline with the SEM findings. As demonstrated in Table 1, the pure MgO nanoparticles have a BET surface area of only 5.307 m2 g−1. Adding Bi2O3 to MgO changed the SBET to 8.61, 12.215, and 5.160 m2 g−1, respectively, for MgOBi1, MgOBi2, and MgOBi3. Additionally, the pore volume and diameter varied between 0.029 and 0.082 cm3 g−1 and 1.7 and 1.8 nm, respectively. The obtained surface area and pore volume values nominated the MgOBi2 to possess the best adsorption among the other nanocomposites. Based on the obtained data, it can be concluded that the addition of Bi2O3 to MgO affects the pore size distribution and surface area.
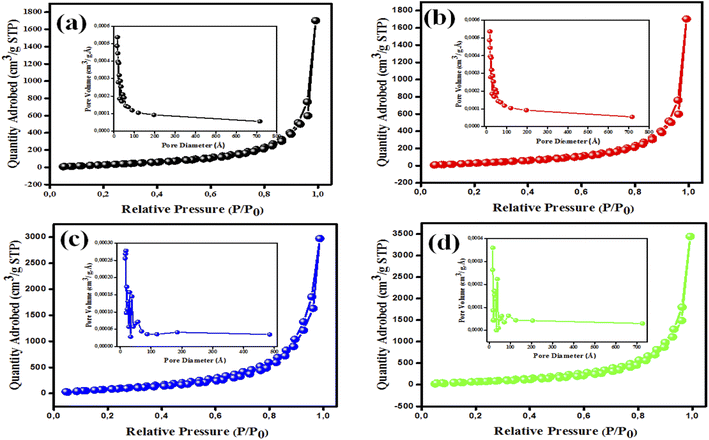 | ||
| Fig. 4 BET isotherms with pore size distribution (inset) of (a) MgOBi0, (b) MgOBi1, (c) MgOBi2, and (d) MgOBi3. | ||
| Nanomaterials | Pore volume (cm3 g−1) | BET surface area (m2 g−1) | Pore radius (Å) |
|---|---|---|---|
| MgOBi0 | 0.029 | 5.307 | 18.411 |
| MgOBi1 | 0.041 | 8.691 | 17.12 |
| MgOBi2 | 0.082 | 12.215 | 17.108 |
| MgOBi3 | 0.029 | 5.160 | 18.401 |
To examine the effect of Bi2O3 doping on the structural properties of the MgO phase, XRD of pure and doped MgO samples were performed. The results of MgO loaded with various Bi2O3 ratios are given in Fig. 5. Spotted peaks at 2θ° = 78.8°, 74.7°, 62.5°, 43.10°, and 37° were in accord with (222), (311), (220), (200), and (111) and planes demonstrating that MgO had cubic structure agreeing with (JCPDS 75-1525).40 Upon doping, the diffraction peaks were locomoted toward lower angles. For example, the principal peak (200) shifts by 0.30, 0.34, and 0.36° for MgOBi1, MgOBi2, and MgOBi3, respectively (Fig. 5b). This change for doped MgO can be related to the substitution of Mg ions (ionic radius = 0.74 Å) by Bi ions (ionic radius = 1.61 Å). The observed shift could result from the structural stresses induced by the increased ionic radius and the alteration of the MgO lattice properties.41 To interpret the experimental results and rationalize the Bi2O3 doped MgO mechanism, a theoretical study based on DFT calculations will be developed in the next section.
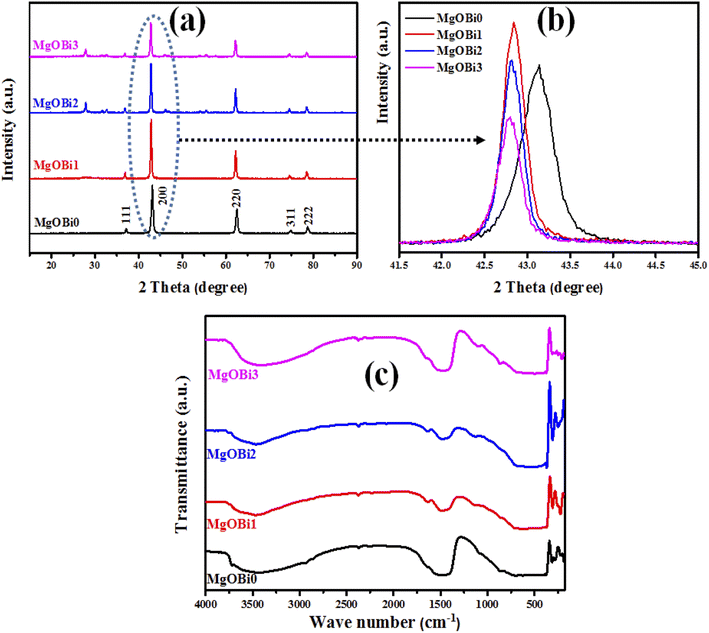 | ||
| Fig. 5 (a) XRD pattern, (b) principal XRD peak alterations, and (c) FTIR spectra for MgOBi0, MgOBi1, MgOBi2, and MgOBi3. | ||
FTIR analysis has been undertaken to identify the chemical bonding and the purity of the manufactured compounds, see Fig. 5c. FTIR spectra showed broadband at 3465 cm−1 assigned to the OH stretching vibration,42 while the band at 1639 cm−1 is ascribed to the adsorbed water molecule's OH stretching mode.43 In addition, the characteristic band observed at 430 cm−1 is related to Mg–O vibration mode,44 demonstrating the formation of the MgO phase. Furthermore, the absorption bands in the FTIR spectra of doped MgO at 248 and 1108 cm−1 are associated with the vibrations of Bi–O bonds and the bending vibration of Bi![[double bond, length as m-dash]](https://www.rsc.org/images/entities/char_e001.gif) O, respectively.45,46
O, respectively.45,46
The average crystallite sizes of pure and Bi2O3 doped MgO nanoparticles were obtained from the full width at half maximum (FWHM) of the higher intensity peaks using Scherrer's formula (eqn (3)):47
 | (3) |
| Nanomaterials | FWHM (rad) | Crystallite size (nm) | ||
|---|---|---|---|---|
| [200] | [220] | [222] | ||
| MgOBi0 | 0.00847 | 0.00924 | 0.01019 | 193.11 |
| MgOBi1 | 0.0056 | 0.00666 | 0.00784 | 292.07 |
| MgOBi2 | 0.00533 | 0.0064 | 0.00738 | 306.84 |
| MgOBi3 | 0.00585 | 0.00678 | 0.00801 | 279.16 |
3.2. IC dye adsorption investigation
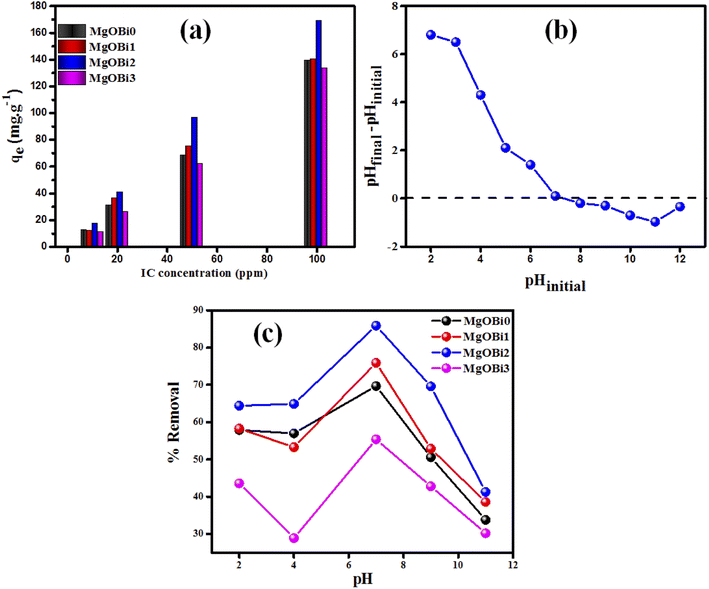 | ||
| Fig. 6 (a) Effect of initial IC concentration on the sorption by Bi2O3 doped MgO, (b) plot for the determination of pHpzc for MgOBi2, (c) influence of pH on removal% of IC. | ||
The surface area available for adsorption significantly affects the adsorption dyes process. To define the most effective nanomaterial for IC adsorption, doped MgO with varying Bi2O3 concentrations were examined as adsorbents for IC removal from solution. As shown in Fig. 6a, the amount of IC adsorbed increases as the Bi2O3 doping rate increases up to 5 percent and subsequently falls. The amount of Bi2O3 doped achieves saturation when the Bi2O3 level is 5 percent. MgOBi2 was found to have a maximum IC adsorption capacity due to its wide surface area, as shown in Table 1.
3.3. Contact time and kinetic studies
The effect of equilibrium time for the IC adsorption onto utilized nanoparticles (MgOBi0, MgOBi1, MgOBi2, and MgOBi3) has been studied for a fixed IC starting concentration of 20 ppm during an agitation period of 2 and 210 min, see Fig. 10a. The IC removal is accelerated with the contact time and reaches the equilibrium within 60, 62, 74, and 66 min for MgOBi0, MgOBi1, MgOBi2, and MgOBi3, respectively. The adsorption rates increase significantly during the first few min of the process for all employed nanoparticles due to the accessibility of many active sites available on nanoparticles' surfaces. Finally, the concentration of the active sites declines upon reaching the equilibrium resulting in a lower sorption rate. Consequently, the IC molecules' removal remains almost unchanged.A kinetic study for the IC removal by fabricated nanoparticles has been carried out for a sorbent dose of 200 mg L−1 and [IC]0 = 20 ppm, while varying the contact time from 2 to 210 min. The relevant equations and the obtained results (kinetics parameters and the correlation coefficient R2) are given in Table 3. The linear pseudo-first-order (PFO), linear pseudo-second-order (PSO) and intra-particle diffusion models were used to assess the experimental data for IC dye adsorption onto doped and undoped MgO. PFO model is depicted in Fig. 7b. The slope of the plot between ln(qe − qt) and adsorption time was used to calculate the kinetic parameters. The estimated qe values significantly diverge from the experimental qe values (Table 3) because the linear correlation coefficient R2 values for these plots are low. Fig. 7c illustrates a linear fitting of adsorption data using a PSO kinetic model. The excellent linear fit of (t/qt) vs. adsorption time with an R2 of 0.982–0.994 (Table 3) for various doped Bi2O3 concentrations indicated that the adsorption of IC dye onto the produced nanomaterials followed a PSO model. The good agreement between the observed and estimated qe values further demonstrated that the PSO adsorption model fits the adsorption kinetics well.
| Kinetics model | Kinetic equation | Parameter | MgOBi0 | MgOBi1 | MgOBi2 | MgOBi3 |
|---|---|---|---|---|---|---|
| PFO57 | ln(qe − qt) = ln![[thin space (1/6-em)]](https://www.rsc.org/images/entities/char_2009.gif) qe − k1t qe − k1t |
qe (mg g−1) | 49.02 | 63.79 | 100.43 | 44.05 |
| K1 (min−1) | 0.20 | 0.22 | 0.23 | 0.19 | ||
| R2 | 0.97 | 0.96 | 0.96 | 0.98 | ||
| PSO57 |  |
qm (exp) (mg g−1) | 64.50 | 68.80 | 101.71 | 59.80 |
| qm (cal) (mg g−1) | 70.07 | 76.04 | 110.74 | 67.70 | ||
| K2 (g mg−1 min−1) × 104 | 7.17 | 5.17 | 3.04 | 4.81 | ||
| h0 (mg g−1 min−1) | 3.52 | 2.98 | 3.72 | 2.19 | ||
| t1/2 (min) | 19.72 | 25.43 | 29.70 | 30.70 | ||
| R2 | 0.99 | 0.99 | 0.99 | 0.99 | ||
| IPD58 | qt = kdift1/2 + C | Kdif1 (mg g−1 min1/2) | 6.22 | 6.60 | 7.86 | 5.15 |
| C1 | 4.15 | 1.04 | 5.78 | 1.64 | ||
| R2 | 0.98 | 0.99 | 0.99 | 0.98 | ||
| Kdif2 (mg g−1 min1/2) | 1.69 | 2.55 | 2.50 | 1.87 | ||
| C2 | 40.70 | 33.12 | 62.57 | 33.17 | ||
| R2 | 0.96 | 0.96 | 0.92 | 0.97 |
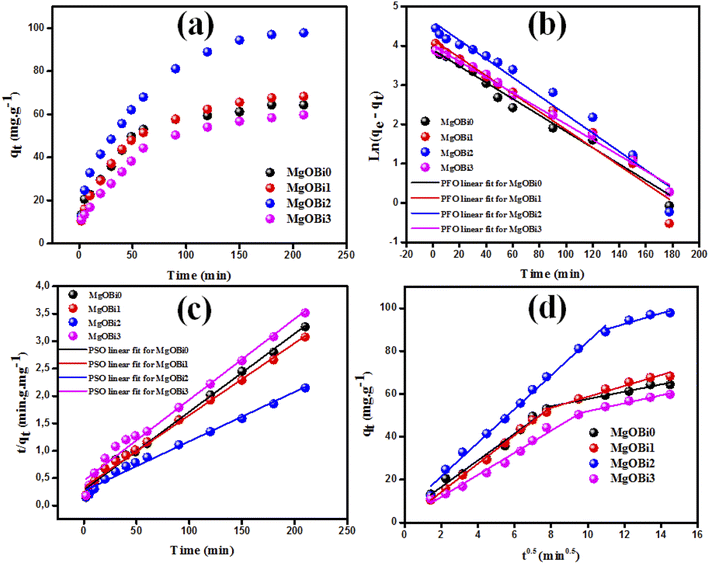 | ||
| Fig. 7 (a) Contact time, (b) PFO, and (c) PSO for IC adsorption onto employed nanoparticles and (d) intra-particle diffusion plots for IC sorption. | ||
The dyes molecules may be transferred from the solution bulk to the nanoparticles solid phase by the intra-particle diffusion/transport mechanism.52,53 Intra-particular diffusion is a restricting step in the adsorption mechanism. The possibility of intra-particular diffusion is established using the Weber and Morris diffusion pattern.52,53 The higher regression coefficients (Table 3) exhibit the efficacy of the intra-particle mode of diffusion for all tested nanomaterials. As shown in Fig. 7d, the adsorption process occurs upon two distinct stages for all tested nanomaterials.54,55 The first stage represents the transport of IC molecules from the bulk solution through the boundary layer to the surface of nanomaterials,56 whereas the second stage represents the equilibrium condition in which intra-particle diffusion becomes stalled due to a low IC concentration.56
3.4. Adsorption equilibrium study
Adsorption isotherms are typically used to characterize the interaction between the adsorbent and adsorbate at equilibrium. The Freundlich and Langmuir isotherms are compared to the experimental data for IC dye adsorption on the obtained nanomaterials. The Langmuir isotherm model implies that the adsorbate covers the adsorbent surface in a monolayer and that adsorption happens uniformly.59,60 The Freundlich isotherm model relies on adsorption over a heterogeneous surface with varying adsorption energy and is referred to a multilayer adsorption.61 The formulas of the applied isotherms models and the computed parameters are displayed in Table 4. The findings of IC dye adsorption are shown in Fig. 8 and Table 4.| Equilibrium model | Linear form | Nanomaterials | Parameters | Values |
|---|---|---|---|---|
| Langmuir62 |  |
MgOBi0 | qm (mg g−1) | 126.00 |
| KL (mg g−1) | 0.19 | |||
| RL (L mg−1) | 0.05 | |||
| R2 | 0.96 | |||
| MgOBi1 | qm (mg g−1) | 66.22 | ||
| KL (mg g−1) | 0.17 | |||
| RL (L mg−1) | 0.06 | |||
| R2 | 0.94 | |||
| MgOBi2 | qm (mg g−1) | 276.00 | ||
| KL (mg g−1) | 0.12 | |||
| RL (L mg−1) | 0.07 | |||
| R2 | 0.96 | |||
| MgOBi3 | qm (mg g−1) | 66.22 | ||
| KL (mg g−1) | 0.15 | |||
| RL (L mg−1) | 0.06 | |||
| R2 | 0.95 | |||
| Freundlich63 |  |
MgOBi0 | n | 1.10 |
| KF (L mg−1) | 21.46 | |||
| R2 | 0.99 | |||
| MgOBi1 | n | 1.33 | ||
| KF (L mg−1) | 24.17 | |||
| R2 | 0.99 | |||
| MgOBi2 | n | 1.19 | ||
| KF (L mg−1) | 27.93 | |||
| R2 | 0.99 | |||
| MgOBi3 | n | 1.05 | ||
| KF (L mg−1) | 10.76 | |||
| R2 | 0.99 |
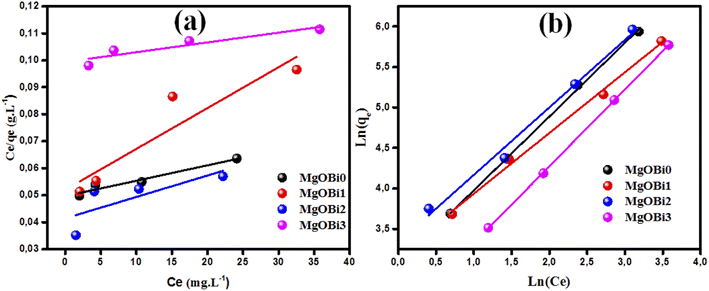 | ||
| Fig. 8 Assessment of isotherm models for IC dye adsorption onto Bi2O3 doped MgO nanomaterials: (a) Langmuir, (b) Freundlich. | ||
The linear regression coefficient R2 obtained from the Freundlich isotherm model for all used nanomaterials is greater than that obtained from the Langmuir model, indicating that the Freundlich isotherm model fits the experimental data very well. The n value determines the type of isotherm; for example, if 1/n equals zero, 0 < 1/n < 1, or 1/n > 1, the isotherm is unfavorable, favorable, or irreversible, respectively.61 The present investigated data n values are 1.10, 1.33, 1.19, and 1.05 for MgOBi0, MgOBi1, MgOBi2, and MgOBi3, respectively, indicating that the adsorption is favorable.
The maximum adsorption capacities of several adsorbents reported for the IC elimination are presented in Table 5. As shown, the currently described MgBiO2 nanosorbent possesses the remarkable adsorption capacity to remove IC dye from wastewaters, demonstrating its potential utility.
| Adsorbents | Synthesis methods | Surface area (m2 g−1) | Adsorption capacity (mg g−1) | Ref. |
|---|---|---|---|---|
| MgFe2O4 | Sol–gel | 28.8 | 46 | 64 |
| Activated carbon | Commercial | 1250.3 | 79.49 | 65 |
| Mesoporous Mg/Fe | Sol–gel | 85.6 | 62.8 | 66 |
| Carbon nanotube | Chemical vapor deposition | 74.2 | 88.5 | 67 |
| COOH–CNT | Chemical vapor deposition | 145.9 | 136 | 67 |
| Silver nanoparticle | Green reduction | — | 73.05 | 68 |
| Fe3O4 nanoparticles | Bio-synthesis | 78.61 | 99.71 | 69 |
| Cobalt hydroxide nanoparticles | Co-precipitation | — | 62.5 | 70 |
| MgOBi2 | Co-precipitation | 12.2 | 126 | Current work |
3.5. Thermodynamics studies
Fig. 9 illustrates that raising the solution temperature from 20 °C to 50 °C substantially increased the adsorbed amount of IC on MgOBi0, MgOBi1, MgOBi2, and MgOBi3. A possible explanation could be creating additional adsorption sites through the disintegration of nanoparticles at high temperatures and/or the acceleration of diffusion-controlled mechanisms that control adsorption.71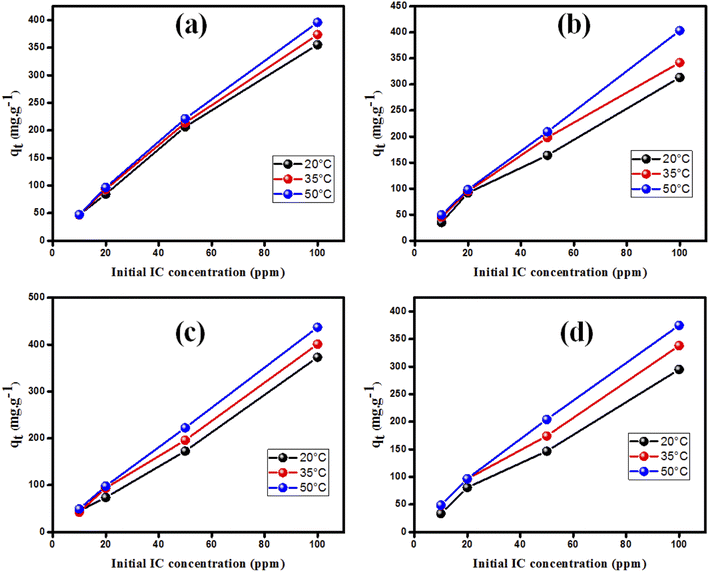 | ||
| Fig. 9 The temperature impact on the adsorption of IC using different IC concentrations on (a) MgOBi0, (b) MgOBi1, (c) MgOBi2, and (d) MgOBi3. | ||
The equilibrium constant Kc was obtained from the pollutant concentration on sorbent and solution at equilibrium (Cad and Ce in mg L−1). The enthalpy (kJ mol−1, ΔH°) and entropy (kJ mol−1, ΔS°) values were extracted from plotting (ln![[thin space (1/6-em)]](https://www.rsc.org/images/entities/char_2009.gif) Kc) versus temperature reciprocal (T−1) according to eqn (4), and the obtaining were applied in eqn (5) to compute the free energy (kJ mol−1, ΔG°) (Table 6).
Kc) versus temperature reciprocal (T−1) according to eqn (4), and the obtaining were applied in eqn (5) to compute the free energy (kJ mol−1, ΔG°) (Table 6).
 | (4) |
| ΔG° = ΔH° − TΔS° | (5) |
| Fed conc. (mg L−1) | ΔH° (kJ mol−1) | ΔS° (kJ mol−1) | ΔG° (kJ mol−1) 293 K | ΔG° (kJ mol−1) 308 K | ΔG° (kJ mol−1) 323 K |
|---|---|---|---|---|---|
| MgOBi0 | |||||
| 10 | 9.827 | 0.055 | −6.537 | −7.086 | −7.635 |
| 20 | 60.178 | 0.248 | −13.769 | −16.251 | −18.732 |
| 50 | 19.124 | 0.077 | −3.832 | −4.602 | −5.372 |
| 100 | 17.065 | 0.065 | −2.198 | −2.844 | −3.491 |
![[thin space (1/6-em)]](https://www.rsc.org/images/entities/char_2009.gif) |
|||||
| MgOBi1 | |||||
| 10 | 161.792 | 0.548 | −1.586 | −7.068 | −12.551 |
| 20 | 55.449 | 0.237 | −15.145 | −17.514 | −19.883 |
| 50 | 39.058 | 0.137 | −1.743 | −3.112 | −4.481 |
| 100 | 35.703 | 0.124 | −1.112 | −2.348 | −3.583 |
![[thin space (1/6-em)]](https://www.rsc.org/images/entities/char_2009.gif) |
|||||
| MgOBi2 | |||||
| 10 | 81.818 | 0.288 | −4.140 | −7.025 | −9.909 |
| 20 | 101.992 | 0.384 | −12.518 | −16.361 | −20.204 |
| 50 | 50.377 | 0.175 | −1.851 | −3.603 | −5.356 |
| 100 | 33.710 | 0.122 | −2.568 | −3.786 | −5.003 |
![[thin space (1/6-em)]](https://www.rsc.org/images/entities/char_2009.gif) |
|||||
| MgOBi3 | |||||
| 10 | 125.227 | 0.429 | −2.738 | −7.033 | −11.327 |
| 20 | 71.800 | 0.287 | −13.795 | −16.667 | −19.540 |
| 50 | 45.175 | 0.154 | −0.777 | −2.319 | −3.861 |
| 100 | 28.923 | 0.100 | −0.894 | −1.894 | −2.895 |
The positive ΔH° values indicated that IC adsorption on MgOBi0, MgOBi1, MgOBi2, and MgOBi3 is endothermic. Furthermore, the negative ΔG° indicates the spontaneity of the IC adsorption on the four sorbents. The increase of negative ΔG° values proportionally with temperature showed that the sorption was favorable.
3.6. IC dye adsorption mechanism investigation
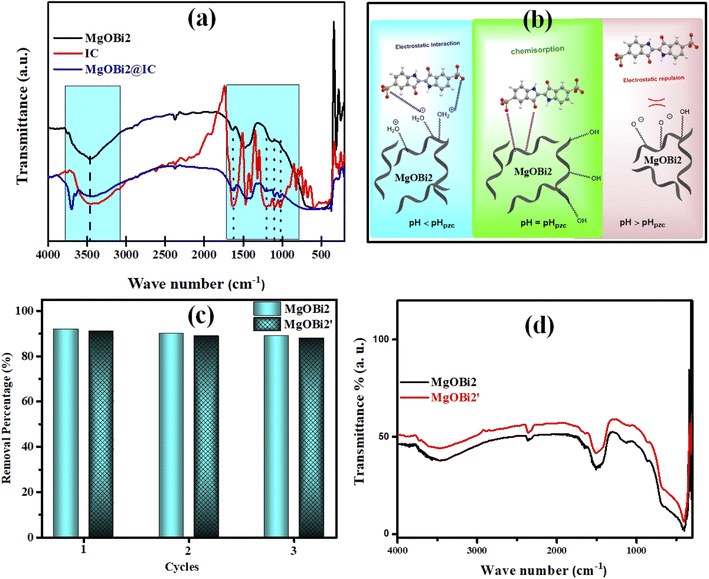
FTIR analysis was used to clarify the IC dye molecule adsorption mechanism onto MgOBi2 nanoparticles. The FTIR spectra of free IC dye molecules, MgOBi2 and MgOBi2@IC are shown in Fig. 10a, and the important FTIR bands are included in Table 7.| Important bands | IC (cm−1) | MgOBi2@IC (cm−1) |
|---|---|---|
| N–H stretching | 3416 | 3415 |
C![[double bond, length as m-dash]](https://www.rsc.org/images/entities/char_e001.gif) O stretching O stretching |
1636 | 1636 |
C![[double bond, length as m-dash]](https://www.rsc.org/images/entities/char_e001.gif) C stretching C stretching |
1469 | 1421 |
| C–N bonding | 1362 | 1360 |
| SO3− stretching | 1161, 1098 and 1032 | 1153, 1096 and 1024 |
As shown in Table 7 and Fig. 10a, the IC characteristic bands appear in the spectrum of MgOBi2@IC and slightly shift toward a lower wavenumber than in the spectrum of free IC. For example, the SO3− stretching bands slightly shift after IC adsorption, owing to the creation of bonds between the oxygen atoms in IC molecules and MgOBi2 nanoparticles. This study established that IC molecules are successfully adsorbed onto the surface of MgOBi2 via chemisorption. Fig. 10b depicts the plausible sorption mechanism of IC molecules onto MgOBi2.
3.7. Reusability, regeneration and stability studies
The regeneration of the adsorbent is a critical parameter, and its reusability is a necessary economic factor. Then, it is vital to confirm the cyclic availability of MgOBi2. Following the sorption experience, the utilized MgOBi2 nanoparticle was filtered and then calcinated for one hour at 776 K. After that, the recovered MgOBi2 was repurposed. The reusability performance is depicted in Fig. 10c. It was verified that MgOBi2 has effectually involved at least three continual cycles for the IC dye elimination. Furthermore, the long-term stability of the MgOBi2 nanosorbent was investigated after three months. As shown in Fig. 10c, the minor loss in the adsorption capacity for used MgOBi2 after three months (MgOBi2′) can be due to the loss of some adsorbent binding sites and not the structural degradation of nanosorbent. The stability of the MgOBi2 nanosorbent has been checked by FTIR (Fig. 10d). The results demonstrate that the FTIR spectrum of recuperating MgOBi2′ remain unchanged after three months suggesting the structural stability of MgOBi2.3.8. Computational investigation of MgO doping mechanism
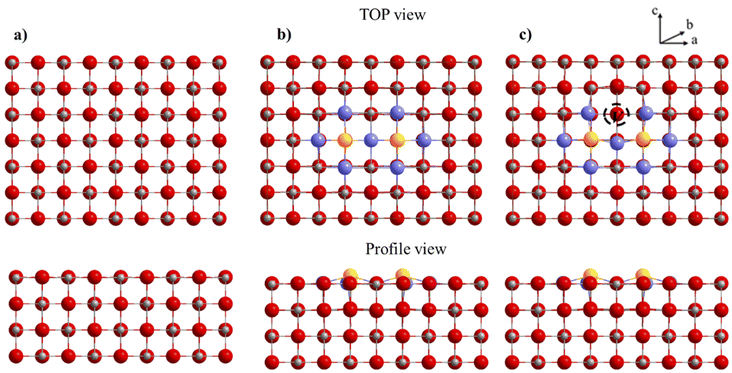
To evaluate the effect of dopants on the surface, we retained the surface [200], which is the most stable and one of the most studied for molecules activation. We considered different models of magnesium oxide to study the effect of bismuth(III) oxide dopants on the structural, energetic and electronic properties of the surface [200]. Compliance with electro neutrality requires the presence of two trivalent dopants for a magnesium vacancy. For this model, a supercell (4 × 3 × 1) is used. Two dopants have been substituted for two Mg on the same upper face of the surface with a magnesium vacancy created on this same face to compensate for the charge difference between Mg2+ and Bi3+. The thickness of the slab model for this surface supercell is four layers for a total of 192 atoms (96 Mg and 96 O atoms). The bottom three layers were fixed during the optimization (Fig. 11).The creation of magnesium vacancy leads to significant distortions in the oxygen network in this structure. The dopant atom has moved to coordinate five and forms a short Bi–O bond of length 2.16 Å. The Mg–O bonds are distributed in a range of 1.93 to 2.11 Å. The substitution energy is computed by using the following equation.
| Esub = EMgx−3OxBi2 + 3EMg − 2EBi − EMgxOx | (6) |
| Super cell (4 × 3 × 1) | Vacancy position (Mg2+) | ||
|---|---|---|---|
| First neighbor | Second neighbor | Third neighbor | |
| Esub (eV) | −2.096 | −1.367 | −0.884 |
The results reported in Table 8 indicate a negative substitution energies ranging from −2.096 eV to −0.884 for the first to the third neighbors vacancy respectively. This clearly shows that the substitution is a very favorable thermodynamic mechanism.
The oxygen nearest neighbors of the dopant cations Mg1, Mg2 and Mg3 have much smaller formation energies than those of the undoped MgO surface, indicating that magnesium vacancy formation is very favorable with dopants. The formation of a vacancy at the second neighbor also requires less energy than on the surface of pure magnesium oxide, although it is more expensive than the first neighbor. Therefore, the vacancy formation energy at the doped surface is lower than that at the pure surface, regardless of the location of the vacancy on the surface. The creation of an oxygen vacancy leads to a redistribution of electron densities in the system. In order to evaluate these redistributions, we calculated the Bader charges for three structures: bare surface, doped surface and doped surface with magnesium vacancy. Fig. 12 shows the atomic charges in the cell (4 × 3 × 1) with a substituted dopant.
The Bader charge calculations for the bismuth atoms in these configurations were carried out first without creating a vacancy and then with a vacancy. The obtained values are shown in Table 9.
| Bader charge | ||||||||
|---|---|---|---|---|---|---|---|---|
| O1 | O2 | O3 | O4 | O5 | Mg1 | Mg2 | Mg3 | |
| Without vac. | −1.78 | −1.64 | −1.64 | −1.58 | −1.77 | 1.88 | 1.88 | 1.90 |
| With vac. | −1.47 | −1.44 | −19.43 | −1.46 | −1.71 | — | 0.80 | 2.04 |
| Difference | 0.31 | 0.20 | 0.21 | 0.12 | 0.06 | — | 0.08 | −0.14 |
As expected, we observe that in the absence of Mg2+ vacancy, the oxygen and magnesium atoms near the dopant have an increased charge because the dopants can provide fewer electrons than Mg. After creating the vacancy, the charges on the atoms closest to the dopant return to normal values. The positive charges on the Mg and the dopant decrease with the creation of a vacancy because these ions are less solicited to supply electrons to the anions. To better understand the electronic interactions between the surface [200] of magnesium oxide and the dopant bismuth oxide, the PDOS of the surface atoms were calculated (see Fig. 13).
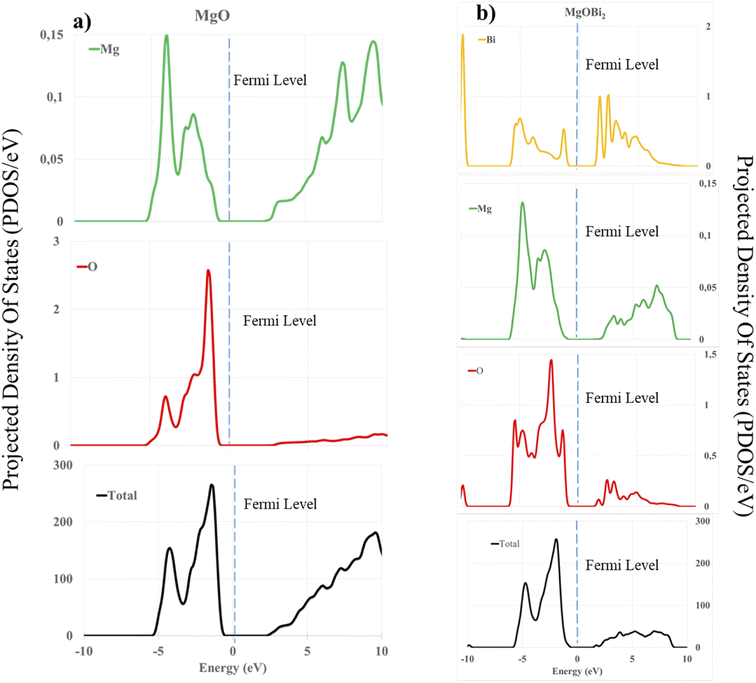 | ||
| Fig. 13 Calculated projected density of states (PDOS) of: (a) O 2sp, Mg 3sp, and total DOS for MgO; (b) O 2sp, Mg 3sp, and Bi 3d, 3f orbitals and total DOS for the doped surface (200). | ||
It is observed that the PDOS peaks are mainly composed of 2s, 2p and 3s orbitals for the oxygen atom and 3d and 3f orbitals for bismuth. In the case of the bare surface of MgO, we obtained an energy gap of 3.02 eV, which is comparable to the values obtained in the literature.72,73 The s and p orbitals of Mg and O shift to the left, indicating a drop in the energy level in the unoccupied band. Moreover, the peak intensities of the s and p orbitals of Mg appeared after the Fermi level in the valence band (Fig. 13a). This phenomenon justifies the fact that the orbitals concerned participate in the interaction and the lowering of the total energy leading to the stabilization of the surface. Also, a similar observation of lowering and shifting of the s and p orbital of O, Mg and 3d, 3f of Bi, justifies the dopant's participation in the formation of vacancy in the doped surface. According to Fig. 13b, we observe in the two bands (conductions and valences) peaks at the level of each atom, which leads to a decrease in gap energy to 2.15 eV.
4. Conclusion
Bi2O3 doped MgO nanosorbents with various doping concentrations (0, 2.5, 5, and 10%) were successfully prepared by the co-precipitation method. The doping mechanism of MgO by Bi2O3 is a substitution of three magnesium ions atoms by two bismuth ions, in agreement with XRD study and confirmed using DFT-D3 calculations. Batch experiments revealed that the removal of IC dye by doping MgO dependents to the initial dye concentration, Bi2O3 doping concentration, and pH values. Bi2O3 doped MgO prepared at 5% (MgOBi2) is the best adsorbent with a maximum IC adsorption capacity of 126 mg g−1 at solution pH equal to seven and contact time of 74 min. Equilibrium and kinetics modeling of the experimental data indicated that the sorption of IC by doped MgO followed the PSO kinetics and Freundlich adsorption isotherm models. The IC adsorption mechanism occurred through the chemisorption process based on FTIR measurements.Conflicts of interest
The author(s) declared no potential conflicts of interest with respect to the research, authorship, and/or publication of this article.Acknowledgements
Authors extend their appreciation to the Deanship of Scientific Research at Imam Mohammad Ibn Saud Islamic University for funding this work through Research Group no. RG-21-09-75.References
- M. Li, H. Wang, S. Wu, F. Li and P. Zhi, Adsorption of hazardous dyes indigo carmine and acid red on nanofiber membranes, RSC Adv., 2012, 2(3), 900–907 RSC.
- S. Hajati, M. Ghaedi, F. Karimi, B. Barazesh, R. Sahraei and A. Daneshfar, Competitive adsorption of Direct Yellow 12 and Reactive Orange 12 on ZnS: Mn nanoparticles loaded on activated carbon as novel adsorbent, J. Ind. Eng. Chem., 2014, 20(2), 564–571 CrossRef CAS.
- J.-W. Lee, S.-P. Choi, R. Thiruvenkatachari, W.-G. Shim and H. Moon, Evaluation of the performance of adsorption and coagulation processes for the maximum removal of reactive dyes, Dyes Pigm., 2006, 69(3), 196–203 CrossRef CAS.
- T. Naseem and T. Durrani, The role of some important metal oxide nanoparticles for wastewater and antibacterial applications: a review, Environ. Chem. Ecotoxicol., 2021, 3, 59–75 CrossRef CAS.
- T. N. Ramesh and V. P. Sreenivasa, Removal of indigo carmine dye from aqueous solution using magnesium hydroxide as an adsorbent, J. Mater., 2015, 33, 35 Search PubMed.
- I. Nielsen and A. B. Scharff, The use of cyclododecane for the fixation of bleeding dyes on paper and textiles: a critical evaluation of application methods, in Dyes in history and archaeology 19: papers presented at the 19th meeting, held at the Royal Museum, National Museums of Scotland, Edingburgh, 19–20, October 2000, Archetype Publications, 2003, pp. 149–154 Search PubMed.
- X. Zhang, G. Mao, Y. Jiao, Y. Shang and R. Han, Adsorption of anionic dye on magnesium hydroxide-coated pyrolytic bio-char and reuse by microwave irradiation, Int. J. Environ. Sci. Technol., 2014, 11(5), 1439–1448 CrossRef CAS.
- A. N. Babu, D. S. Reddy, P. Sharma, G. S. Kumar, K. Ravindhranath and G. K. Mohan, Removal of hazardous indigo carmine dye from waste water using treated red mud, Mater. Today: Proc., 2019, 17, 198–208 CAS.
- B. Debina, S. N. Eric, D. Fotio, K. T. Arnaud, D.-Y. Lemankreo and A. N. Rahman, Adsorption of Indigo Carmine Dye by Composite Activated Carbons Prepared from Plastic Waste (PET) and Banana Pseudo Stem, J. Mater. Sci. Chem. Eng., 2020, 8(12), 39–55 CAS.
- V. S. Mane, I. D. Mall and V. C. Srivastava, Kinetic and equilibrium isotherm studies for the adsorptive removal of Brilliant Green dye from aqueous solution by rice husk ash, J. Environ. Manage., 2007, 84(4), 390–400 CrossRef CAS PubMed.
- Z. H. Dastgerdi, S. S. Meshkat and M. D. Esrafili, Enhanced adsorptive removal of indigo carmine dye performance by functionalized carbon nanotubes based adsorbents from aqueous solution: equilibrium, kinetic, and DFT study, J. Nanostruct. Chem., 2019, 9(4), 323–334 CrossRef CAS.
- J. K. Fatombi, E. A. Idohou, S. A. Osseni, I. Agani, D. Neumeyer, M. Verelst, R. Mauricot and T. Aminou, Adsorption of indigo carmine from aqueous solution by chitosan and chitosan/activated carbon composite: kinetics, isotherms and thermodynamics studies, Fibers Polym., 2019, 20(9), 1820–1832 CrossRef CAS.
- S. Ammar, R. Abdelhedi, C. Flox, C. Arias and E. Brillas, Electrochemical degradation of the dye indigo carmine at boron-doped diamond anode for wastewaters remediation, Environ. Chem. Lett., 2006, 4(4), 229–233 CrossRef CAS.
- B. Abdulkhair, M. Salih, A. Modwi, F. Adam, N. Elamin, M. Seydou and S. Rahali, Adsorption behavior of barium ions onto ZnO surfaces: experiments associated with DFT calculations, J. Mol. Struct., 2021, 1223, 128991 CrossRef CAS.
- M. G. Ghoniem, F. A. M. Ali, B. Y. Abdulkhair, M. R. A. Elamin, A. M. Alqahtani, S. Rahali and M. A. Ben Aissa, Highly Selective Removal of Cationic Dyes from Wastewater by MgO Nanorods, Nanomaterials, 2022, 12(6), 1023 CrossRef CAS PubMed.
- J. Hornak, Synthesis, Properties, and Selected Technical Applications of Magnesium Oxide Nanoparticles: A Review, Int. J. Mol. Sci., 2021, 22(23), 12752 CrossRef CAS PubMed.
- S. Rempel, A. J. Ogliari, E. Bonfim, G. W. Duarte, H. G. Riella, L. L. Silva, J. M. M. Mello, C. R. D. M. Baretta and M. A. Fiori, Toxicity effects of magnesium oxide nanoparticles: a brief report, Matéria, 2020, 25(04) DOI:10.1590/S1517-707620200004.1170.
- S. Abinaya, H. P. Kavitha, M. Prakash and A. Muthukrishnaraj, Green synthesis of magnesium oxide nanoparticles and its applications: a review, Sustainable Chem. Pharm., 2021, 19, 100368 CrossRef CAS.
- F. Xiao, L. Fang, W. Li and D. Wang, One-step synthesis of aluminum magnesium oxide nanocomposites for simultaneous removal of arsenic and lead ions in water, RSC Adv., 2015, 5(11), 8190–8193 RSC.
- E. Saied, A. M. Eid, S. E.-D. Hassan, S. S. Salem, A. A. Radwan, M. Halawa, F. M. Saleh, H. A. Saad, E. M. Saied and A. Fouda, The catalytic activity of biosynthesized magnesium oxide nanoparticles (MgO-NPs) for inhibiting the growth of pathogenic microbes, tanning effluent treatment, and chromium ion removal, Catalysts, 2021, 11(7), 821 CrossRef CAS.
- N. Jamil, M. Mehmood, A. Lateef, R. Nazir and N. Ahsan, MgO nanoparticles for the removal of reactive dyes from wastewater, Advanced Materials: TechConnect Briefs, 2015, 1, 353–356 Search PubMed.
- I. W. Siriwardane, R. Udangawa, R. M. de Silva, A. Kumarasinghe, R. G. Acres, A. Hettiarachchi, G. A. Amaratunga and K. N. de Silva, Synthesis and characterization of nano magnesium oxide impregnated granular activated carbon composite for H2S removal applications, Mater. Des., 2017, 136, 127–136 CrossRef CAS.
- Y.-D. Dai, R.-J. Lyu, T. Wu, C.-C. Huang and Y.-W. Lin, Influences of silver halides AgX (X = Cl, Br, and I) on magnesium bismuth oxide photocatalyst in methylene blue degradation under visible light irradiation, J. Photochem. Photobiol., A, 2020, 397, 112585 CrossRef CAS.
- A. Litim, Y. Belhocine, T. Benlecheb, M. G. Ghoniem, Z. Kabouche, F. A. M. Ali, B. Y. Abdulkhair, M. Seydou and S. Rahali, DFT-D4 Insight into the Inclusion of Amphetamine and Methamphetamine in Cucurbit[7]uril: Energetic, Structural and Biosensing Properties, Molecules, 2021, 26(24), 7479 CrossRef CAS PubMed.
- A. Bouhadiba, S. Rahali, Y. Belhocine, H. Allal, L. Nouar and M. Rahim, Structural and energetic investigation on the host/guest inclusion process of benzyl isothiocyanate into β-cyclodextrin using dispersion-corrected DFT calculations, Carbohydr. Res., 2020, 491, 107980 CrossRef CAS PubMed.
- X. Wen, P. Bai, S. Zheng and Y. Tian, Adsorption and dissociation mechanism of hydrogen sulfide on layered FeS surfaces: a dispersion-corrected DFT study, Appl. Surf. Sci., 2021, 537, 147905 CrossRef CAS.
- S. Karimzadeh, B. Safaei and T.-C. Jen, Theorical investigation of adsorption mechanism of doxorubicin anticancer drug on the pristine and functionalized single-walled carbon nanotube surface as a drug delivery vehicle: a DFT study, J. Mol. Liq., 2021, 322, 114890 CrossRef CAS.
- M. Diawara, M. Kamissoko, S. Rahali, D. Samaké, M. Tamboura, B. Diawara and M. Seydou, A Computational Exploration of Ammonia Adsorption on the Kaolinite Clay Surface, Chem. Afr., 2021, 1–10 Search PubMed.
- S. Rahali, Y. Belhocine, J. Touzeau, B. Tangour, F. Maurel and M. Seydou, Balance between physical and chemical interactions of second-row diatomic molecules with graphene sheet, Superlattices Microstruct., 2017, 102, 45–55 CrossRef CAS.
- A. S. Rad, D. Zareyee, M. Peyravi and M. Jahanshahi, Surface study of gallium-and aluminum-doped graphenes upon adsorption of cytosine: DFT calculations, Appl. Surf. Sci., 2016, 390, 444–451 CrossRef.
- M. D. Esrafili, Nitrogen-doped (6, 0) carbon nanotubes: a comparative DFT study based on surface reactivity descriptors, Comput. Theor. Chem., 2013, 1015, 1–7 CrossRef CAS.
- B. Li and H. Metiu, DFT studies of oxygen vacancies on undoped and doped La2O3 surfaces, J. Phys. Chem. C, 2010, 114(28), 12234–12244 CrossRef CAS.
- Ü. Ünlü, S. Kemec and G. S. P. Soylu, The impact of alkaline earth oxides on Bi2O3 and their catalytic activities in photodegradation of bisphenol A, Turk. J. Chem., 2021, 45(3), 683–693 CrossRef PubMed.
- A. Modwi, M. Abbo, E. Hassan and A. Houas, Effect of annealing on physicochemical and photocatalytic activity of Cu 5% loading on ZnO synthesized by sol–gel method, J. Mater. Sci.: Mater. Electron., 2016, 27(12), 12974–12984 CrossRef CAS.
- G. Kresse and J. Hafner, Ab initio molecular dynamics for liquid metals, Phys. Rev. B: Condens. Matter Mater. Phys., 1993, 47(1), 558 CrossRef CAS PubMed.
- J. P. Perdew, K. Burke and M. Ernzerhof, Generalized gradient approximation made simple, Phys. Rev. Lett., 1996, 77(18), 3865 CrossRef CAS PubMed.
- S. Grimme, J. Antony, S. Ehrlich and H. Krieg, A consistent and accurate ab initio parametrization of density functional dispersion correction (DFT-D) for the 94 elements H-Pu, J. Chem. Phys., 2010, 132(15), 154104 CrossRef PubMed.
- J. B. Condon, Surface area and porosity determinations by physisorption: measurements and theory, Elsevier, 2006 Search PubMed.
- V. J. Inglezakis, S. G. Poulopoulos and H. Kazemian, Insights into the S-shaped sorption isotherms and their dimensionless forms, Microporous Mesoporous Mater., 2018, 272, 166–176 CrossRef CAS.
- H. Wang, G. Li and A. Fakhri, Fabrication and structural of the Ag2S-MgO/graphene oxide nanocomposites with high photocatalysis and antimicrobial activities, J. Photochem. Photobiol., B, 2020, 207, 111882 CrossRef CAS PubMed.
- S. Rahali, M. A. Ben Aissa, L. Khezami, N. Elamin, M. Seydou and A. Modwi, Adsorption behavior of Congo red onto barium-doped ZnO nanoparticles: correlation between experimental results and DFT calculations, Langmuir, 2021, 37(24), 7285–7294 CrossRef CAS PubMed.
- S. Xu, Z. Zhong, W. Liu, H. Deng and Z. Lin, Removal of Sb(III) from wastewater by magnesium oxide and the related mechanisms, Environ. Res., 2020, 186, 109489 CrossRef CAS PubMed.
- Y. Liu, Q. Li, S. Gao and J. K. Shang, Exceptional As(III) sorption capacity by highly porous magnesium oxide nanoflakes made from hydrothermal synthesis, J. Am. Ceram. Soc., 2011, 94(1), 217–223 CrossRef CAS.
- S. Taghavi Fardood, A. Ramazani and S. Woo Joo, Eco-friendly synthesis of magnesium oxide nanoparticles using arabic Gum, J. Appl. Chem. Res., 2018, 12(1), 8–15 Search PubMed.
- J. Yang, T. Xie, C. Liu and L. Xu, Facile fabrication of dumbbell-like β-Bi2O3/graphene nanocomposites and their highly efficient photocatalytic activity, Materials, 2018, 11(8), 1359 CrossRef PubMed.
- M. Tommalieh, Electrical conductivity characterization of chitosan/poly(vinyl alcohol) doped by bismuth oxide nanoparticles, Compos. Commun., 2021, 25, 100692 CrossRef.
- M. Shehata, S. Waly and Y. Abdelaziz, Effect of Gd3+ doping on structural and optical properties of MgO–MgAl2O4 nanocomposites synthesized via co-precipitation method, J. Mater. Sci.: Mater. Electron., 2021, 32(6), 7423–7430 CrossRef CAS.
- O. Ayodele, S. J. Olusegun, O. O. Oluwasina, E. A. Okoronkwo, E. O. Olanipekun, N. D. Mohallem, W. G. Guimarães, B. L. d. M. Gomes, G. d. O. Souza and H. A. Duarte, Experimental and theoretical studies of the adsorption of Cu and Ni ions from wastewater by hydroxyapatite derived from eggshells, Environ. Nanotechnol., Monit. Manage., 2021, 15, 100439 CAS.
- R. E. Palma-Goyes, J. Silva-Agredo, I. González and R. A. Torres-Palma, Comparative degradation of indigo carmine by electrochemical oxidation and advanced oxidation processes, Electrochim. Acta, 2014, 140, 427–433 CrossRef CAS.
- M. G. Yazdi, M. Ivanic, A. Mohamed and A. Uheida, Surface modified composite nanofibers for the removal of indigo carmine dye from polluted water, RSC Adv., 2018, 8(43), 24588–24598 RSC.
- I. Chaari, E. Fakhfakh, M. Medhioub and F. Jamoussi, Comparative study on adsorption of cationic and anionic dyes by smectite rich natural clays, J. Mol. Struct., 2019, 1179, 672–677 CrossRef CAS.
- B. Hameed, J. Salman and A. Ahmad, Adsorption isotherm and kinetic modeling of 2,4-D pesticide on activated carbon derived from date stones, J. Hazard. Mater., 2009, 163(1), 121–126 CrossRef CAS PubMed.
- A. El-Sikaily, A. El Nemr, A. Khaled and O. Abdelwehab, Removal of toxic chromium from wastewater using green alga Ulva lactuca and its activated carbon, J. Hazard. Mater., 2007, 148(1), 216–228 CrossRef CAS PubMed.
- M. R. Yazdani, T. Tuutijärvi, A. Bhatnagar and R. Vahala, Adsorptive removal of arsenic(V) from aqueous phase by feldspars: kinetics, mechanism, and thermodynamic aspects of adsorption, J. Mol. Liq., 2016, 214, 149–156 CrossRef CAS.
- B. Royer, N. F. Cardoso, E. C. Lima, J. C. Vaghetti, N. M. Simon, T. Calvete and R. C. Veses, Applications of Brazilian pine-fruit shell in natural and carbonized forms as adsorbents to removal of methylene blue from aqueous solutions—kinetic and equilibrium study, J. Hazard. Mater., 2009, 164(2–3), 1213–1222 CrossRef CAS PubMed.
- S. Allen, G. Mckay and K. Khader, Intraparticle diffusion of a basic dye during adsorption onto sphagnum peat, Environ. Pollut., 1989, 56(1), 39–50 CrossRef CAS PubMed.
- S. K. Lagergren, About the theory of so-called adsorption of soluble substances, Sven. Vetenskapsakad. Handl., 1898, 24, 1–39 Search PubMed.
- S. Chien and W. Clayton, Application of Elovich equation to the kinetics of phosphate release and sorption in soils, Soil Sci. Soc. Am. J., 1980, 44(2), 265–268 CrossRef CAS.
- L. Hevira, J. O. Ighalo and R. Zein, Biosorption of indigo carmine from aqueous solution by Terminalia catappa shell, J. Environ. Chem. Eng., 2020, 8(5), 104290 CrossRef CAS.
- K. Y. Kumar, H. Muralidhara, Y. A. Nayaka, J. Balasubramanyam and H. Hanumanthappa, Low-cost synthesis of metal oxide nanoparticles and their application in adsorption of commercial dye and heavy metal ion in aqueous solution, Powder Technol., 2013, 246, 125–136 CrossRef CAS.
- H. Alrobei, M. Prashanth, C. Manjunatha, C. P. Kumar, C. Chitrabanu, P. D. Shivaramu, K. Y. Kumar and M. Raghu, Adsorption of anionic dye on eco-friendly synthesised reduced graphene oxide anchored with lanthanum aluminate: isotherms, kinetics and statistical error analysis, Ceram. Int., 2021, 47(7), 10322–10331 CrossRef CAS.
- M. A. Al-Ghouti and M. M. Razavi, Water reuse: brackish water desalination using Prosopis juliflora, Environ. Technol. Innovation, 2020, 17, 100614 CrossRef.
- N. Ayawei, A. N. Ebelegi and D. Wankasi, Modelling and interpretation of adsorption isotherms, J. Chem., 2017, 2017 DOI:10.1155/2017/3039817.
- M. Adel, M. A. Ahmed and A. A. Mohamed, Effective removal of indigo carmine dye from wastewaters by adsorption onto mesoporous magnesium ferrite nanoparticles, Environ. Nanotechnol., Monit. Manage., 2021, 16, 100550 CAS.
- Z. Harrache, M. Abbas, T. Aksil and M. Trari, Thermodynamic and kinetics studies on adsorption of indigo carmine from aqueous solution by activated carbon, Microchem. J., 2019, 144, 180–189 CrossRef CAS.
- M. Ahmed and A. Mohamed, An efficient adsorption of indigo carmine dye from aqueous solution on mesoporous Mg/Fe layered double hydroxide nanoparticles prepared by controlled sol-gel route, Chemosphere, 2017, 174, 280–288 CrossRef CAS PubMed.
- Z. H. Dastgerdi, S. S. Meshkat and M. D. Esrafili, Enhanced adsorptive removal of indigo carmine dye performance by functionalized carbon nanotubes based adsorbents from aqueous solution: equilibrium, kinetic, and DFT study, J. Nanostruct. Chem., 2019, 9(4), 323–334 CrossRef CAS.
- A. H. Gemeay, E. F. Aboelfetoh and R. G. El-Sharkawy, Immobilization of green synthesized silver nanoparticles onto amino-functionalized silica and their application for indigo carmine dye removal, Water, Air, Soil Pollut., 2018, 229(1), 1–17 CrossRef CAS.
- S. A. Patil, P. D. Kumbhar, S. K. Patil, M. M. Vadiyar, U. P. Suryawanshi, C. L. Jambhale, M. A. Anuse, J. H. Kim and S. S. Kolekar, Dynamic adsorption of toxic indigo carmine dye on bio-inspired synthesised Fe3O4 nanoparticles: kinetic and thermodynamic study, Int. J. Environ. Anal. Chem., 2020, 1–23 CrossRef.
- J. Zolgharnein and M. Rastgordani, Optimization of simultaneous removal of binary mixture of indigo carmine and methyl orange dyes by cobalt hydroxide nano-particles through Taguchi method, J. Mol. Liq., 2018, 262, 405–414 CrossRef CAS.
- J. Acharya, J. Sahu, C. Mohanty and B. Meikap, Removal of lead(II) from wastewater by activated carbon developed from Tamarind wood by zinc chloride activation, Chem. Eng. J., 2009, 149(1–3), 249–262 CrossRef CAS.
- S. Heo, E. Cho, H.-I. Lee, G. S. Park, H. J. Kang, T. Nagatomi, P. Choi and B.-D. Choi, Band gap and defect states of MgO thin films investigated using reflection electron energy loss spectroscopy, AIP Adv., 2015, 5(7), 077167 CrossRef.
- S. Kohiki, M. Arai, H. Yoshikawa and S. Fukushima, Energy Loss Structure of X-ray Photoelectron Spectra of MgO and α-Al2O3, J. Phys. Chem. B, 1999, 103(25), 5296–5299 CrossRef CAS.
| This journal is © The Royal Society of Chemistry 2022 |

