 Open Access Article
Preparation, characterization, and performance of PES/GO woven mixed matrix nanocomposite forward osmosis membrane for water desalination†
Mervat Nasr *ab,
Nada Alfryyanc,
Sahar S. Ali
 d,
Hanafy M. Abd El-Salama and
Mohamed Shaban
 be
be
aChemistry Department, Faculty of Science, Beni-Suef University, Beni-Suef 62514, Egypt. E-mail: mohamed.fadel@science.bsu.edu.eg
bNanophotonics and Applications (NPA) Lab, Physics Department, Faculty of Science, Beni-Suef University, Beni-Suef, 62514, Egypt
cDepartment of Physics, College of Sciences, Princess Nourah bint Abdulrahman University, P.O. Box 84428, Riyadh 11671, Saudi Arabia
dChemical Engineering and Pilot-Plant Department, National Research Center, P.O. Box 12622, Dokki, Cairo, Egypt
eDepartment of Physics, Faculty of Science, Islamic University of Madinah, Al-Madinah Al-Munawarah, 42351, Saudi Arabia
First published on 8th September 2022
Abstract
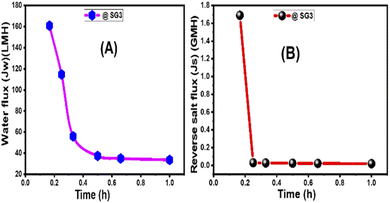
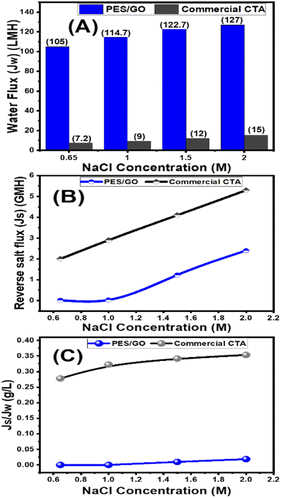
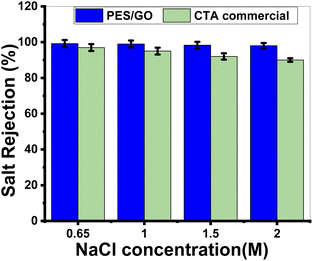
Mixed matrix woven forward osmosis (MMWFO) membranes made of polyethersulfone (PES)/graphene oxide nanosheets (GO NSs) were made by inserting varying wt% ratios of GO NSs (zero to 0.1 wt%) into the PES matrix. A coated woven fabric material was used to cast the membrane polymer solution. The physical characteristics and chemical structures of the produced PES/GO MMWFO membranes were studied, including contact angle, hydrophilicity, porosity, tortuosity, function groups, chemical and crystallographic structures, nanomorphologies, and surface roughness. The performance of the prepared PES/GO FO membranes for water desalination was evaluated in terms of pure water flux (Jw), reverse salt flux (Js), and salt rejection (SR). The hydrophilicity and porosity of the FO membrane improved with the addition of GO NSs, as did water permeability due to the development of multiple skin-layer structures with greater GO NS loading. These GO NSs establish shortcut pathways for water molecules to move through, reducing support layer tortuosity by three times, lowering support layer structural features, and minimizing internal concentration polarization (ICP). The PES/0.01 wt% GO MMWFO membrane with a total casting thickness of 215 μm and 1 M NaCl concentration had the best performance, with the highest Jw (114.7 LMH), lowest Js (0.03 GMH), and lowest specific reverse solute flux (Js/Jw = 0.00026 g L−1), as well as a more favorable structural parameter (S = 149 μm). The performance of our optimized membrane is significantly better than that of the control woven commercial cellulose triacetate (CTA) FO membrane under optimal FO conditions. As the NaCl concentration increased from 0.6 to 2 M, Jw increased from 105 to 127 LMH which is much higher than the Jw of the commercial one (7.2 to 15 LMH). Our FO membranes have an SR of 99.2%@0.65 M NaCl, which is significantly greater than that of the CTA membrane.
1 Introduction
Desalination is becoming an important part of dealing with global water scarcity issues. Although current desalination methods like thermal distillation, reverse osmosis (RO), and forward osmosis (FO) have made a significant contribution to the success of sea/brackish water desalination, additional research is required.1 Artificial polymeric membrane technology has received a lot of attention from both academia and industry.2,3 Membrane technology's advantages over other operating technologies are based on the membrane selectivity separation idea, which may be carried out isothermally and with minimal energy usage.4,5 Membrane processes are energy efficient, easy to run, scale up and down, and operate at room temperature, which prevents product change or deterioration.6–9 A membrane is a semi-permeable barrier that facilitates the transfer of one or more compounds under a certain driving force, such as molecules, particles, gases, and/or a liquid mixture or solution.9–12 Depending on the driving force of separation and the particle size of the separated species, the driving force across the membrane can be quantified as a difference in pressure, concentration, and voltage.13 Forward osmosis (FO) is gaining popularity as a cost-effective alternative to traditional membrane technologies, notably reverse osmosis (RO), for brackish and seawater desalination, wastewater treatment, osmotic power production, and food processing.14–22 The driving force in the FO process is naturally created by the osmotic pressure differences created by the more concentrated draw solution (DS) on the permeate side of the membrane.23,24 Furthermore, adopting a low working pressure in the FO process decreases fouling, lowers cleaning frequency, and perhaps improves membrane longevity.25–27 As a result, FO is a superior technology to RO, as indicated by the significant growth in FO research papers in the recent 2–3 years. Recent research has concentrated on strategies to improve the characteristics of the FO membrane, particularly at the top active skin layer, due to the inherent benefits that the FO membrane gives in the water desalination process.26,28 The FO process offers many benefits over standard RO processes, including lower energy consumption and a lesser inclination for clogging.29,30 FO has also been investigated for the treatment of wastewater, anaerobic digestion, and shale gas drilling backflow fluid.16,31,32 The FO process, however, presents a few important challenges being a relatively new technology that must be overcome. FO membranes must enhance their performance and economic viability. The FO membrane might be one of the most critical elements in its economic feasibility, given the FO process's very low water flow compared to other membrane processes such as RO. Dilutive internal concentration polarization (ICP), which must be addressed to enhance membrane performance, is the major cause of reduced water flow in the FO process.30,33,34 On the active layer side of the FO membrane, external concentration polarization (ECP) occurs, while internal concentration polarization (ICP) occurs within the support layer, preventing draw solutes from diffusing into the substrate layer.35 While the ECP can be reduced by adjusting hydrodynamic operating conditions such as crossflow velocity, the ICP cannot be reduced by adjusting hydrodynamic operating conditions alone. ICP can be reduced by enhancing the intrinsic features of the membrane support layer, such as porosity, pore size distribution, tortuosity, and thickness.36,37 The structural parameter (S value) is commonly used to indirectly evaluate the degree of the ICP effect in the FO process as an indicative measure for membrane property.38 Few studies have recently presented FO membranes with thin substrates of low S value, high porosity with macro-voids, and high wettability to reduce ICP and enhance water permeability.33,39 The majority of efforts to construct FO membranes have focused on creating a very porous membrane substrate with finger-like macro-voids, which can be achieved by lowering the polymer concentration during the phase inversion process. Polymeric membranes are frequently employed because of their ease of manufacture, flexibility, toughness, and low cost. However, they have poor mechanical, chemical, and thermal resistance, as well as anti-fouling properties.40–42 Their low anti-fouling efficacy was attributed to their hydrophobic nature. Membrane modification methods such as bulk modification, surface coating, and mixing have all been developed to improve membrane characteristics. An inorganic nanomaterial, such as carbon nanotubes (CNTs),43 titanium oxide,44 or zeolite,45 can be used as a modifier to increase the polymeric membranes' selectivity, strength, antifouling, and permeability properties. Among suggested modifiers, the inclusion of GO NSs can improve the wettability, chemical stability, porosity, and anti-fouling performance of TFC FO membranes.46,47 According to our understanding, GO incorporation into PES substrate can boost membrane pore width, porosity, and hydrophilicity due to the abundance of hydrophilic functional groups on its surface, such as hydroxyl, epoxide, carbonyl, and carboxyl, which significantly can increase water permeability. A huge surface area and excellent mechanical qualities are also associated with GO. It has previously been used as a nanofiller to increase water permeability, anti-fouling, and chlorine resistance in membrane selective layer production.48–51 Membranes made of polyether sulfone (PES) are frequently employed in water desalination and biomedical areas. With a high glass temperature, the PES membrane offers good thermal, mechanical, and oxidative properties. The hydrophobicity of the PES membrane, which acts as a separation barrier, might be seen as a drawback. Because of its simplicity, low cost, and large output, the phase inversion method is the most often used technique for PES-based membrane preparation. This process is also more practical than other ways of combining polymer matrices with various nanostructures to increase their performance. According to Shaban et al., adding titanium nanotubes to PES increases membrane porosity and improves membrane performance.52 This study used a woven fabric as backing support to investigate the integration of GO NSs into PES FO membrane properties and performance. The effects of various GO NSs weight-percentage ratios on morphology, total porosity, contact angle, water flux, reverse salt flux, and salt rejection were studied. The performance of the membrane filtering system was assessed in the FO mode, with distilled water as the feed solution and 1 M NaCl as the draw solution, with the active layer facing the feed solution (AL-FS). The originality of this research lies in the preparation and optimization of MMWGO/PES membranes by combining PES with ultrathin multi-layer nano sheet GO at different concentrations, which results in a multi-thin layer of honey comp pore structure that increases water transportability (higher flux) and filterability. Furthermore, using a woven fabric with a sizable open area and an evenly distributed, compacted nano sheet GO layer will enhance the functionality and antifouling properties of the FO membrane. Additionally, membranes made with ultrathin multilayer nano GO that embed and coat, respectively, the top and bottom surfaces of the woven fabric boost water flux and minimize reverse salt flux.2 Experimental details
2.1 Materials
Polyethersulfone (PES ultrason E6020P, MW = 58![[thin space (1/6-em)]](https://www.rsc.org/images/entities/char_2009.gif) 000 g mol−1) was supplied by BASF Company, Germany. N,N-Dimethylformamide (DMF) (CAS no. 68-12-2), polyethylene glycol (PEG), H2SO4, and H3PO4 were purchased from Sigma-Aldrich, Germany. Graphite was purchased from VEB Laborchemie Apolda, Germany. H2O2 and KMnO4 were purchased from Adwic Company, Egypt. The commercial CTA FO membranes supplied by Hydration Technology Innovation (HTI, Albany, USA) which is denoted as HTI-CTA was used for comparison.
000 g mol−1) was supplied by BASF Company, Germany. N,N-Dimethylformamide (DMF) (CAS no. 68-12-2), polyethylene glycol (PEG), H2SO4, and H3PO4 were purchased from Sigma-Aldrich, Germany. Graphite was purchased from VEB Laborchemie Apolda, Germany. H2O2 and KMnO4 were purchased from Adwic Company, Egypt. The commercial CTA FO membranes supplied by Hydration Technology Innovation (HTI, Albany, USA) which is denoted as HTI-CTA was used for comparison.
2.2 Methods
| Membrane ID | PES (wt%) | DMF (wt%) | GO NSs (wt%) | PEG (wt%) |
|---|---|---|---|---|
| Bare PES | 20 | 79 | 0 | 1 |
| SG1 | 20 | 78.996 | 0.004 | 1 |
| SG2 | 20 | 78.992 | 0.008 | 1 |
| SG3 | 20 | 78.99 | 0.01 | 1 |
| SG4 | 20 | 78.96 | 0.04 | 1 |
| SG5 | 20 | 78.92 | 0.08 | 1 |
| SG6 | 20 | 78.9 | 0.1 | 1 |
2.2.4.1 Morphology and contact angle. SEM images of membrane samples were obtained by a field-emission scanning electron microscope (FESEM, ZEISS SUPRA 55 VP, Gemini Column). Membrane samples were dried in an oven at the temperature of 30 °C before the test. Cutting the membrane with one sharp blow was done for cross-section SEM imaging. Surface roughness utilizing Image j software (v5.0.3) for analysis. Fourier transform infrared spectroscopy (ATR-FTIR, VERTEX 70, Bruker) in the range of 600–4000 cm−1 was used to recognize the functional groups of the membrane. The contact angle plays an important role to describe the hydrophobicity of membrane and membrane fouling. The contact angle of the PES/GO MMW was measured by the sessile drop method, and measurements were carried out at least three times, and the average values were taken to minimize the error. The physical parameters such as membrane contact angle, water uptake, porosity, tortuosity, and structure parameter were determined for PES and PES/GO MMW FO membranes.
2.2.4.2 Water uptake rate. The weight change after hydration was used to measure the water uptake rate and porosity of modified PES/GO MMW FO membranes. The membrane was initially soaked for 24 hours in DW at room temperature. After cleaning the surface with filter paper, the membrane was promptly weighed to estimate the weight of the wetted membrane (Ww). After that, the wet membranes were dried for 24 hours in an air-circulating oven at 80 °C, and then the dried membranes were weighed (Wd).
The following equation was used to calculate the percentage of water uptake.58
 | (1) |
2.2.4.3 Porosity (P). The membrane porosity of membranes was calculated using the following equation:59
 | (2) |
Ww and Wd are the weights of wet and dry membranes (g), respectively; and P is the membrane porosity. V = A × t, where A is the membrane surface area (cm2), and t is the membrane thickness (cm).
2.2.4.4 Tortuosity (τ) and structure parameter (S). Membrane tortuosity (τ) can calculate using eqn (3) by the porosity of the membrane:60
 | (3) |
Membrane structural parameter (S) is one of the critical properties of any osmotic membranes and is given by the following relationship that depends on the support layer thickness (t) and tortuosity (τ) and its porosity (ε).61
 | (4) |
2.3 PES/GO MMW FO membrane performance
The performance of the fabricated PES/GO MMW membrane was carried out using a bench-scale FO setup.62 A membrane with a surface area of 56 cm2 was employed for the testing, which was done in the FO mode with the shiny face (active layer) facing feed solution (DW) and the other layer facing 1 M NaCl solution as draw solution, respectively. All FO testing experiment was applied at a fixed crossflow rate of 0.857 L min−1 and room temperature. The FO membrane performance is represented as, water flux (Jw, LMH), reverse salt flux (RSF) (Js, GMH), specific reverse salt flux (SRSF), (Js/Jw, g L−1), and rejection (R%) was estimated as follows:
 | (5) |
 | (6) |
1-The membrane was sliced into a 5 cm disc and placed in the test cell on a porous stainless-steel support.
2-The cell was filled with a 2000 mg L−1 NaCl solution as the feed solution.
3-At three bars of pressure were adjusted.
4-To achieve a constant liquid flow rate, the membrane was fixed for 10 to 15 minutes.
5-In a measuring cylinder, the permeate solution was collected.
6-A conductivity meter (Janeway 2 s to 200 mS) was used to test the feed and permeate conductivities.
 | (7) |
 | (8) |
3. Results and discussion
3.1 Characterization of GO NSs prepared
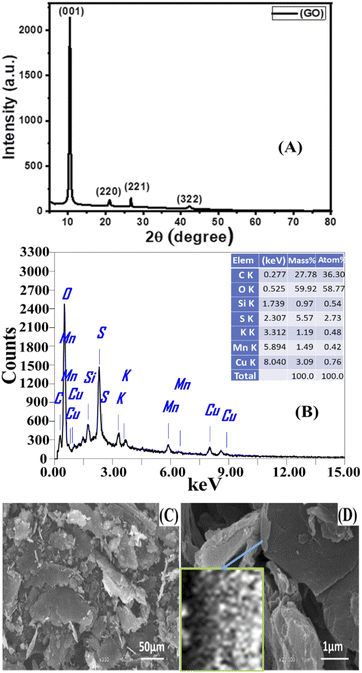
The crystallite size (D) of GO was estimated using the full width at half the maximum of the peaks (β) from XRD data using Scherrer's formula:65,66
 | (9) |
Texture coefficient is an important parameter to identify preferential orientations for the growth of the crystallites. So, the effect of preparation conditions on the orientation of the GO was investigated by calculating the texture coefficient Tc(hkl) using the following equation:
 | (10) |
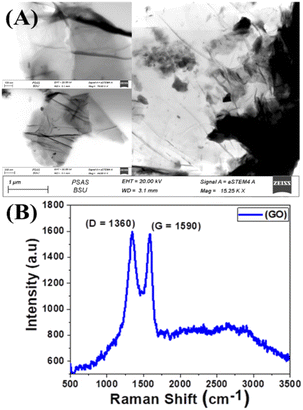
A typical transmission electron microscope (TEM) examination for synthesized GO is shown in Fig. 2(A). The TEM revealed that the GO has a stacked sheet structure with a wrinkled edge that is a few nanometers in size. Moreover, during the oxidation process, a symmetrical shape (mesoporous structure) with a cracked structure appeared in Fig. 2(A). In addition, we note that GO is multi-folded sheets with a definite surface area. This may be attributed to van der Waals's interaction between every two adjacent sheets of GO and the agglomeration of GO sheets during the drying process.68
3.2. PES/GO MMW FO membranes characterization
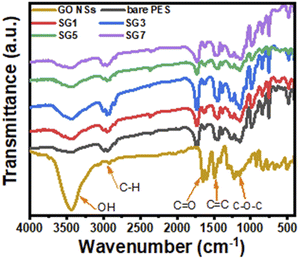
![[double bond, length as m-dash]](https://www.rsc.org/images/entities/char_e001.gif) O), and others, as shown from the GO FT-IR spectrum. This agrees with the information provided by Yu et al.71 The considerable amounts of oxygen-containing functional groups, including carboxyl, hydroxyl, and carbonyl, that are present on GO and give it its hydrophilic qualities are caused by oxidation. As a result, adding GO to PES in different ratios boosts the concentration of hydroxyl groups until it reaches an optimal level, which enhances the hydrophilicity of the membrane. From Fig. 3, as the GO wt% ratio increases, the peak intensity of hydroxyl groups increases and is located at 3100–3600 cm−1. There are other characteristic peaks related to C
O), and others, as shown from the GO FT-IR spectrum. This agrees with the information provided by Yu et al.71 The considerable amounts of oxygen-containing functional groups, including carboxyl, hydroxyl, and carbonyl, that are present on GO and give it its hydrophilic qualities are caused by oxidation. As a result, adding GO to PES in different ratios boosts the concentration of hydroxyl groups until it reaches an optimal level, which enhances the hydrophilicity of the membrane. From Fig. 3, as the GO wt% ratio increases, the peak intensity of hydroxyl groups increases and is located at 3100–3600 cm−1. There are other characteristic peaks related to C![[double bond, length as m-dash]](https://www.rsc.org/images/entities/char_e001.gif) O stretching vibration at 1713 cm−1 confirming the formation of GO NSs, as indicated in the XRD analysis. Fig. 3 shows that the C
O stretching vibration at 1713 cm−1 confirming the formation of GO NSs, as indicated in the XRD analysis. Fig. 3 shows that the C![[double bond, length as m-dash]](https://www.rsc.org/images/entities/char_e001.gif) O peak grew as the GO NSs weight percent ratio rose, reaching its highest intensity for SG3 (GO NSs = 0.01 wt%) and resulting in a more hydrophilic membrane surface.71 Then the intensities of the peaks decrease with any further addition of GO NSs. The presence of boarding peaks confirmed the successful incorporation of GO NSs in the polymer matrix. There are other many peaks observed in the IR spectrum related to PES. The peak around 1295 cm−1 is arising due to O
O peak grew as the GO NSs weight percent ratio rose, reaching its highest intensity for SG3 (GO NSs = 0.01 wt%) and resulting in a more hydrophilic membrane surface.71 Then the intensities of the peaks decrease with any further addition of GO NSs. The presence of boarding peaks confirmed the successful incorporation of GO NSs in the polymer matrix. There are other many peaks observed in the IR spectrum related to PES. The peak around 1295 cm−1 is arising due to O![[double bond, length as m-dash]](https://www.rsc.org/images/entities/char_e001.gif) S
S![[double bond, length as m-dash]](https://www.rsc.org/images/entities/char_e001.gif) O asymmetric stretching, whereas the symmetric stretching of O–S–O gives a band at around 1150 cm−1. The bands at around 1240 cm−1 and 1040 cm−1 are characteristic peaks corresponding to asymmetric and symmetric stretching vibrations of the C–O–C group, respectively. Also, peaks between 2900 cm−1 and 3100 cm−1 correspond to aromatic and aliphatic C–H stretching vibrations.72
O asymmetric stretching, whereas the symmetric stretching of O–S–O gives a band at around 1150 cm−1. The bands at around 1240 cm−1 and 1040 cm−1 are characteristic peaks corresponding to asymmetric and symmetric stretching vibrations of the C–O–C group, respectively. Also, peaks between 2900 cm−1 and 3100 cm−1 correspond to aromatic and aliphatic C–H stretching vibrations.72
3.2.2.1 SEM analysis of PES/GO MMW FO membranes. Fig. 4 shows FE-SEM images of top, bottom, and cross-section surfaces of PES/GO MMW membranes with different wt% ratios of GO NSs. Fig. 4(A–E) shows significant differences between the surface images of the bare PES and blended PES/GO MMW membranes. The FE-SEM images clearly showed that GO NSs immigrate to the top and bottom surfaces of the membranes. A possible explanation for this can be given based on the hydrophilic nature of GO NSs. The hydrophilic nature of GO NSs is responsible for the fast exchange of solvent and non-solvent during the phase inversion process which leads to extended porosity as well as changes in the macro-void structure.73,74 In addition, as seen from the FE-SEM image, GO NSs with weight ratios ranging from zero to 0.1 wt% were well dispersed in the polymer matrix. Also, at a higher GO NSs wt% ratio, we noticed the presence of GO NSs agglomeration at the membrane surface which is attributed to the carbon-based structure of GO NSs as shown in Fig. 4(D and E).
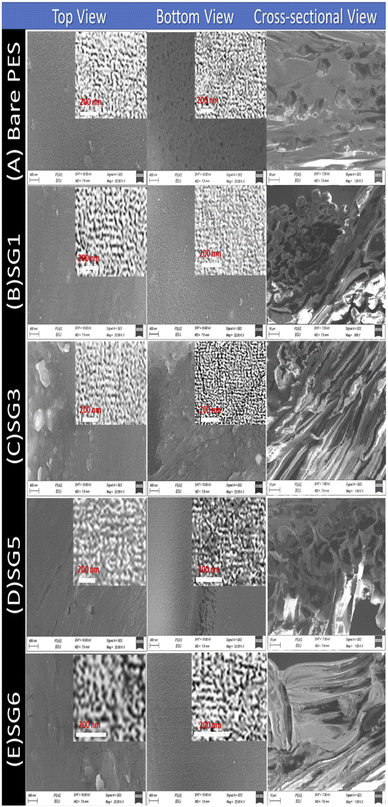 | ||
| Fig. 4 Top, bottom, and cross-sectional SEM images of PES/GO MMW FO membranes with different GO NSs wt% ratios. | ||
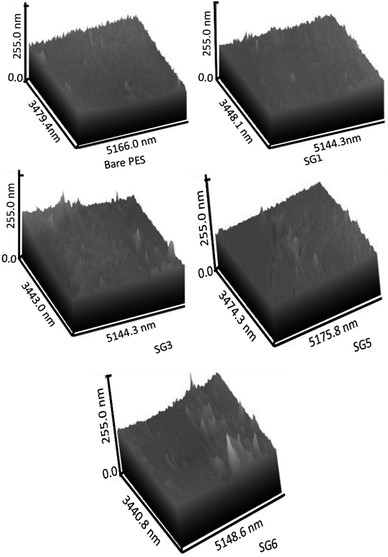
The cross-section images of the prepared nanocomposite membranes indicated that the structural morphology was greatly affected by the addition of GO NSs (Fig. 4). The cross-section of bare PES, Fig. 4(A) is an individual micro void structure, which is drastically altered by the addition of GO NSs to the polymer matrix during the phase separation process, Fig. 4(B). These macro-voids extended from the top surface to the bottom with increasing GO NSs wt% ratio till SG3 (0.01 wt%) in Fig. 4(C). By adding GO NSs with a weight ratio larger than 0.01 wt%, the GO NSs are agglomerated, and macro-voids are converted to layer structure (SG6 with 0.1 wt%) as shown in Fig. 4(E). Double skin-layer structures were developed after loading GO NSs higher than 0.01 wt% ratio as shown in Fig. 4(E), which in turn, enhances the water permeability.75 These results completely agreed with AFM measurements as illustrated in Fig. 5 and listed in Table 2.
| Sample | Ra (nm) | Rq (nm) | ||
|---|---|---|---|---|
| Top | Bottom | Top | Bottom | |
| Bare PES | 23.38 | 23.66 | 24.37 | 24.52 |
| SG1 | 23.55 | 24.11 | 24.46 | 24.77 |
| SG3 | 24.25 | 24.72 | 24.83 | 25.08 |
| SG5 | 24.29 | 24.75 | 24.86 | 25.1 |
| SG6 | 24.46 | 24.46 | 24.92 | 24.92 |
In general, all PES membranes with or without GO NSs displayed asymmetric porous sub-layer structure with a dense top-layer and porous layer at the middle and bottom structure. Also as shown in the insets of Fig. 4(A–C), the pore size decreases from virgin PES membrane to SG3 membrane. After that, the pore size increases with increasing GO NSs wt% at SG5 and SG6 membranes, insets of Fig. 4(D and E). This finding implies that when the weight% ratio of GO NSs increases, the hydrophilic character of GO NSs improves. It also refers to the coagulation step's enhancement of the mass exchange rate between solvent and non-solvent, allowing for the creation of wider pore channels. This is consistent with IR studies, which showed a broad characteristic stretching band of the hydroxyl group between 3100 and 3600 cm−1.
3.2.2.2. AFM analysis and roughness parameters. The three-dimensional AFM image of the nanocomposite membranes surface is shown in Fig. 5. Concerning surface roughness, as shown in AFM images of Fig. 5, the surface roughness of PES/GO MMW membranes was increased from 23.38 to 24.46 nm and bottom roughness was increased from 23.66 to 24.75 by an increase in GO NSs loading from zero to 0.1 wt%. The creation of a double-skinned layer PES/GO MMW FO membrane is shown by the sample SG6 roughness of the top and bottom being equal. This result is most likely due to the hydrophilic character of GO NSs, which accelerated phase exchange during the phase inversion process, allowing these nanoparticles to migrate to the membrane surface and bottom. According to AFM results, it could be concluded that GO NSs were significantly incorporated on the membrane surface. The surface roughness parameters of the prepared membrane are presented in Table 2. The Ra parameter represents the mean roughness of the scanning surface, and Rq is the mean square root roughness. From Table 2, the addition of GO NSs changes the roughness of the PES membrane. Ra value increases may lead to flux augmentation, which is followed by an increase in the area accessible for water transport, surface pore diameter, mechanical strength, and thermal stability. Also, the surface roughness of the membrane is a very effective parameter in its antifouling features. An essential feature of nanofiller addition in polymeric solution is that it increases the viscosity of the solution as the nanoparticle loading increases. Although the viscosity of polymeric solutions was not tested experimentally, the addition of GO NSs changed the viscosity of polymeric casting solution. Many publications on this phenomenon claim that increased viscosity causes lateral holes to form, similar to the pores seen in this study.76,77
| Samples | GO NSs wt% ratio | Water uptake (%) | Porosity (%) | Contact angle (degree) | Thickness (μm) | Tortuosity (τ) |
|---|---|---|---|---|---|---|
| Total casting thickness = 215 μm | ||||||
| Bare PES | 0 | 35 | 40 | 76 | 149 ± 4.4 | 6.4 |
| SG1 | 0.004 | 47 | 56 | 74 | 151 ± 4.5 | 3.7 |
| SG2 | 0.008 | 48 | 59 | 69 | 155 ± 4.6 | 3.3 |
| SG3 | 0.01 | 49 | 62 | 65 | 159 ± 4.7 | 3 |
| SG4 | 0.04 | 51 | 60 | 60 | 160 ± 4.8 | 3.2 |
| SG5 | 0.08 | 53 | 59 | 58 | 162 ± 4.8 | 3.3 |
| SG6 | 0.1 | 55 | 54 | 55 | 167 ± 5.0 | 3.9 |
![[thin space (1/6-em)]](https://www.rsc.org/images/entities/char_2009.gif) |
||||||
| Total casting thickness = 265 μm | ||||||
| Bare PES | 0 | 34 | 32 | 72 | 163 ± 4.8 | 8.82 |
| SG1 | 0.004 | 35 | 39 | 70 | 156 ± 4.6 | 6.6 |
| SG2 | 0.008 | 36 | 41 | 65 | 158 ± 4.7 | 6.1 |
| SG3 | 0.01 | 42 | 47 | 58 | 162 ± 4.8 | 4.9 |
| SG4 | 0.04 | 44.5 | 43 | 57 | 177 ± 5.3 | 5.7 |
3.2.3.1. Water contact angles. The contact angle parameter is used to study the wettability (hydrophilicity) of the membrane surface. Contact angles are evaluated and documented in Table 3 to investigate the influence of GO NSs loading on the hydrophilicity of PES/GO MMW FO membranes. The contact angle of the bare PES membrane was 76°, and the contact angle dropped to roughly 55° when the wt% ratio of loading GO NSs was increased from 0 to 0.1 wt% at a total casting thickness of 215 μm. Due to the hydrophilic characteristic of GO, the PES/GO MMW membranes exhibit a significant increase in membrane surface hydrophilicity when compared to pristine PES membranes.78,79 Also, as noted in SEM images and reported in prior literature, this enhancement in hydrophilicity might be attributable to the migration of loaded GO to the membrane surfaces during phase inversion processes.59,80
3.2.3.2 Membrane water uptake and porosity. Water uptake and porosity of constructed PES/GO MMW membranes are primarily determined by two factors: (1) the number of hydrophilic sites in the membrane matrix, and (2) the membrane surface shape, particularly the existence of macro voids in the polymeric sub-layer. According to Table 3, increasing hydrophilicity (i.e., lowering the contact angle) improves water uptake. With increasing the wt% ratio of loaded GO NSs from zero to 0.1%, the contact angle decreased from 76° to 55°, and the water uptake increased from 35% to 55%. This increase in water uptake may be explained by the fact that the PES MMW membrane's affinity for water rises when the GO NSs include more hydrophilic sites, allowing for easier water uptake into the membrane matrix.72 In addition, because GO NSs create holes and macro voids in sub-layers of the polymer matrix, allowing more water to be absorbed, the PES/GO membrane may take more water molecules and therefore increase the water uptake capacity.81,82
For the porosity of PES/GO MMW membranes, as the GO NSs wt% ratio increased from zero to 0.01% (SG3), the porosity increased from 40% to 62% and then decreased to 54% for 0.1 GO wt% (SG6). This suggests that SG3 (0.01 GO NSs wt%) has the largest porosity, which enhances the internal structure of the membrane, increasing its properties and perhaps leading to increased directional flow rates across the SG3 membrane.83,84 When loaded GO NSs more than 0.01 wt percent, the agglomerated internal structures that extended from the top surface to the bottom surface of the membrane to generate layer structure (Fig. 4) are responsible for the decrease in porosity.
3.2.3.3 Membrane thickness, tortuosity, and S value. As the wt% ratio of GO NSs was raised from 0 to 0.1% for 215 μm total casting thickness, the thickness of manufactured PES/GO MMW FO membranes was increased from 149 to 167 μm. The rise in membrane thickness is linked to the increase in the viscosity of the GO-doped casting solution. An essential feature of nanofiller addition in polymeric solution is raising the viscosity of the solution owing to the increase of the GO NSs wt% loading.58,85 Based on the characteristics of fabricated membranes in Table 3, the tortuosity (τ) of the membrane substrate was estimated. The tortuosity values of bare PES, PES/0.01%GO MMW, and HTI CTA membrane were 6.4, 3.0, and 4.75, respectively. The low tortuosity value of PES/0.01% GO MMW membrane is attributed to the larger open area of mesh woven fabric, which allows the polymer to permeate the substrate's bottom layer and form open pores, as seen in SEM images (Fig. 4).75
Table 4 compares our optimized membrane to three cellulosic commercials woven FO membranes in terms of S value and tortuosity.75,85,86 In FO studies, the S value has been widely used to express the degree of ICP effects of the substrate.75 Eqn (4) clarifies the relationship between the structural parameter, porosity, and tortuosity. The SG3 MMW FO membrane has low tortuosity and high porosity due to its sponge-like structure, resulting in a small S value of 149 μm when compared to the commercial membranes. The smallest S value for SG3 resulted in the ICP impact being minimized and FO performance being improved. Because of the use of a woven mesh with a wide-open area, water flow is facilitated, as seen by the membrane substrates' decreased tortuosity (τ = 3), increased porosity, and wettability.87,88 As a result, the SG3 membrane is projected to outperform several commercial membranes in FO applications, including the CTA membrane, as demonstrated in Table 4.
3.3. Membrane performance
| Membrane ID | Membrane total casting thickness | |||||||
|---|---|---|---|---|---|---|---|---|
| 215 μm | 265 μm | |||||||
| Flux (Jw) LMH | Reverse (Js) GMH | Js/Jw (g L−1) | Salt rejection% | Flux (Jw) LMH | Reverse (Js) GMH | Js/Jw (g L−1) | Salt rejection% | |
| Bare PES | 60.0 | 25.9 | 0.43 | 53 ± 1.5 | 32 | 7.5 | 0.23 | 85 ± 2.5 |
| SG1 | 83.0 | 2.0 | 0.024 | 94 ± 2.8 | 43 | 0.21 | 0.0048 | 98.5 ± 2.9 |
| SG2 | 99.7 | 0.22 | 0.0022 | 98 ± 2.4 | 51 | 0.18 | 0.0035 | 98.7 ± 2.9 |
| SG3 | 114.7 | 0.03 | 0.00026 | 99 ± 2.9 | 65 | 0.025 | 0.00038 | 99.5 ± 3 |
| SG4 | 70.0 | 0.04 | 0.00057 | 98.8 ± 2.9 | 58 | 0.05 | 0.00086 | 98.8 ± 2.9 |
| SG5 | 45.0 | 0.93 | 0.02 | 96.2 ± 2.8 | — | — | — | — |
| SG6 | 41.8 | 0.92 | 0.022 | 95.7 ± 2.9 | — | — | — | — |
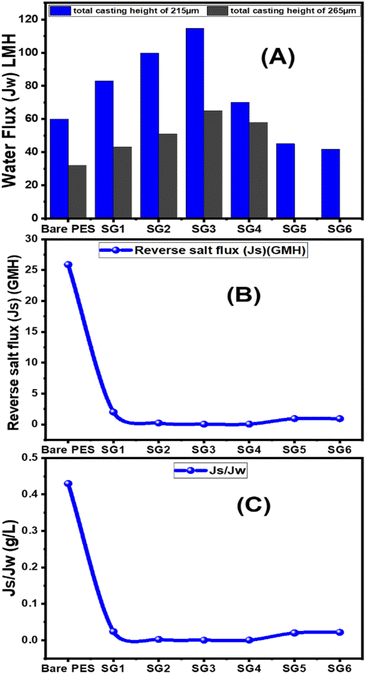
From Fig. 6(A), for 215 μm total casting height, the water flux increased from 60 LMH to 114.7 LMH by increasing GO NSs wt% ratio from zero to 0.01 wt%. After that, the water flux decreases to 70 LMH and 41.8 LMH at 0.04 and 0.1 GO NSs wt% ratio, respectively. At 265 μm total casting thickness, the water flux increased from 32 LMH to 65 LMH by increasing the wt% ratio of GO NSs from zero to 0.01 wt% then water flux decreased to 58 LMH at 0.04 GO NSs wt% ratio. Many factors contributed to the increase in water flow when the GO NSs wt percent ratio was increased: incorporation of GO NSs layers distributed the polymer backbone chain, and the presence of OH groups increased the hydrophilicity of the PES/GO MMW surface. The overall porosity and water flow increase as the loaded GO NSs reach 0.01 wt percent ratio (SG3), owing to a decrease in the S value, which minimizes the internal concentration polarization ICP.81,82,89,90 But, for loading GO NSs higher than 0.01 wt% ratio, the water flux decreased. This may be attributed to the agglomeration of GO NSs on the surface of the PES membrane.25,91,92 According to these results, the optimum total casting height has been chosen to be 215 μm for further FO performance study.
The effect of GO NSs wt% ratio on the reverse salt flux (Js) and Jw/Js for the prepared membranes using 215 μm total casting thickness are estimated and plotted in Fig. 6(B and C). The minimum reveres salt flux (Js) of 0.03 GMH was obtained at a 0.01 wt% ratio GO NSs as compared with pristine PES membrane 25.9 GMH. Then, any further increase in GO NSs wt% ratio is accompanied by increasing in Js to reach a maximum of 0.9 GMH at a higher GO NSs of 0.08 and 0.1 wt% ratio due to the increase in pore size as shown from SEM analysis. The SRSF (Js/Jw) is often used as a more reliable parameter for evaluating the properties of the FO membranes to reverse the diffusion of draw solutes. This ratio is applied to measure the volume of draw solute loss per unit of water passed through the membrane. Lower Js/Jw is desirable to prevent the loss of draw solutes in FO and help to minimize ICP.93 Js/Jw of PES/GO WMM FO membranes prepared are decreased with increasing GO NSs from 0.004 to 0.01 wt% ratio, then there are slightly increase of (Js/Jw) with increasing GO NSs from 0.08 to 0.1 wt% ratio. The lower SRSF values are essential for the FO membranes as this means a reduction in the loss of draw solutes from the process which has both economic and environmental implications. The lower SRSF data shows that GO NSs incorporation within the substrate could significantly enhance the water flux and ion selectivity (higher water flux and lower RSF) thereby lowering the SRSF PES/GO MMW of the membranes.22
The mechanical properties of the membranes were also strengthened by the incorporation of GO nanosheets. The mechanical properties measurements show that PES/GO MMW FO membrane has a tensile strength of 45 MPa, which is higher than the strength of the commercial CTA woven FO membrane, which is 35.8 MPa. The elongation% was 19% and 37.8% for PES/GO MMW and the commercial CTA woven FO membranes, respectively. The tensile strength increases once the GO nanosheets are applied, going from 12 MPa for PES to about 45 MPa for the PES/GO MMW membrane. The incorporation of hydrophilic inorganic nano-sheets, like GO, can improve the surface hydrophilicity, thermal and mechanical stability, and antifouling property of hybrid membranes, according to research by Zhu et al.97 This is because GO has an exceptional ability to combine the processability of the polymer with the superior properties of the 2D materials. The antifouling and subsequent permeation capabilities of PES are improved by GO nano-sheet blending at 0.01 percent (as demonstrated by hydrophilicity, water uptake rate, contact angle, reduced S structure, and lower ICP), which extends the membrane's lifespan and lowers its operational costs.98–100 Incorporation of GO for membrane preparation could be therefore a promising alternative for improving substrate properties of the PES/GO MMW membranes due to the formation of double skin layer membrane.
4. Conclusion
Graphene oxide nanosheets (GO NSs) produced utilizing a modified Hummer's technique were characterized using SEM, TEM, EDX, XRD, and Raman. By introducing different wt% ratios of GO NSs (zero to 0.1 wt%) into the polyethersulfone (PES)/matrix, mixed matrix woven forward osmosis (MMWFO) membranes were produced using the phase inversion method. Water contact angle, hydrophilicity, porosity, tortuosity, function groups, chemical and crystallographic structures, nanomorphologies, and surface roughness of the produced PES/GO MMWFO membranes have been investigated. The produced PES/GO FO membranes were assessed in terms of pure water flux (Jw), reverse salt flux (Js), and salt rejection for water desalination. With the addition of GO NSs, the hydrophilicity and porosity of the FO membrane improved, as did water permeability due to the creation of numerous skin-layer structures with increased GO NSs loading. The water contact angle is decreased to 55° by increasing the GO NSs wt% to 0.1%, whereas the highest porosity reached 62% at 0.01%. These GO NSs create shortcut paths for water molecules to travel through, reducing support layer tortuosity by three times, lowering structural characteristics of the support layer, and diminishing internal concentration polarization (ICP). For bare PES, the values of Jw, Js, and RS were 60 LMH, 25.9 GMH, and 53%, respectively. With the highest Jw (114.7 LMH), lowest Js (0.03 GMH), and lowest specific reverse solute flux (Js/Jw = 0.00026 g L−1), as well as a more favorable structural parameter (S = 148 m), the PES/0.01 wt% GO MMWFO membrane with a total casting thickness of 215 μm and 1 M NaCl concentration had the best performance. Under ideal FO circumstances, the performance of our improved membrane outperforms that of the control woven commercial cellulose triacetate (CTA) FO membrane. Jw grew from 105 to 127 LMH as the NaCl concentration increased from 0.6 to 2 M, which is substantially greater than the commercial Jw (7.2 to 15 LMH). The SR of our FO membranes is 99.2%@0.65 M NaCl, which is much higher than that of the CTA membrane.Author contributions
Conceptualization, M. N., N. A., S. S. A., H. M. A. and M. S.; methodology, M. N., N. A., S. S. A. and M. S.; validation, M. N., S. S. A., H. M. A., and M. S.; formal analysis, M. N., N. A., S. S. A., and M. S.; investigation, M. N., S. S. A., and M. S.; resources, M. N., N. A., S. S. A., and M. S.; data curation, M. N., H. M. A. and M. S.; writing—original draft preparation, M. N., S. S. A., and M. S.; writing—review and editing, M. N., N. A., S. S. A., and M. S.; visualization, M. N., N. A., S. S. A., H. M. A., and M. S.; project administration, N. A. M. N. and M. S.; funding acquisition, M. N., N. A., and M. S. All authors have read and agreed to the published version of the manuscript.Conflicts of interest
The authors declare no conflict of interest.Acknowledgements
Princess Nourah bint Abdulrahman University Researchers Supporting Project number (PNURSP2022R291), Princess Nourah bint Abdulrahman University, Riyadh, Saudi Arabia. Additionally, this research received external funding from the Egyptian Academy of Scientific Research and Technology, which partially supported this work (ASRT/SNG/W/2018-10). The authors express their gratitude to Princess Nourah bint Abdulrahman University Researchers Supporting Project number (PNURSP2022R291), Princess Nourah bint Abdulrahman University, Riyadh, Saudi Arabia. Additionally, the authors gratefully acknowledge the financial support from the Egyptian Academy of Scientific research and Technology, which partially supported this work (ASRT/SNG/W/2018-10).Notes and references
- M. Shaban, A. M. Ashraf, H. AbdAllah and H. M. Abd El-Salam, Desalination, 2018, 444, 129–141 CrossRef CAS.
- A. Krell and H. Ma, J. Am. Ceram. Soc., 2003, 86, 241–246 CrossRef CAS.
- M. R. Bilad, E. Guillen-Burrieza, M. O. Mavukkandy, F. A. Al Marzooqi and H. A. Arafat, Desalination, 2015, 376, 62–72 CrossRef CAS.
- K. Y. Wang, T. Matsuura, T. S. Chung and W. F. Guo, J. Membr. Sci., 2004, 240, 67–79 CrossRef CAS.
- U. K. Garg, M. P. Kaur, D. Sud and V. K. Garg, Desalination, 2009, 249, 475–479 CrossRef CAS.
- M. Pinelo, G. Jonsson and A. S. Meyer, Sep. Purif. Technol., 2009, 70, 1–11 CrossRef CAS.
- M. G. Khedr, Desalination, 2003, 153, 295–304 CrossRef CAS.
- S. Yang, Q. Zou, T. Wang and L. Zhang, J. Membr. Sci., 2019, 569, 48–59 CrossRef CAS.
- R. Mahendran, R. Malaisamy and D. R. Mohan, Polym. Adv. Technol., 2004, 15, 149–157 CrossRef CAS.
- M. S. Shalaby, H. Abdallah, A. Cenian, G. Sołowski, M. Sawczak, A. M. Shaban and R. Ramadan, Sep. Purif. Technol., 2020, 247, 116994 CrossRef CAS.
- M. Shaban, H. AbdAllah, L. Said, H. S. Hamdy and A. Abdel Khalek, Chem. Eng. Res. Des., 2015, 95, 307–316 CrossRef CAS.
- F. Valentini, A. Calcaterra, V. Ruggiero, D. Giacobbe and M. Botta, JSM Nanotechnol. Nanomed., 2018, 6, 1060 Search PubMed.
- Q. Saren, C. Q. Qiu and C. Y. Tang, Environ. Sci. Technol., 2011, 45, 5201–5208 CrossRef CAS PubMed.
- W. L. Ang, A. Wahab Mohammad, D. Johnson and N. Hilal, J. Water Proc. Eng., 2019, 31, 100886 CrossRef.
- K. Lutchmiah, L. Lauber, K. Roest, D. J. H. Harmsen, J. W. Post, L. C. Rietveld, J. B. van Lier and E. R. Cornelissen, J. Membr. Sci., 2014, 460, 82–90 CrossRef CAS.
- A. J. Ansari, F. I. Hai, W. Guo, H. H. Ngo, W. E. Price and L. D. Nghiem, Bioresour. Technol., 2015, 191, 30–36 CrossRef CAS PubMed.
- A. Altaee and A. Sharif, Desalination, 2015, 356, 31–46 CrossRef CAS.
- A. Achilli, T. Y. Cath and A. E. Childress, J. Membr. Sci., 2009, 343, 42–52 CrossRef CAS.
- X. Li, S. Chou, R. Wang, L. Shi, W. Fang, G. Chaitra, C. Y. Tang, J. Torres, X. Hu and A. G. Fane, J. Membr. Sci., 2015, 494, 68–77 CrossRef CAS.
- E. M. Garcia-Castello and J. R. McCutcheon, J. Membr. Sci., 2011, 372, 97–101 CrossRef CAS.
- D. L. Shaffer, J. R. Werber, H. Jaramillo, S. Lin and M. Elimelech, Desalination, 2015, 356, 271–284 CrossRef CAS.
- M. J. Park, S. Phuntsho, T. He, G. M. Nisola, L. D. Tijing, X. M. Li, G. Chen, W. J. Chung and H. K. Shon, J. Membr. Sci., 2015, 493, 496–507 CrossRef CAS.
- M. Shatat and S. B. Riffat, Int. J. Low-Carbon Technol., 2014, 9, 1–19 CrossRef.
- E. Ali, J. Orfi, A. Najib and J. Saleh, PLoS One, 2018, 13(10), e0205012 CrossRef PubMed.
- T. Sirinupong, W. Youravong, D. Tirawat, W. J. Lau, G. S. Lai and A. F. Ismail, Arabian J. Chem., 2018, 11, 1144–1153 CrossRef CAS.
- B. Kim, G. Gwak and S. Hong, Desalination, 2017, 422, 5–16 CrossRef CAS.
- R. K. McGovern and J. H. Lienhard V, J. Membr. Sci., 2014, 469, 245–250 CrossRef CAS.
- W. A. Suwaileh, D. J. Johnson, S. Sarp and N. Hilal, Desalination, 2018, 436, 176–201 CrossRef CAS.
- S. Phuntsho, H. K. Shon, T. Majeed, I. El Saliby, S. Vigneswaran, J. Kandasamy, S. Hong and S. Lee, Environ. Sci. Technol., 2012, 46, 4567–4575 CrossRef CAS PubMed.
- P. Xiao, L. D. Nghiem, Y. Yin, X. M. Li, M. Zhang, G. Chen, J. Song and T. He, J. Membr. Sci., 2015, 481, 106–114 CrossRef CAS.
- M. J. Park, S. Phuntsho, T. He, G. M. Nisola, L. D. Tijing, X. M. Li, G. Chen, W. J. Chung and H. K. Shon, J. Membr. Sci., 2015, 493, 496–507 CrossRef CAS.
- G. Chen, Z. Wang, L. D. Nghiem, X. M. Li, M. Xie, B. Zhao, M. Zhang, J. Song and T. He, Desalination, 2015, 366, 113–120 CrossRef CAS.
- H. Li, Y. Gao, Y. Shao, Y. Su and X. Wang, Nano Lett., 2015, 15, 6689–6695 CrossRef CAS PubMed.
- J. Deng, X. Liu, L. Ma, C. Cheng, W. Shi, C. Nie and C. Zhao, ACS Appl. Mater. Interfaces, 2014, 6, 21603–21614 CrossRef CAS.
- W. Suwaileh, N. Pathak, H. Shon and N. Hilal, Desalination, 2020, 485, 114455 CrossRef CAS.
- S. Zhao, Z. Wang, J. Wang, S. Yang and S. Wang, J. Membr. Sci., 2011, 376, 83–95 CrossRef CAS.
- J. Su and T. S. Chung, J. Membr. Sci., 2011, 376, 214–224 CrossRef CAS.
- C. Klaysom, T. Y. Cath, T. Depuydt and I. F. J. Vankelecom, Chem. Soc. Rev., 2013, 42, 6959–6989 RSC.
- A. Tiraferri, N. Y. Yip, W. A. Phillip, J. D. Schiffman and M. Elimelech, J. Membr. Sci., 2011, 367, 340–352 CrossRef CAS.
- M. Shaban, A. M. Ashraf, H. AbdAllah and H. M. Abd El-Salam, Desalination, 2018, 444, 129–141 CrossRef CAS.
- M. Sadrzadeh, M. Rezakazemi and T. Mohammadi, Transp. Prop. Polym. Membr., 2018, 391–423 CAS.
- A. F. Ismail, Compr. Membr. Sci. Eng., 2010, 1, 275–290 CAS.
- W. Salim and W. S. W. Ho, Curr. Opin. Chem. Eng., DOI:10.1016/j.coche.2015.03.003.
- D. Emadzadeh, W. J. Lau, T. Matsuura, M. Rahbari-Sisakht and A. F. Ismail, Chem. Eng. J., 2014, 237, 70–80 CrossRef CAS.
- N. Akther, S. Phuntsho, Y. Chen, N. Gha and H. Kyong, J. Membr. Sci., 2019, 584, 20–45 CrossRef CAS.
- Y. Wang, R. Ou, H. Wang and T. Xu, J. Membr. Sci., 2015, 475, 281–289 CrossRef CAS.
- X. Chang, Z. Wang, S. Quan, Y. Xu, Z. Jiang and L. Shao, Appl. Surf. Sci., 2014, 316, 537–548 CrossRef CAS.
- R. A. Milescu, C. R. McElroy, T. J. Farmer, P. M. Williams, M. J. Walters and J. H. Clark, Adv. Polym. Technol., 2019, 2019, 9692859 CrossRef.
- S. Wu, Y. Cheng, J. Ma, Q. Huang, Y. Dong, J. Duan, D. Mo, Y. Sun, J. Liu and H. Yao, J. Membr. Sci., 2021, 635, 119467 CrossRef CAS.
- C. Zhao, J. Xue, F. Ran and S. Sun, Prog. Mater. Sci., 2013, 58, 76–150 CrossRef CAS.
- J. F. Blanco, J. Sublet, Q. T. Nguyen and P. Schaetzel, J. Membr. Sci., 2006, 283, 27–37 CrossRef CAS.
- M. Shaban, A. M. Ashraf, H. Abdallah and H. M. A. El-salam, Desalination, 2018, 1 Search PubMed.
- M. Amini, M. Jahanshahi and A. Rahimpour, J. Membr. Sci., 2013, 435, 233–241 CrossRef CAS.
- S. Sahebi, S. Phuntsho, L. Tijing, G. Han, D. S. Han, A. Abdel-Wahab and H. K. Shon, Desalination, 2017, 406, 98–108 CrossRef CAS.
- R. R. Gonzales, M. J. Park, T. H. Bae, Y. Yang, A. Abdel-Wahab, S. Phuntsho and H. K. Shon, Desalination, 2019, 459, 10–19 CrossRef CAS.
- L. Zhao, Y. Huang, B. Liu, Y. Huang, A. Song, Y. Lin, M. Wang, X. Li and H. Cao, Electrochim. Acta, 2018, 278, 1–12 CrossRef CAS.
- A. K. Hołda and I. F. J. Vankelecom, J. Appl. Polym. Sci., 2015, 132, 42130 CrossRef.
- B. Piluharto, V. Suendo, T. Ciptati and C. L. Radiman, Ionics, 2011, 17, 229–238 CrossRef CAS.
- N. Gholami and H. Mahdavi, Adv. Polym. Technol., 2018, 37, 3529–3541 CrossRef CAS.
- V. D. Alves and I. M. Coelhoso, J. Membr. Sci., 2004, 228, 159–167 CrossRef CAS.
- R. Wang, L. Shi, C. Y. Tang, S. Chou, C. Qiu and A. G. Fane, J. Membr. Sci., 2010, 355, 158–167 CrossRef CAS.
- H. M. Ali, H. Gadallah, S. S. Ali, R. Sabry and A. G. Gadallah, Int. J. Chem. Eng., 2016, 2016, 8745943 Search PubMed.
- D. Emadzadeh, W. J. Lau and A. F. Ismail, Desalination, 2013, 330, 90–99 CrossRef CAS.
- S. A. Soomro, I. H. Gul, H. Naseer, S. Marwat and M. Mujahid, Curr. Nanosci., 2018, 15, 420–429 CrossRef.
- M. Zayed, A. M. Ahmed and M. Shaban, Int. J. Hydrogen Energy, 2019, 44, 17630–17648 CrossRef CAS.
- M. Shaban, M. Zayed and H. Hamdy, RSC Adv., 2017, 7, 617–631 RSC.
- R. Siburian, H. Sihotang, S. Lumban Raja, M. Supeno and C. Simanjuntak, Orient. J. Chem., 2018, 34, 182–187 CrossRef CAS.
- L. Yu, Y. Zhang, B. Zhang, J. Liu, H. Zhang and C. Song, J. Membr. Sci., 2013, 447, 452–462 CrossRef CAS.
- J. Bin Wu, M. L. Lin, X. Cong, H. N. Liu and P. H. Tan, Chem. Soc. Rev., 2018, 47, 1822–1873 RSC.
- A. T. Smith, A. M. LaChance, S. Zeng, B. Liu and L. Sun, Nano Mater. Sci., 2019, 1, 31–47 CrossRef.
- L. Yu, Y. Zhang, B. Zhang, J. Liu, H. Zhang and C. Song, J. Membr. Sci., 2013, 447, 452–462 CrossRef CAS.
- B. M. Ganesh, A. M. Isloor and A. F. Ismail, Desalination, 2013, 313, 199–207 CrossRef CAS.
- J. H. Choi, J. Jegal and W. N. Kim, J. Membr. Sci., 2006, 284, 406–415 CrossRef CAS.
- I. M. Wienk, R. M. Boom, M. A. M. Beerlage, A. M. W. Bulte, C. A. Smolders and H. Strathmann, J. Membr. Sci., 1996, 113, 361–371 CrossRef CAS.
- S. Lim, M. J. Park, S. Phuntsho, L. D. Tijing, G. M. Nisola, W.-G. Shim, W.-J. Chung and H. K. Shon, Polymer, 2017, 110, 36–48 CrossRef CAS.
- D. F. Ahmed, H. Isawi, N. A. Badway, A. A. Elbayaa and H. Shawky, Arabian J. Chem., 2021, 14, 102995 CrossRef CAS.
- A. A. Shamsuri, S. N. A. M. Jamil and K. Abdan, Process, 2021, 9, 480 CrossRef CAS.
- A. M. Alosaimi, Polymers, 2021, 13(16), 2792 CrossRef CAS PubMed.
- A. Alkhouzaam and H. Qiblawey, J. Water Proc. Eng., 2021, 42, 102120 CrossRef.
- R. J. Kadhim, F. H. Al-Ani, M. Al-Shaeli, Q. F. Alsalhy and A. Figoli, Membr, 2020, 10, 366 CrossRef CAS.
- Z. Li, Y. Wang, M. Han, D. Wang, S. Han, Z. Liu, N. Zhou, R. Shang and C. Xie, Front. Chem., 2020, 7, 1–12 RSC.
- I. Khan, K. Saeed and I. Khan, Arabian J. Chem., 2019, 12, 908–931 CrossRef CAS.
- Z. Li, Y. Wang, M. Han, D. Wang, S. Han, Z. Liu, N. Zhou, R. Shang and C. Xie, Front. Chem., 2020, 7, 1–12 RSC.
- H. G. Lemos, R. A. Ragio, A. C. S. Conceição, E. C. Venancio, J. C. Mierzwa and E. L. Subtil, Chem. Eng. J., 2021, 425, 131772 CrossRef CAS.
- M. Amini, M. Jahanshahi and A. Rahimpour, J. Membr. Sci., 2013, 435, 233–241 CrossRef CAS.
- C. S. Lin, K. L. Tung, Y. L. Lin, C. Di Dong, C. W. Chen and C. H. Wu, Process Saf. Environ. Prot., 2020, 144, 225–235 CrossRef CAS.
- D. Emadzadeh, W. J. Lau, T. Matsuura, A. F. Ismail and M. Rahbari-Sisakht, J. Membr. Sci., 2014, 449, 74–85 CrossRef CAS.
- Q. Liu, L. Li, X. Jin, C. Wang and T. Wang, J. Mater. Sci., 2018, 53, 6505–6518 CrossRef CAS.
- G. R. Xu, X. Y. Liu, J. M. Xu, L. Li, H. C. Su, H. L. Zhao and H. J. Feng, Appl. Surf. Sci., 2018, 434, 573–581 CrossRef CAS.
- A. Marjani, A. T. Nakhjiri, M. Adimi, H. F. Jirandehi and S. Shirazian, Sci. Rep., 2020, 10, 1–11 CrossRef PubMed.
- W. Zhao, J. Huang, B. Fang, S. Nie, N. Yi, B. Su, H. Li and C. Zhao, J. Membr. Sci., 2011, 369, 258–266 CrossRef CAS.
- R. Rezaee, S. Nasseri, A. H. Mahvi, R. Nabizadeh, S. A. Mousavi, A. Rashidi, A. Jafari and S. Nazmara, J. Environ. Health Sci. Eng., 2015, 13, 61 CrossRef.
- W. A. Phillip, J. S. Yong and M. Elimelech, Environ. Sci. Technol., 2010, 44, 5170–5176 CrossRef CAS PubMed.
- E. Arkhangelsky, F. Wicaksana, S. Chou, A. A. Al-Rabiah, S. M. Al-Zahrani and R. Wang, J. Membr. Sci., 2012, 415–416, 101–108 CrossRef CAS.
- Q. Yang, J. Lei, D. D. Sun and D. Chen, Sep. Purif. Rev., 2016, 45, 93–107 CrossRef CAS.
- N. L. Le and S. P. Nunes, Sustainable Mater. Technol., 2016, 7, 1–28 CrossRef CAS.
- J. Zhu, J. Hou, A. Uliana, Y. Zhang, M. Tiana and B. V. der Bruggen, J. Mater. Chem. A, 2018, 6, 3773–3792 RSC.
- M. H. Zadeh, H. Mighani and A. Shakeri, J. Polym. Res., 2022, 29, 169 CrossRef.
- J.-N. Shen, H.-M. Ruan, L.-G. Wu and C.-J. Gao, Chem. Eng. J., 2011, 168, 1272–1278 CrossRef CAS.
- X. Shi, G. Tal, N. P. Hankins and V. Gitis, J. Water Proc. Eng., 2014, 1, 121–138 CrossRef.
- J. R. McCutcheon and M. Elimelech, J. Membr. Sci., 2008, 318, 458–466 CrossRef CAS.
Footnote |
| † Electronic supplementary information (ESI) available. See https://doi.org/10.1039/d2ra03832c |
| This journal is © The Royal Society of Chemistry 2022 |

