 Open Access Article
RamanNet: a lightweight convolutional neural network for bacterial identification based on Raman spectra
Bo Zhou ab,
Yu-Kai Tong
 b,
Ru Zhang*a and
Anpei Ye*b
aSchool of Science, Beijing University of Posts and Telecommunications, Beijing 100876, China. E-mail: ruzhang@bupt.edu.cn
bKey Laboratory for the Physics and Chemistry of Nanodevices, School of Electronics, Peking University, Beijing 100871, China. E-mail: yap@pku.edu.cn
First published on 16th September 2022
Abstract
Raman spectroscopy combined convolutional neural network (CNN) enables rapid and accurate identification of the species of bacteria. However, the existing CNN requires a complex hyperparameters model design. Herein, we propose a new simple network architecture with less hyperparameter design and low computation cost, RamanNet, for rapid and accurate identifying of bacteria at the species level based on its Raman spectra. We verified that compared with the previous CNN methods, the RamanNet reached comparable results on the Bacteria-ID Raman spectral dataset and PKU-bacterial Raman spectral datasets, but using only about 1/45 and 1/297 network parameters, respectively. RamanNet achieved an average isolate-level accuracy of 84.7 ± 0.3%, antibiotic treatment identification accuracy of 97.1 ± 0.3%, and distinguished accuracy of 81.6 ± 0.9% for methicillin-resistant and -susceptible Staphylococcus aureus (MRSA and MSSA) on the Bacteria-ID dataset, respectively. Moreover, it achieved an average accuracy of 96.04% on the PKU-bacterial dataset. The RamanNet model benefited from fewer model parameters that can be quickly trained even using CPU. Therefore, our method has the potential to rapidly and accurately identify bacterial species based on their Raman spectra and can be easily extended to other classification tasks based on Raman spectra.
1. Introduction
Rapid and accurate identification of pathogenic bacteria is critical in hospitals and epidemic situations. Nucleic acid assays and immunological methods are common methods for identifying bacteria. Among them, the widely used methods are enzyme-linked immunosorbent assay (ELISA)1,2 and polymerase chain reaction (PCR),3 which have high sensitivity and specificity. However, these methods require complex sample pre-treatment, expensive reagents, time-consuming bacterial culture, and DNA/RNA amplification. Also, some bacteria are difficult to grow under laboratory conditions. Matrix-assisted laser desorption/ionization time-of-flight mass spectrometry (MALDI-TOF)4–6 is another rapidly developing technology that can identify bacteria by their peptide mass fingerprints. Although the above methods are well developed and trusted, extracting protein, RNA, or DNA is destructive to cells, limiting further multimodal analysis for the same cell. Therefore, a rapid and non-destructive bacterial identification strategy is needed.Raman spectroscopy enables the identification of bacteria in a fast, non-destructive and label-free manner.7–11 The technology allows for the analysis of the molecular structure and chemical composition of substances, thus leading to significant progress in classifying components of complex mixtures.12,13 Different components in bacterial cells will produce unique spectral fingerprints on Raman spectra, and we can identify different bacteria based on these unique Raman fingerprints. Overall, Raman spectroscopy has significant potential to identify bacteria at the species level or the level of antibiotic resistance.10,14 In recent years, the use of neural networks to automatically feature Raman spectra has significantly improved the identification accuracy of pathogenic bacteria compared to traditional machine learning algorithms.8,9,15
To improve the classification accuracy of convolutional neural network (CNN) for bacterial Raman spectra, many attempts have focused on using dozens of filters,14,16–18 increasing the depth of the network,14,16 and adopting more advanced classification algorithm models, which were mainly used in the optimization methods of the image classification field. These methods often result in longer training times and more complex hyperparameter designs for neural networks. However, a common but significant problem has not been resolved, that is, the existing CNN is not explicitly designed for Raman spectra data, so we may not fully exploit the advantages of CNNs. In previous studies, state-of-the-art CNN techniques from image classification, such as residual network (ResNet), were used to classify low signal-to-noise ratio (SNR) Raman spectra data.14 Ho et al. used dozens of filters in the 26-layer CNN to achieve average isolate-level accuracies exceeding 82%. Maruthamuthu. et al.16 classified 12 microbes Raman spectra with an accuracy exceeding 95% using 18-layers ResNet with hundreds of filters in each layer. Liu et al.20 explored the rapid identification of 13 microorganisms by single-cell Raman spectroscopy (scRS) and achieved an average accuracy of 88.5 ± 4% using a 3-layers one-dimensional convolutional neural network (1DCNN) with dozens of convolution kernels. In fact, Raman spectra, as one-dimensional sequences without depth, are much simpler than images (multi-dimensional matrices). Therefore, such a complex network structure may not be required for identifying bacterial Raman spectroscopy at species-level accuracy. Through extensive experiments, we demonstrated that for bacterial Raman spectra, two or three convolutional layers with one filter per convolutional layer in a CNN are sufficient to achieve fast and high accurate identification at the species-level.
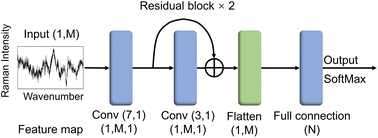
Herein, we proposed a novel and simple CNN model named RamanNet for rapid and accurate identifying bacteria at the species-level based on bacterial scRS. The RamanNet consists of an initial convolution layer followed by two residual layers, a flatten layer, and a final fully classification layer, and each convolutional layer contains only one filter. We validated the performance of RamanNet on both the Bacteria-ID dataset and PKU-bacterial dataset. RamanNet achieved an average isolate-level accuracy of 84.7 ± 0.3% and an accuracy of antibiotic treatment identification of 97.1 ± 0.3% on the Bacteria-ID dataset. Moreover, RamanNet has 296.9 times fewer parameters compared with ResNet but achieved a comparable classification accuracy of 96.04% on the PKU-bacterial dataset. Due to the optimization of the RamanNet structure, we can rapidly train the model using only CPU rather than GPU. We believe this research would provide guidance and reference for bacterial Raman spectral analysis using convolutional neural networks.
2. Materials and methods
First, we briefly introduce two bacterial Raman datasets used in this paper in Section 2.1. Next, the structure of RamanNet is presented in Section 2.2. Then the experimental design of RamanNet will be described in Section 2.3.2.1 Two bacterial Raman dataset
| Spectral number | Measure time (s) | Isolates classes | |
|---|---|---|---|
| Reference | 60![[thin space (1/6-em)]](https://www.rsc.org/images/entities/char_2009.gif) 000 000 |
1 | 30 |
| Fine-tune | 3000 | 2 | 30 |
| Test | 3000 | 2 | 30 |
The wavenumber range of the spectra in all three datasets ranged from 381.98 to 1792.4 cm−1. The spectral integration time in reference, fine-tuning, and test subsets are 1 s, 2 s, and 2 s, respectively. To keep the SNR (SNR = 4.1) consistent across datasets, for fine-tuning and test subsets, the integration time was increased from 1 s to 2 s due to the debasement of the optical system efficiency. The full isolate information and specific Raman experiment process obtained from the dataset were described in ref. 14, and the entire dataset was downloaded from https://github.com/csho33/bacteria-ID/.
The raw data of each scRS was pre-processed using homemade code, developed based on MATLAB (2021b) as follows: removing cosmic ray by median filtering, subtracting system background using polynomial baseline correction, smoothing with five-point smoothing, and normalizing by area. The normalized spectral data in the PKU-bacterial dataset has higher SNR than the Bacteria-ID dataset due to longer spectral integration time, exemplified by S. epidermidis (Fig. 1). The dimension of all spectra in this dataset is 861.
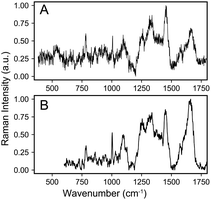 | ||
| Fig. 1 A randomly selected spectrum of S. epidermidis from (A) Bacteria-ID dataset and (B) PKU-bacterial dataset. It can be seen that the SNR of the latter is higher than that of the former. | ||
The details of the bacterial single-cell Raman spectroscopy measurement, data pre-processing, and data augmentation strategy were described in ref. 15.
2.2 Construction of RamanNet model
ResNet has enabled remarkable achievements in computer vision tasks. Compared to pictures with three-channel, machine vision (CV) commonly applied objects, the Raman spectrum is only one channel of digital sequence, and its data form is relatively simple. Given this characteristic of the Raman spectra, we simplified the classic ResNet19 structure and designed RamanNet.The RamanNet consists of an initial convolution layer followed by two residual layers, a flatten layer, and a final fully connected classification layer (Fig. 2). Each residual layer contains a shortcut connection between the input and output of one convolutional layer, allowing for better gradient propagation and stable training.19 The convolution kernel numbers of all convolutional layers are set to 1. The size of the convolution kernel is 7 and 3, respectively. This simple model reduces traditional CNN's computational complexity so that it can be successfully trained on the Bacteria-ID dataset within 20 minutes, even on the CPU (Table 3). We adopted kaiming normal initialization21 and a “categorical_crossentropy” loss function. These architecture hyperparameters were selected via grid search using one training and validation split on the 30-isolates classification task.
| Model | Accuracy | Parameters (mega) | Computation parameters (MACs) | ||
|---|---|---|---|---|---|
| 30-Isolates task | 8-Treatments task | MRSA/MSSA | |||
| RamanNet | 84.7 ± 0.3% | 97.1 ± 0.3% | 81.6 ± 0.9% | 0.030 | 0.03 M |
| ResNet14 | 82.2 ± 0.3% | 97.0 ± 0.3% | 89.1 ± 0.1% | 1.341 | 395 M |
| Calculating unit | Pretraining (min) | Finetuning (min) | Prediction(s) |
|---|---|---|---|
| CPU (Intel i7-8700) | 16.7 | 2.7 | 7.6 |
| GPU (NVIDIA GeForce GTX 1080) | 14.8 | 2.4 | 7.3 |
2.3 Bacterial identification based on RamanNet and Raman spectra
![[thin space (1/6-em)]](https://www.rsc.org/images/entities/char_2009.gif) :
:![[thin space (1/6-em)]](https://www.rsc.org/images/entities/char_2009.gif) 1 as training and validation split, then trained the RamanNet on the training split and validated its accuracy on the validation split in order to perform model selection, thus five fine-tuned models were obtained. Finally, we evaluate and report the average test accuracy of these five fine-tuned models on the test subset gathered from independently cultured and prepared samples. In addition, the receiver operating characteristic (ROC) curve was used to verify the practicality of the ResNet model by plotting the true positive rate (TPR, sensitivity) versus the false-positive rate (FPR, 1-specificity) (Fig. 4).
1 as training and validation split, then trained the RamanNet on the training split and validated its accuracy on the validation split in order to perform model selection, thus five fine-tuned models were obtained. Finally, we evaluate and report the average test accuracy of these five fine-tuned models on the test subset gathered from independently cultured and prepared samples. In addition, the receiver operating characteristic (ROC) curve was used to verify the practicality of the ResNet model by plotting the true positive rate (TPR, sensitivity) versus the false-positive rate (FPR, 1-specificity) (Fig. 4).
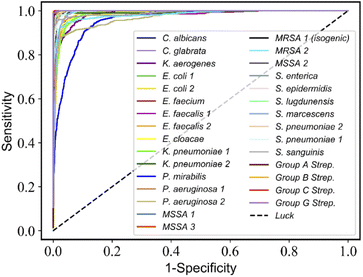 | ||
| Fig. 4 ResNet discriminates the receiver operating characteristic (ROC) curve for 30-isolates Raman spectra. The average AUC values of 30 isolates are more than 0.98. | ||
In this work, we used the stochastic gradient descent (SGD) optimizer with a learning rate of 0.001 and a batch size of 10 to prevent overfitting, and early stopping technology was also used to avoid overfitting. Here pre-training was performed in only ten epochs; the fine-tuning was conducted in only 30 epochs.
![[thin space (1/6-em)]](https://www.rsc.org/images/entities/char_2009.gif) :
:![[thin space (1/6-em)]](https://www.rsc.org/images/entities/char_2009.gif) 1. The training subset is augmented with data, and the validation subset is not augmented. We adopted the following data augmentation strategies: (1) randomly shifted left or right a few wavenumbers, (2) added 1% Gaussian noise to the spectrum for each wavenumber, and (3) linearly combined all spectra from the same bacterial species, the combining coefficients are randomly generated so that we obtained the enhanced training subset for each species.
1. The training subset is augmented with data, and the validation subset is not augmented. We adopted the following data augmentation strategies: (1) randomly shifted left or right a few wavenumbers, (2) added 1% Gaussian noise to the spectrum for each wavenumber, and (3) linearly combined all spectra from the same bacterial species, the combining coefficients are randomly generated so that we obtained the enhanced training subset for each species.
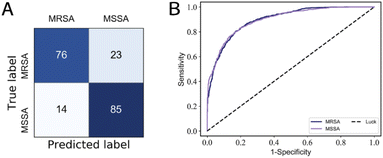 | ||
| Fig. 5 (a) Confusion matrix of MSSA/MRSA; (b) ROC curve of MSSA/MRSA, the average AUC values are 0.90. | ||
These training and validation processes were repeated on the training set five times to optimize the model. Finally, the model with the highest accuracy among the five optimized models acts as the optimal trained model. Subsequently, we evaluated the accuracy of the optimal trained RamanNet model on the test set using the confusion matrix of 15 bacteria (Fig. 6), and the ROC curve (Fig. 7) was reported.
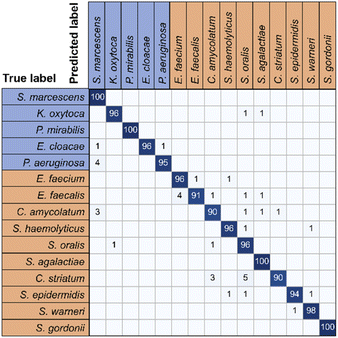 | ||
| Fig. 6 Confusion matrix for 15 bacterial species predicted by RamanNet. Blue represents Gram-negative bacteria, and red represents Gram-positive bacteria. | ||
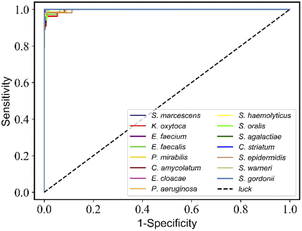 | ||
| Fig. 7 RamanNet discriminates the receiver operating characteristic (ROC) curve for 15 species of bacterial scRS. The average AUC value of 15 species is more than 0.99. | ||
In this experiment, we use the SGD optimizer with a learning rate of 0.001 and a batch size of 6. The training was performed in 500 epochs, and early stopping technology was also used to prevent overfitting. If the accuracy on the validation subset does not rise for 100 consecutive epochs, the training process will end.
3. Results and discussions
3.1 Classification performance of RamanNet on Bacteria-ID dataset
Recently, CNNs have been applied with tremendous success in various computer vision problems.14,24–26 And many deep models from image classification tasks have been directly used for spectral data. However, little work has been done to optimize those networks themselves based on spectral characteristics. In particular, most existing CNN-based Raman spectral classification work just changes the CNN model used for image classification to one-dimensional form and then directly was applied to Raman spectral classification task. Here, the architecture of RamanNet is greatly simplified (see Methods). Unlike previous work, the convolutional layer of RamanNet contains only one convolution kernel, and the feature map has only one channel (Fig. 2). It does not need pooling layers and can preserve the exact locations of spectral peaks,14 thus significantly reducing the computational complexity. Benefiting from fewer model parameters, we demonstrated that RamanNet could be fast trained even using CPU without reducing significant training speed (Table 3).Ibtehaz et al. proposed that the translational invariance of CNNs limits its application in Raman spectral classification, and used shifted multi-layer perceptions to simulate multi-layer convolutional layers to analyze shifted windows of Raman spectra.27 We argue that the translational equivariance is provided by multiple convolutional operations and the global pooling operation. Here our proposed RamanNet only uses two convolutional layers and discards the global pooling operation through a single channel (each convolutional layer has only one convolution kernel), which greatly reduces the translation invariance and the model complexity.
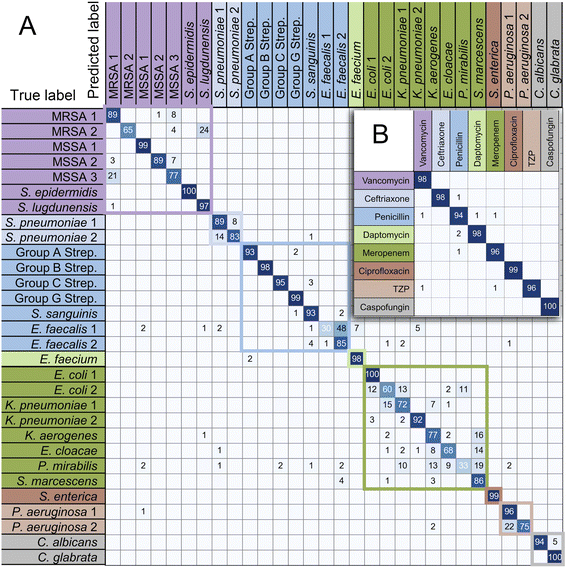
On the 30-class task, the average isolate-level accuracy is 84.7 ± 0.3% (Fig. 3A). Gram-negative bacteria are primarily misclassified as other Gram-negative bacteria; the same is true for Gram-positive bacteria; most misclassifications occur within the same genus. For 30 isolates and MSSA/MRSA, the mean area under the ROC curve (AUC) value was over 0.98 (Fig. 4) and 0.90 (Fig. 5B), respectively.
The 8-empiric-treatments task determines whether the model can provide the correct recommended empiric treatment; here, the accuracy reaches 97.1 ± 0.3% (Fig. 3B).
As shown in Table 2, compared to ResNet,14 RamanNet achieves better accuracy on the 30-isolates task and similar results on the 8-treatments task, while the number of parameters was reduced to 0.030 M parameters (less by 44.7×), and the computational complexity (multiply-accumulate operations, MACs) was significantly reduced to 0.030 M MACs (less by 13![[thin space (1/6-em)]](https://www.rsc.org/images/entities/char_2009.gif) 166.7×). Moreover, the training time of the RamanNet model was less than 20 minutes using CPU rather than GPU (Table 3). While, in distinguishing MRSA/MSSA, the identification accuracy of RamanNet was 81.6 ± 0.9% (Fig. 5A), lower than 89 ± 0.9% of ResNet (Table 2). This would be because they belong to the same species and are highly similar, so RamanNet may need further improvement in identifying bacterial subtypes. In brief, the above results demonstrated that RamanNet could achieve comparable or even better results at the species level than traditional ResNet on large Raman spectral datasets with low SNR. Thus, our model provides a quick and efficient way to analyze the Raman spectra of bacteria; it would be applied in the clinical diagnosis of bacterial diseases.
166.7×). Moreover, the training time of the RamanNet model was less than 20 minutes using CPU rather than GPU (Table 3). While, in distinguishing MRSA/MSSA, the identification accuracy of RamanNet was 81.6 ± 0.9% (Fig. 5A), lower than 89 ± 0.9% of ResNet (Table 2). This would be because they belong to the same species and are highly similar, so RamanNet may need further improvement in identifying bacterial subtypes. In brief, the above results demonstrated that RamanNet could achieve comparable or even better results at the species level than traditional ResNet on large Raman spectral datasets with low SNR. Thus, our model provides a quick and efficient way to analyze the Raman spectra of bacteria; it would be applied in the clinical diagnosis of bacterial diseases.
3.2 Classification performance of RamanNet on PKU-bacterial dataset
For the 15-species bacteria of the PKU-bacterial dataset, the average identification accuracy of RamanNet models on the test set reaches 96.04% (Table 4), which is better than 94.53% of ResNet. From the confusion matrix (Fig. 6), we can see that the identification accuracy was over 93% for the 12 of 15 bacteria and over 89% for 15 of 15 bacteria. Generally, Gram-positive bacteria are misclassified as other Gram-positive bacteria, and Gram-negative bacteria are the same. In addition, the specificity and sensitivity of the RamanNet model were also evaluated by ROC (Fig. 7). For all 15 species, the mean value of AUC (the areas under the ROC curves) is over 0.99.| Model | Accuracy | Parameters (mega) | Computation parameters (MACs) |
|---|---|---|---|
| RamanNet | 96.04% | 0.013 | 0.013 |
| ResNet | 94.53% | 3.86 | 9.64 |
4. Conclusion
In the information age, deep learning of convolutional neural networks is widely used in many fields. Bacterial identification based on Raman spectroscopy is also booming, thanks to the development of artificial intelligence. In this work, we have developed a new simple convolutional network model (RamanNet) with a few model parameters for rapid and accurate classification of the Raman spectrum of a single bacterium. The model has been evaluated on both an open lower SNR bigger bacterial Raman spectral dataset (the Bacteria-ID dataset) and self-developed small but higher SNR bacterial Raman spectral datasets (PKU-bacterial dataset). The results show RamanNet has higher (or comparable) accuracy than the popular ResNet model. Moreover, we can use the CPU to train the RamanNet model and eliminate the limitation of GPU without sacrificing significant speed. Therefore, our model promotes Raman spectroscopy-based bacterial identification and has a potential in other scRS-based Cells classification tasks.Author contributions
Bo Zhou proposed the idea of optimizing the neural network model, trained and optimized models, and led the writing of the manuscript. Anpei Ye funded this research, constructed the optical tweezers system, helped analyze the results, and revised the thesis. Ru Zhang funded this research and oversaw the project with Anpei Ye together. Yu-Kai Tong participated in the discussion of model optimization.Conflicts of interest
There are no conflicts to declare.Acknowledgements
This work was supported by the National Natural Science Foundation of China (NSFC) (U19A2007, 32150026, 92043302, 61671085). Bo Zhou thanks Zheng Li of the Beijing University of Posts and Telecommunications for valuable discussions. We thank Chi-Sing Ho et al. for providing the publicly available Bacterial-ID dataset so that we can use it for algorithm optimization research. We thank Haixia Li and Prof. Liying Sun from Peking University First Hospital for providing clinical bacteria that allowed us to build a single-cell Raman spectral database with high SNR.Notes and references
- B. Swaminathan and P. Feng, Annu. Rev. Microbiol., 1994, 48, 401–426 CrossRef CAS PubMed.
- S. M. Hamlet, in Oral Biology, Springer, 2010, pp. 125–140 Search PubMed.
- K. L. Josephson, C. P. Gerba and I. L. Pepper, Appl. Environ. Microbiol., 1993, 59, 3513–3515 CrossRef CAS PubMed.
- S. S. Han, Y. S. Jeong and S. K. Choi, Microorganisms, 2021, 9, 1917 CrossRef CAS PubMed.
- C. Papagiannopoulou, R. Parchen, P. Rubbens and W. Waegeman, Anal. Chem., 2020, 92, 7523–7531 CrossRef CAS.
- Y. Dai, C. Li, J. Yi, Q. Qin, B. Liu and L. Qiao, Anal. Chem., 2020, 92, 8051–8057 CrossRef CAS.
- J. Dietvorst, L. Vilaplana, N. Uria, M.-P. Marco and X. Muñoz-Berbel, TrAC, Trends Anal. Chem., 2020, 127, 115891 CrossRef CAS.
- J. Zhu, A. S. Sharma, J. Xu, Y. Xu, T. Jiao, Q. Ouyang, H. Li and Q. Chen, Spectrochim. Acta, Part A, 2021, 246, 118994 CrossRef CAS PubMed.
- S. Yan, S. Wang, J. Qiu, M. Li, D. Li, D. Xu, D. Li and Q. Liu, Talanta, 2021, 226, 122195 CrossRef CAS PubMed.
- L. Deng, Y. Zhong, M. Wang, X. Zheng and J. Zhang, IEEE J. Biomed. Health Inform., 2021, 26, 369–378 Search PubMed.
- W. Lu, X. Chen, L. Wang, H. Li and Y. V. Fu, Anal. Chem., 2020, 92, 6288–6296 CrossRef CAS.
- L. Pan, P. Zhang, C. Daengngam, S. Peng and M. Chongcheawchamnan, J. Raman Spectrosc., 2022, 53, 6–19 CrossRef CAS.
- K. Y. Noonan, L. A. Tonge, O. S. Fenton, D. B. Damiano and K. A. Frederick, Appl. Spectrosc., 2009, 63, 742–747 CrossRef CAS.
- C. S. Ho, N. Jean, C. A. Hogan, L. Blackmon, S. S. Jeffrey, M. Holodniy, N. Banaei, A. A. E. Saleh, S. Ermon and J. Dionne, Nat. Commun., 2019, 10, 4927 CrossRef.
- B. Zhou, L. Sun, T. Fang, H. Li, R. Zhang and A. Ye, J. Biophotonics, 2022, e202100312 CAS.
- M. K. Maruthamuthu, A. H. Raffiee, D. M. De Oliveira, A. M. Ardekani and M. S. Verma, Microbiologyopen, 2020, 9, e1122 CrossRef CAS PubMed.
- X. Zhang, J. Xu, J. Yang, L. Chen, H. Zhou, X. Liu, H. Li, T. Lin and Y. Ying, Anal. Chim. Acta, 2020, 1119, 41–51 CrossRef CAS PubMed.
- S. Weng, H. Yuan, X. Zhang, P. Li, L. Zheng, J. Zhao and L. Huang, Analyst, 2020, 145, 4827–4835 RSC.
- K. He, X. Zhang, S. Ren and J. Sun, in Proceedings of the IEEE conference on computer vision and pattern recognition, 2016, pp. 770–778 Search PubMed.
- Y. Liu, J. Xu, Y. Tao, T. Fang, W. Du and A. Ye, Analyst, 2020, 145, 3297–3305 RSC.
- K. He, X. Zhang, S. Ren, J. Sun, IEEE International Conference on Computer Vision, 2015, pp. 1026–1034, DOI:10.1109/iccv.2015.123.
- H. He, S. Yan, D. Lyu, M. Xu, R. Ye, P. Zheng, X. Lu, L. Wang and B. Ren, Anal. Chem., 2021, 93, 3653–3665 CrossRef CAS PubMed.
- P. Pradhan, S. Guo, O. Ryabchykov, J. Popp and T. W. Bocklitz, J. Biophotonics, 2020, 13, e201960186 CrossRef PubMed.
- L. Liu, W. Ouyang, X. Wang, P. Fieguth, J. Chen, X. Liu and M. Pietikäinen, Int. J. Comput. Vis., 2019, 128, 261–318 CrossRef.
- Y. Sun, B. Xue, M. Zhang, G. G. Yen and J. Lv, IEEE Trans. Cybern., 2020, 50, 3840–3854 Search PubMed.
- G. W. Lindsay, J. Cogn. Neurosci., 2021, 33, 2017–2031 CrossRef.
- N. Ibtehaz, M. E. H. Chowdhury, A. Khandakar, S. M. Zughaier, S. Kiranyaz, and M. Sohel Rahman, 2022, arXiv:2201.09737 [cs.LG].
| This journal is © The Royal Society of Chemistry 2022 |

