 Open Access Article
Phase and morphology of calcium carbonate precipitated by rapid mixing in the absence of additives†
Kyungsun Song *,
Jun-Hwan Bang
 ,
Soo-Chun Chae,
Jeongyun Kim and
Seung-Woo Lee
Korea Institute of Geoscience & Mineral Resources (KIGAM), Gwahang-no 124, Yuseong-gu, Daejeon, 34132, Republic of Korea. E-mail: kssong@kigam.re.kr; Tel: +82-42-868-3640
First published on 4th July 2022
Abstract
Calcium carbonate is one of the most common minerals, and its polymorphic formation and transformation pathways from the amorphous to crystalline phases are well documented. However, the effects of locally created pH changes on the preferential formation of amorphous calcium carbonate (ACC) or its crystalline phase remain poorly understood. In this study, the influence of the initial solution pH on the precipitated polymorphs of calcium carbonate was investigated by the rapid mixing of each solution containing calcium or carbonate ions in the absence of additives. The results showed that the amount of recovered ACC particles was associated with the availability of fully deprotonated carbonate ions. A secondary crystalline phase was identified as the vaterite phase, but no polymorphic change to produce the more stable calcite was detected during 5 h of stirring. Interestingly, during the early stage of pouring, the vaterite morphology was dependent on the generated pH range, over which ACC particles were stabilized (pH > 10.3), followed by the hydration–condensation processes. When the pH was sufficiently low (pH < 10.3) for bicarbonate ions to participate in the carbonation reaction, croissant- or cauliflower-like aggregates with layered structures were obtained. In contrast, typical spherical vaterite particles were obtained at a high initial pH when the carbonate ions were dominant. Meanwhile, vaterite particles that were formed in the presence of an excess of carbonate ions were irregular and separate agglomerates. These results elucidate the formation of ACC and the morphologies of the vaterite products.
1. Introduction
Calcium carbonate (CaCO3), one of the most common minerals, is naturally produced during the mineralization of marine organisms over millions of years and constitutes almost 4% of the crust of Earth.1 In addition, CaCO3 is involved in the global carbon cycle, affecting the chemistry of the oceans and the climate on Earth, and its presence is of particular significance in geoscience, such as in the context of biomineralization.2 This mineral is also important in various industrial fields owing to its use as a versatile material in numerous applications, such as cement, paper, food additives, and drug delivery.3,4 Moreover, diverse carbonation processes for the reduction of CO2 gas have been developed at the lab and industrial scales (e.g., mineral carbonation producing carbonated minerals in reactions of divalent cations such as Ca or Mg with CO2 gas or Ca looping utilizing a carbonation–calcination cycle in a twin fluidized bed reactor-based system).5,6Calcium carbonate exists in the forms of various polymorphs, including hydrous amorphous calcium carbonate (ACC) and anhydrous vaterite, aragonite, and calcite; hydrated crystalline phases, such as monohydrocalcite (CaCO3·1H2O) and ikaite (CaCO3·6H2O), are also known.7 The nucleation and crystallization of CaCO3 are considered to be representative of the processes for other minerals, because the least stable and most soluble polymorph is generally crystallized first.8 Specifically, nucleation is induced in a solution of Ca and carbonate ions that have become supersaturated, and the most soluble ACC (−log![[thin space (1/6-em)]](https://www.rsc.org/images/entities/char_2009.gif) Ksp = 6.4) is rapidly formed and transformed into the least stable vaterite crystals (−log
Ksp = 6.4) is rapidly formed and transformed into the least stable vaterite crystals (−log![[thin space (1/6-em)]](https://www.rsc.org/images/entities/char_2009.gif) Ksp = 7.91), followed by aragonite (−log
Ksp = 7.91), followed by aragonite (−log![[thin space (1/6-em)]](https://www.rsc.org/images/entities/char_2009.gif) Ksp = 8.34) or the most stable calcite (−log
Ksp = 8.34) or the most stable calcite (−log![[thin space (1/6-em)]](https://www.rsc.org/images/entities/char_2009.gif) Ksp = 8.48).9,10 However, the preferential formation of different polymorphs and the transformation of ACC into crystalline polymorphs, such as spherical vaterite and rhombohedral calcite, are known to depend strongly on parameters such as the pH, temperature, and saturation level of the solution.11
Ksp = 8.48).9,10 However, the preferential formation of different polymorphs and the transformation of ACC into crystalline polymorphs, such as spherical vaterite and rhombohedral calcite, are known to depend strongly on parameters such as the pH, temperature, and saturation level of the solution.11
More specifically, the influence of pH on the polymorphs of CaCO3 has drawn significant attention because the structures of the formed crystalline polymorphs are reportedly dependent on that of the original ACC, which is affected by the solution pH.12–16 For example, Gebauer et al.12 produced proto-calcite and proto-vaterite ACC at pH 8.75 and 9.80 (neutral and high pH), respectively, and concluded that the variation in pH was the main factor in determining the structure and stability of the resulting ACC. Meanwhile, Tobler et al.15 examined the crystalline pathways of CaCO3 over initial pH values ranging from 11.8 to 13 using a carbonate solution containing NaOH. They showed that higher pH values induced longer ACC lifetimes and that the ACC formed at higher pH values was directly transformed into calcite without passing through the vaterite phase. In particular, in fast solution-mixing methods wherein precipitation was initiated within 3 s, local solution differences in pH or saturation degree during the early stage of precipitation appeared to cause ambiguous and inconsistent results regarding the effect of the initial pH on the generated polymorphs.16–19 For example, Rodriguez-Blanco et al.16 reported that the initial mixing pH defined the crystalline pathway of ACCs, wherein a neutral mixing pH (pouring a Na2CO3 solution of pH 11.2 into a CaCl2 solution of pH 6.7) produced ACC that was directly transformed into calcite, whereas a high mixing pH (pouring a CaCl2 solution into Na2CO3 solution) formed ACC with a vaterite local structure. In contrast, Oral and Ercan17 observed that a low initial pH (i.e., the use of a NaHCO3 solution of pH 8 or 10) produced a substantial amount of vaterite; however, Zhou et al.18 reported that vaterite was the only product of the carbonation reaction of a CaCl2 solution (at pH 1.5, 3.0, or 6.9) and Na2CO3 (at pH 11.2). Furthermore, Kontrec et al.19 reported that increasing the initial pH promoted the formation of calcite over a pH range of 8.5–10.5. Interestingly, transmission electron microscopy monitoring of the CaCO3 nucleation process under reagent mixing conditions revealed that the direct transformation of ACC into calcite was unlikely to occur;20 thus, it appears necessary to investigate systematically the influence of pH on the polymorphs of CaCO3 precipitated by rapid mixing in the absence of additives.
In the current study, we aimed to examine the effects of pH on the crystalline pathway and subsequent morphological changes of ACC using fast mixing-based solution methods. For this purpose, the pH was automatically monitored every 10 s at a constant temperature of 25 °C in the absence of additives. The carbonation experiments were performed using equal volumes and concentrations of Ca and carbonate ions, wherein the most common reagents were employed, namely, CaCl2·2H2O and NaHCO3/Na2CO3. The initial pH of the carbonate solution was determined by varying the volume ratio of the bicarbonate and carbonate ions. Furthermore, for comparison, an excess concentration of carbonate ions was employed to set a constant pH, which is of particular interest in the early stage of the carbonation reaction.
2. Experimental
All carbonation experiments were performed in 1 L three-necked double-jacketed glass vessels, and an external circulating water bath (RW-1025, JEIL TECH, South Korea) was employed to maintain the solution temperature at 25 °C. A mechanical stirrer (WiseStir® HT120DX, Daihan Scientific, South Korea) was installed at the center of the reactor and was used to mix the solution at 300 rpm. The pH and temperature of the mixture were measured using a pH electrode (Model GTDJ, Wedgewood Analytical, USA) and were automatically recorded every 10 s using a computer. The conductivity of the solution was measured by an on-line conductivity meter (EC-4110-RS, Suntec Co. Ltd, Taiwan, China). The experimental scheme was broadly divided into two categories with (i) equal volumes and concentrations of the aqueous calcium chloride and carbonate solutions and (ii) an excess concentration of carbonate ions (for pH buffering). In the first category, to vary the initial mixing pH, several carbonate sources were employed, namely, NaHCO3, NaHCO3/Na2CO3 (50/50 vol%), and Na2CO3 solutions. The carbonation reaction was initiated in both pathways via the rapid pouring (<10 s) of the calcium chloride solution into the carbonate solution or of the carbonate solution into the calcium chloride solution. The inherent pH values of the NaHCO3, NaHCO3/Na2CO3 (50/50 vol%), and Na2CO3 solutions were 8.7, 10.4, and 11.2, respectively, and these were denoted as C9, C10, and C11, respectively (C = carbonate, number = closest pH integer). Not only considering the solubility of CaCO3 at a neutral pH (i.e., ∼13 mM), but also ensuring that the lowest reagent quantities enabling particle characterization were employed, the concentrations of the calcium chloride and carbonate solutions were both set to 50 mM to give a CaCO3 concentration of 25 mM after mixing. Once the solutions had been mixed, the solution pH decreased due to both the low pH of the Ca solution and the production of CaCO3. The untreated pristine CaCl2·2H2O solution at pH 5.6 (Ca6) was employed in most reactions, but a CaCl2·2H2O solution at pH 11.2 (Ca11, modified using a 0.5 M NaOH solution) was also used to compare specifically the pH values resulting from the low pH of the Ca solution upon solution mixing. To compare the effects of the pH values resulting from the production of CaCO3, a 20 mM Ca11 solution was mixed with an equal concentration of C11 because the production of a low amount of CaCO3 was followed by a small pH drop. In addition, to maintain a constant solution pH in the experiments after the mixing process, a 10- or 20-times higher concentration of carbonate ions than their stoichiometric ratio was utilized for the formation of CaCO3. The detailed conditions for each set of experiments are listed in Table 1. All chemicals were purchased from Sigma-Aldrich (analytical grade, USA) and used without further purification. All aqueous solutions were prepared using deionized water obtained from a Milli-Q 18 MΩ cm system (Millipore, USA).| a Down- and up-arrows indicate pouring the Ca solution into the carbonate solution and the carbonate solution into the Ca solution, respectively. | ||||||||
|---|---|---|---|---|---|---|---|---|
| Ca solution | Source | CaCl2·2H2O | ||||||
| Initial concentration (mM) | 20 | 50 | 50 | 50 | 50 | 1000 | 1000 | |
| Volume (mL) | 300 | 300 | 300 | 300 | 300 | 80 | 40 | |
| Concentration after mixing (mM) | 10 | 25 | 25 | 25 | 25 | 91 | 48 | |
| Initial pH | 5.6 | 5.6 | 11.2 | 5.6 | 5.6 | 5.6 | 5.6 | |
| Pouring directiona | ↑ ↓ | ↑ ↓ | ↑ ↓ | ↑ ↓ | ↑ ↓ | ↓ | ↓ | |
| Carbonate solution | Source | Na2CO3 | Na2CO3 | Na2CO3 | Na2CO3/NaHCO3 (50/50 vol%) | NaHCO3 | Na2CO3 | Na2CO3 |
| Initial concentration (mM) | 20 | 50 | 50 | 50 | 50 | 1000 | 1000 | |
| Volume (mL) | 300 | 300 | 300 | 300 | 300 | 800 | 800 | |
| Concentration after mixing (mM) | 10 | 25 | 25 | 25 | 25 | 909 | 952 | |
| Initial pH | 11.2 | 11.2 | 11.2 | 10.4 | 8.7 | 11.2 | 11.2 | |
| [(Bi)carbonate]/[Ca] | 1 | 1 | 1 | 1 | 1 | 10 | 20 | |
The CaCO3 precipitates immediately formed, and the suspension (∼40 mL) was sampled at predetermined intervals (5, 15, 30, 60, 180, and 300 min) during an overall reaction time of 5 h using a 100 mL polypropylene syringe (BD Plastipak®, USA). Filtration was then performed using a 0.2 μm nylon membrane filter (Whatman™, USA), and the filtered particles were washed with deionized water and anhydrous ethanol several times prior to drying overnight at 60 °C. In addition, the filtrate was acidified using instrumental-grade HNO3 (5%, v/v), and the amount of dissolved Ca ions was determined by performing inductively coupled plasma-optical emission spectroscopy (Optima 5300DV, PerkinElmer, USA). The amount of CaCO3 particles was estimated from the difference between concentrations of dissolved Ca in the initial solution of CaCl2·2H2O and in the sampled solutions.
The obtained particles were then analyzed via X-ray diffraction (XRD; X'Pert MPD, Philips Analytical, The Netherlands) over the 10–65° 2θ range using Cu Kα radiation in the step-scan mode because of the low signal-to-noise ratio of the amorphous phase. The tube voltage was 45 kV, the tube current was 200 mA, and 0.01° steps of 1 s duration were employed. The morphologies were examined using field-emission scanning electron microscopy (FE-SEM; SU8230, Hitachi, Japan) at the Jeonju Center of the Korea Basic Science Institute. To capture the surface details, an acceleration voltage of 10 kV and a working distance (WD) of 8–13 mm were used in the secondary electron (SE) mode using the upper detector (U). The samples were cast onto C tape and coated with a thin layer of Pt to eliminate the charging effect.
3. Results and discussion
3.1. Formation of calcium carbonate particles
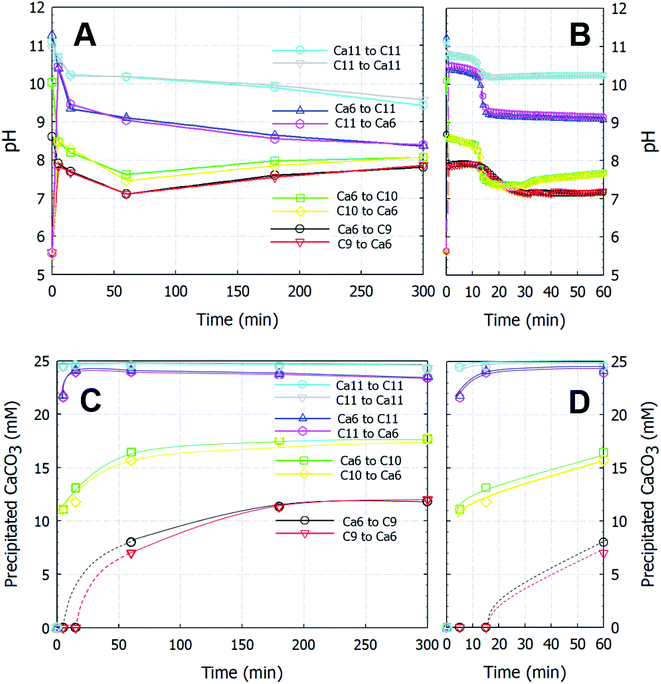
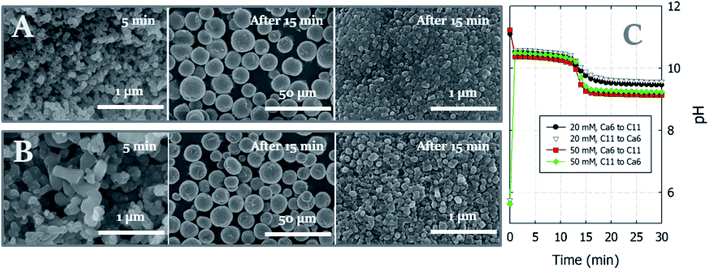
The precipitation of CaCO3 is known to proceed within 1 s under solution-based mixing conditions, and the generation of a local pH difference is inevitable upon particle formation, regardless of the employed mixing speed.14 For example, if a calcium chloride solution of low pH (i.e., an intrinsic pH of 5.6) is poured into a sodium carbonate solution of high pH (i.e., an intrinsic pH of 11.2), CaCO3 particles are formed in a higher pH environment than in the situation in which a high pH carbonate solution is poured into a low pH Ca solution. In this context, Rodriguez-Blanco et al.16 demonstrated that the former system produced calcite directly from ACC in 20 min, whereas the latter produced calcite from vaterite in 6 h.Fig. 1 shows the variations in both the amount of dissolved Ca and the pH of the solution as functions of time. Irrespective of the pouring direction, as long as the solution source is the same, the pH converges at the same point within 10 s and develops the same increasing or decreasing trend over time (Fig. 1A and B). All experiments instantly produced white CaCO3 particles, even at the point of contact between the two solutions, except in the Ca6/C9 experiments, in which the particles began to appear after ∼15 min. Further, the amount of generated CaCO3 is dependent on the carbonate source rather than the pouring direction (Fig. 1C and D). Interestingly, the change in pH does not show a linear relationship with the amount of precipitated CaCO3. More specifically, following pH merging upon mixing of the solutions (i.e., over a time < 10 s), the pH remains relatively stable over ∼10 min (or slightly longer in the case of C9) prior to exhibiting a sharp decrease (or a gradual decline in the C9 experiment). This trend is followed by a broad decrease or increase in the slope gradient in the cases of C11 or C9 and C10, respectively, with the final pH approaching a value of ∼8.3. This final pH value corresponds to the equilibrium pH of the carbonate/bicarbonate system under ambient conditions.21 In contrast, after reaching equilibrium, the amount of precipitated CaCO3 remains stable over time, indicating that no relationship appears to exist between the amount of precipitated CaCO3 and the change in pH. When comparing the results obtained using the C9 and C10 carbonate sources, the difference in the amount of precipitated CaCO3 is relatively large (i.e., ∼5 mM) despite an essentially insignificant pH difference of <1 after 10 s. Moreover, despite the pH changes occurring in the later stages of the process, no increase in the amount of recovered CaCO3 particles was obtained for the Ca6/C10 and Ca6/C9 systems.
In the carbonate/bicarbonate system, the pH of the solution changes according to the dissociation equilibrium equation: pH = pKa + log[CO32−] − log[HCO3−], where the dissociation constant (pKa) of the bicarbonate ion is 10.3.21 However, predicting the solution pH in the case of CaCO3 precipitation is more complicated than in the case in which bicarbonate and carbonate ions exist in solution because both CaCO3 precipitation and carbonate ion formation from bicarbonate ions lower the solution pH through proton generation. Moreover, in addition to the dissociation equilibrium of the (bi)carbonate species in solution, the pH constantly changes according to the equilibration of (bi)carbonate ions with atmospheric or dissolved CO2. The possible reactions involved in this process can be summarized as follows:
| CO2(aq) ↔ H+ + HCO3− | (1) |
| HCO3− ↔ H+ + CO32− | (2) |
| Ca2+ + HCO3− ↔ CaHCO3+ | (3) |
| Ca2+ + HCO3− ↔ H+ + CaCO3(s) | (4) |
| Ca2+ + CO32− ↔ CaCO3(s) | (5) |
In addition, in the reactions using C9, wherein almost all carbonate sources were HCO3− species, the observation that CaCO3 was not recovered after 5 or 15 min confirmed that the reactions outlined in eqn (2)–(4) were extremely slow. Furthermore, at C10 using the NaHCO3/Na2CO3 (50/50 vol%) system, 60 wt% of CaCO3(s) was formed after 5 min compared with the amount of solid formed after 5 h stirring. Meanwhile, when using C11, >90 wt% of CaCO3 particles was formed after 5 min. This rapid crystallization and induction time of <1 s were likely related to the availability of the fully deprotonated carbonate ion species, i.e., CO32−.
Provided that the pH changes were interpreted based on the amount of precipitated CaCO3, when C11 was used as the carbonate source, the initial drop in pH likely contributed to the formation of CaCO3(s), whereas the steady drop was related to the equilibrium reaction between the bicarbonate and carbonate species. When C9 and C10 were used, the pH drop was attributed to the formation of CaCO3(s); however, CaCO3 precipitation was an ongoing process during the increase in pH until a reaction time of ∼180 min. In terms of bicarbonate/carbonate equilibrium, the formation of carbonate from bicarbonate appeared to be responsible for the gradual increase in pH, as evidenced by the similar rates of CaCO3 precipitation observed for reagents C9 and C10. Following the consumption of carbonate ions in the rapid carbonation reaction occurring in the C10 system, the rate of CaCO3 recovery was similar to that in the C9 system (which contained no carbonate ions), and the amount of precipitated CaCO3 increased with time in both cases. It therefore appeared that the amount of recovered CaCO3 was dependent on the carbonate source (i.e., bicarbonate or carbonate) rather than the solubility of the CaCO3 product at a specific solution pH.
3.2. Investigations of the polymorphs of the generated calcium carbonate
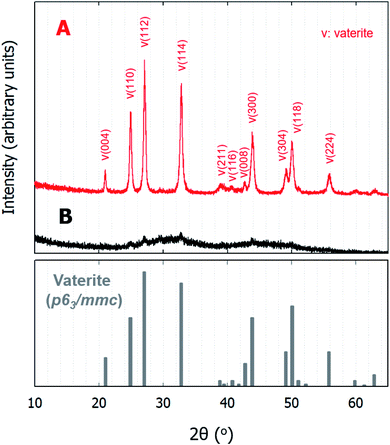
The formation of ACC occurs rapidly upon solution mixing, and it has been reported that the pH values of the two solutions can affect the short-range structure of ACC, ultimately leading to a specific transformation into either calcite or vaterite.12,14 Table 2 lists the polymorphs of the CaCO3 particles obtained as functions of time. With the exception of a single set of experiments in which C9 was used as the carbonate source, ACC particles were instantaneously formed at the point of mixing, and the particles recovered after 5 min of stirring were composed of only ACC; no crystalline polymorphs were present in this sample. In contrast, the particles recovered after 15 min (and up to ∼300 min) were composed of only vaterite (JCPDS no. 33-0268) with a space group of P63/mmc. Indeed, the XRD patterns in Fig. 2 indicate that all samples were composed of either ACC or vaterite. As shown in Fig. 2B, the recovered ACC particles included a small amount of vaterite, which is apparent from the major reflections of the vaterite phase; nevertheless, the figure clearly shows the dominance of the poorly ordered amorphous phase exhibiting broad humps located at 2θ values of ∼30° and 45° (Fig. 2B).16 Based on the low-magnification FE-SEM images, in which ACC particles are spread widely and vaterite particles are spread sparsely in a random manner (see Fig. S1†), the miniscule vaterite signal in Fig. 2B likely originated from an incidental transformation caused during the sample handling process (i.e., washing with deionized water or exposure to air before analysis). When mono-protonated HCO3− was used as the carbonate source (i.e., in the case of C9), no precipitation was observed until after ∼15 min, and only a small amount of particles (∼0.12 mg/40 mL) was recovered after 30 min; this product was also identified as vaterite.| Conditions | Time (min) | |||||||
|---|---|---|---|---|---|---|---|---|
| 5 | 15 | 30 | 60 | 180 | 300 | |||
| Ca source | Pouring directiona | Carbonate source | ||||||
| a Right- and left-arrows indicate pouring the Ca solution into the carbonate solution and the carbonate solution into the Ca solution, respectively. | ||||||||
| CaCl2·2H2O (Ca6) | → | Na2CO3 (C11) | ACC | Vaterite | Vaterite | Vaterite | Vaterite | Vaterite |
| ← | ||||||||
| CaCl2·2H2O (Ca11) | → | Na2CO3 (C11) | ACC | Vaterite | Vaterite | Vaterite | Vaterite | Vaterite |
| ← | ||||||||
| CaCl2·2H2O (Ca6) | → | Na2CO3/NaHCO3 (C10) | ACC | Vaterite | Vaterite | Vaterite | Vaterite | Vaterite |
| ← | ||||||||
| CaCl2·2H2O (Ca6) | → | NaHCO3 (C9) | No solid | No solid | Vaterite | Vaterite | Vaterite | Vaterite |
| ← | ||||||||
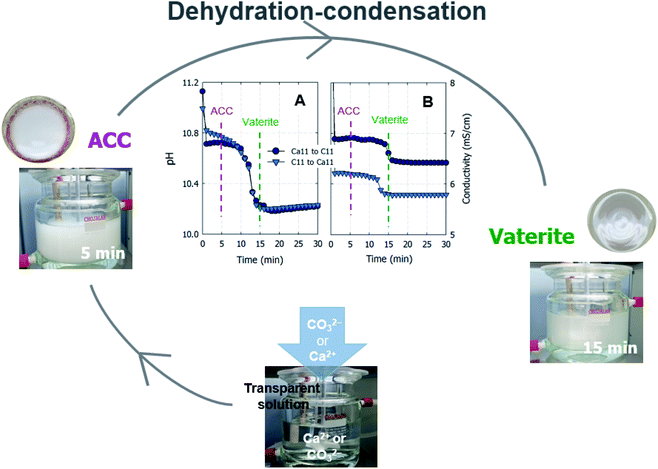
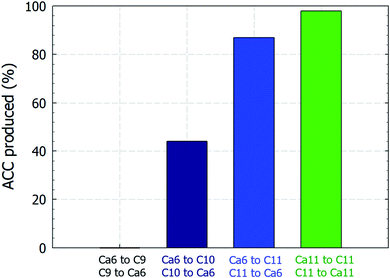
Curiously, the suspension rapidly became slightly transparent at ∼10 min under all conditions, with the exception of the experiments conducted using C9. Fig. 3 shows photographs of the reactors taken at 5 and 15 min. The time between when these images were recorded is correlated with the point at which the pH plateau begins to collapse and a rapid decrease in pH is detected (Fig. 1A and B). Moreover, this time indicates the duration for which ACC is stable in solution prior to the crystallization process.22 The conductivity decrease is also evident in the cases of Ca6/C10, Ca6/C11, and Ca11/C11 and is attributable to the increased amount of CaCO3 particles recovered after 15 min compared to that after 5 min in the cases of Ca6/C10 and Ca6/C11. Even in the case of Ca6/C11, the amount of precipitated CaCO3 is increased in the sample at 15 min compared to that at 5 min (see Fig. S2†). However, because the amount of CaCO3 remains unchanged after 5–300 min in the case of Ca11/C11, the decrease in conductivity is involved only in the transformation of ACC into vaterite (Fig. 3B). The pH variation of Ca11/C11 is also depicted in Fig. 3A for comparison. Considering that the polymorphs of the particles recovered after 5 and 15 min were respectively identified as ACC and vaterite, the transformation of ACC into vaterite proceeds via a dehydration–condensation pathway. As shown in Fig. 3B, the conductivity decreases over time. The curves have regions of slight and steady decreases in slope, wherein loss of water is likely to occur; the regions with rapidly decreasing conductivity seem to indicate condensation. Combining the XRD results with the decreases in both pH and conductivity, the transformation of ACC into vaterite is unlikely to proceed via a dissolution–precipitation mechanism.20 If the reaction proceeded via a dissolution–precipitation pathway, the conductivity would increase because of the dissolution of ACC and decrease with precipitation. Our observation is analogous to that obtained in a previously reported study, wherein the original ACC particles rapidly dehydrated and condensed into vaterite by reorganization of the internal structure within the individual nanoparticles (the authors confirmed the loss of water using Fourier transform infrared spectroscopy).23 The amount of ACC recovered after 5 min of stirring was evaluated relative to the carbonate and Ca sources employed in the mixing process (Fig. 4). Specifically, in the case of C9, the carbonate species was essentially HCO3− alone, whereas in the case of C10, approximately half of the carbonate species was CO32− owing to the fact that pKa of the bicarbonate ions was 10.3; upon mixing with the low-pH calcium solution (Ca6), the portion of CO32− was slightly reduced. In the case of C11, almost all carbonate ions were in the CO32− form, although the portion of CO32− again decreased upon mixing with the low-pH Ca solution. In the case of C11/Ca11, the initial pH of the Ca solution was set to 11, and the decrease in CO32− resulting from pH lowering was diminished. Thus, for the C10/Ca6, C11/Ca6, and C11/Ca11 systems, the amounts of ACC recovered were approximately 44%, 90%, and 98%, respectively. These results indicate that ACC formation is dependent on the pH and availability of CO32−.
3.3. Morphological changes in the produced calcium carbonate
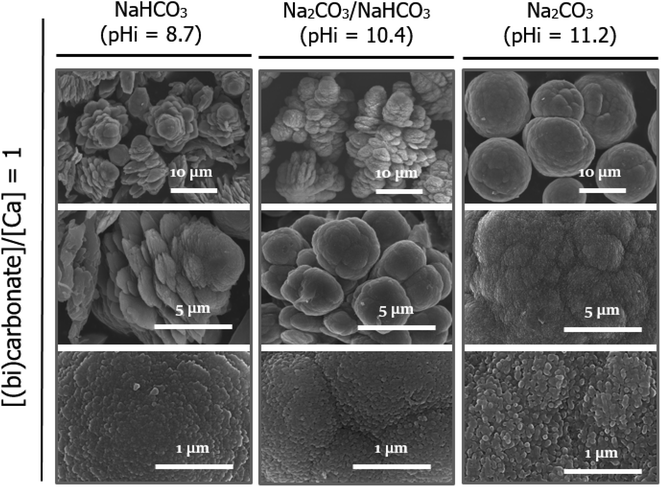
Although CaCO3 particles began to precipitate even before the solution became homogenously mixed, all crystalline phases ultimately resulting from our system had the vaterite structure, independent of the pH generated in the solution upon rapid mixing. Previously, it was reported that the particle size of ACC determined the specific polymorph present in solution, which, in turn, was associated with the reactant concentration. Specifically, it was reported that a lower concentration resulted in a reduced pH decrease during carbonation, in addition to an increase in particle size, which led to an increase in the proportion of calcite formed compared to that of vaterite.22 Thus, based on the above study, we decided to observe the crystallization pathway using a lower reactant concentration (i.e., 20 mM), as shown in Fig. 5, which compares images of the particles and solution pH changes for the standard (50 mM) and lower (20 mM) reactant concentrations. More specifically, at the lower reactant concentration of 20 mM, the particles sampled after 5 min and between 15 and 300 min were confirmed once again to be ACC and vaterite, respectively. Notably, larger ACC particles seemed to be produced at 20 mM (Fig. 5B); however, these particles had in fact merged and therefore appeared larger than those obtained at 50 mM (see Fig. S3†). Moreover, the crystalline vaterite products obtained at the lower reagent concentrations exhibited comparable sizes and shapes, although a slight difference (pH 9.1 and 9.5 at 50 and 20 mM, respectively) in the solution pH was observed after 15 min. Thus, all vaterite crystals formed under these different conditions exhibited the typical spherical morphology, with rough surfaces originating from the aggregation of nanoparticles.24As shown in Fig. 5A, for the ACCs formed at reactant concentrations of 50 mM, the shapes and sizes of the ACC particles are identical, irrespective of the carbonate or Ca source (with the exception of C9, where particle formation is not observed). Thus, Fig. 6 depicts the representative morphologies of the CaCO3 particles obtained when Ca6 was individually reacted with C9, C10, and C11. Interestingly, the morphology of vaterite changes with variation in the carbonate source, whereas the individual shapes are identical in all samples obtained between 15 and 300 min for the same carbonate sources. It should be noted here that the vaterite morphologies are identical for the Ca11/C11 and Ca6/C11 systems and thus are not shown separately. Furthermore, when only CO32− (i.e., C11) was used, the typical spherical morphology was obtained, and the pH at which the ACC particles were stabilized (i.e., over the initial ∼10 min) was >10. In the C11/Ca6 and C11/Ca11 systems, the precipitation process was terminated at 15 and 5 min, respectively, as indicated by the amount of precipitated CaCO3 reaching a plateau (Fig. 1C). However, when C9 and C10 were used, croissant-like aggregates gradually tapering from the center to both ends were obtained (Fig. 6). These aggregates were layered structures composed of plate-like or cauliflower-like grains, and such unique morphologies of vaterite have been previously reported following crystal formation at pH values < 9.18,25 In terms of the precipitation kinetics, in the 15 min samples recovered for the C9 and C10 systems, the precipitation of CaCO3 was not complete; in these two systems, only ∼60% and 75% of the precipitated CaCO3 present was recovered after 30 and 15 min, respectively. However, the precipitated CaCO3 particles did not show a significant difference in the particle size distribution for each system of C9 and C10 (see Fig. S4†). In both cases, when the carbonation (precipitation) was almost finished and the amount of CaCO3 precipitated reached a plateau, the pH was less than 8. The slow precipitation kinetics resulting from the carbonation reaction with mono-protonated HCO3− species would favor the production of plate-like layered shapes instead of random growth in all directions, the latter of which would lead to spherically shaped particles. However, despite the different morphologies of the vaterite particles, magnified images of the rough surfaces indicated that the building blocks were likely to be the same nanoparticles. This observation is compatible with that mentioned in a previous report, which stated that vaterite particles were composed of nanoparticles with rough surfaces, regardless of the crystal growth process and final morphology.26
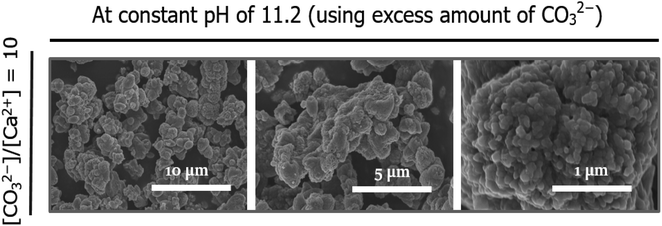
Spherulitic growth is a rapid process in which new nanoparticles are continuously nucleated on the surfaces of existing particles with no structural relationship to generate micrometer-sized spherulites.27 Based on our results, which are consistent with those of a previous report suggesting that the spherulitic growth of vaterite particles to generate spherical aggregates is preferable at higher pH,18 we hypothesized that larger spherical particles could be formed at a constant high pH of 11.2. Thus, using an excess of fully deprotonated carbonate ions (i.e., CO32−), irregular agglomerates were formed, as shown in the FE-SEM images presented in Fig. 7. Although the building blocks were also likely to be nanoparticles, the newly nucleated particles appeared to be stacked in a disorderly manner, resulting in an even rougher surface. Similar observations were reported previously,28 wherein the formation of more nuclei under constantly high solution pH conditions increased the density of nuclei and promoted their subsequent random agglomeration. Meanwhile, the existing nuclei at low pH were grown on the surfaces of particles to adhere to the lowest energy rule, resulting in a regular spherical shape.
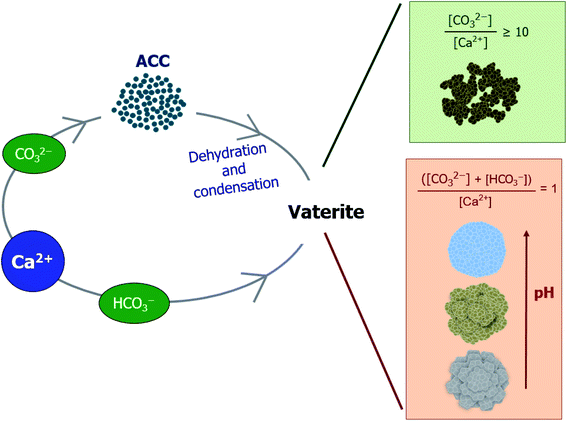
These results indicate that the vaterite morphology is dependent on the pH generated upon mixing the two reactants, in which the ACC particles stabilize for some time (when the pH is higher than ∼8.3) and then merge while losing water and condense to yield a secondary crystalline phase of vaterite (Fig. 8). Once the vaterite morphology initially starts to form in the pH range in which the ACC is stabilized, the subsequently formed particles are likely to be stacked following the precedent morphology. The vaterite morphology is not changed in the 300 min sample despite the increased amount compared to that at 5 min. In conclusion, based on our results, the instant inhomogeneity of the solution pH resulting from both the pouring and mixing processes is unlikely to have a significant effect on the phases formed, but the pH after mixing could influence the phase morphology of the secondary crystalline form of calcium carbonate.
4. Conclusions
In this study, we investigated the influence of pH on the crystalline pathways and subsequent morphological changes occurring in CaCO3 formed by rapid mixing-based solution methods. To vary the initial mixing pH, three carbonate sources were employed, namely, NaHCO3 (C9), NaHCO3/Na2CO3 (50/50 vol%, C10), and Na2CO3 (C11) (C = (bi)carbonate, number = closest pH integer), along with two calcium chloride solutions (i.e., Ca6 and Ca11). The pouring direction was also varied, i.e., the carbonate solution was added to the calcium chloride solution, or vice versa. It was found that for each combination of source solutions, the pH converged at a specific point within 10 s of mixing. Interestingly, the precipitation kinetics was dependent on the availability of the fully deprotonated carbonate ion species, namely, CO32−. Specifically, with the exception of one set of experiments using NaHCO3 solution (C9), the formation of white particles was instantaneously detected, and the particles recovered after 5 min were identified as poorly ordered ACC particles. The amounts of ACC recovered were ∼44%, 90%, and 98% for the C10/Ca6, C11/Ca6, and C11/Ca11 systems, respectively. In contrast, all particles recovered after 15 min (i.e., between 15 and 300 min) were identified as vaterite (JCPDS no. 33-0268) with a space group of P63/mmc, although the product morphologies were different depending on the conditions employed. For example, when the carbonate ions (CO32−) were the dominant species, spherical particles with relatively constant size distributions were obtained regardless of the initial solution concentrations employed or the size of the initially produced ACC particles. In contrast, when a solution with dominant bicarbonate ions was utilized (i.e., HCO3−), croissant-like aggregates that gradually tapered from the center to both ends were detected. These aggregates were identified as layered structures composed of plate-like and grape-like grains for the C9 and C10 systems, respectively. Under a constantly high pH of 11.2 (caused by an excess of carbonate ions), the morphology of vaterite with a higher surface roughness appeared to be irregular agglomerates composed of nano-sized particles. Our study, therefore, represents the first systematic investigation of the influence of the initial solution pH on the polymorphs of calcium carbonate precipitated by rapid mixing in the absence of additives. This development will be elaborated upon through a systematic study of the transformation rate of calcite from vaterite.Author contributions
Kyungsun Song: conceptualization, investigation, writing original draft. Jun-Hwan Bang: investigation, methodology, validation. Soo-Chun Chae: methodology, data curation, validation. Jeongyun Kim: methodology, formal analysis, validation. Seung-Woo Lee: conceptualization, funding acquisition, project administration.Conflicts of interest
The authors declare that they have no known competing financial interests or personal relationships that could have appeared to influence the work reported in this paper.Acknowledgements
The authors thank the support by the Basic Research Project of the Korea Institute of Geoscience and Mineral Resources (KIGAM), funded by the Ministry of Science, ICT, and Future Planning.References
- J. D. Milliman and A. W. Droxler, Geol. Rundsch., 1996, 85, 496–504 CrossRef CAS.
- Z. Zou, W. J. E. M. Habraken, G. Matveeva, A. C. S. Jensen, L. Bertinetti, M. A. Hood, C.-y. Sun, P. U. P. A. Gilbert, I. Polishchuk, B. Pokroy, J. Mahamid, Y. Politi, S. Weiner, P. Werner, S. Bette, R. Dinnebier, U. Kolb, E. Zolotoyabko and P. Fratzl, Science, 2019, 363, 396–400 CrossRef CAS PubMed.
- A. M. Ferreira, A. S. Vikulina and D. Volodkin, J. Controlled Release, 2020, 328, 470–489 CrossRef CAS PubMed.
- O. A. Jimoh, K. S. Ariffin, H. B. Hussin and A. E. Temitope, Carbonates Evaporites, 2018, 33, 331–346 CrossRef CAS.
- W. Liu, L. Teng, S. Rohani, Z. Qin, B. Zhao, C. C. Xu, S. Ren, Q. Liu and B. Liang, Chem. Eng. J., 2021, 416, 129093 CrossRef CAS.
- J. Chen, L. Duan and Z. Sun, Energy Fuels, 2020, 34, 7806–7836 CrossRef CAS.
- J. W. Morse, R. S. Arvidson and A. Lüttge, Chem. Rev., 2007, 107, 342–381 CrossRef CAS PubMed.
- T. Ogino, T. Suzuki and K. Sawada, Geochim. Cosmochim. Acta, 1987, 51, 2757–2767 CrossRef CAS.
- L. Brečević and A. E. Nielsen, J. Cryst. Growth, 1989, 98, 504–510 CrossRef.
- L. N. Plummer and E. Busenberg, Geochim. Cosmochim. Acta, 1982, 46, 1011–1040 CrossRef CAS.
- Y. Boyjoo, V. K. Pareek and J. Liu, J. Mater. Chem. A, 2014, 2, 14270–14288 RSC.
- D. Gebauer, P. N. Gunawidjaja, J. Y. P. Ko, Z. Bacsik, B. Aziz, L. Liu, Y. Hu, L. Bergström, C.-W. Tai, T.-K. Sham, M. Edén and N. Hedin, Angew. Chem., Int. Ed., 2010, 49, 8889–8891 CrossRef CAS PubMed.
- D. Gebauer, A. Völkel and H. Cölfen, Science, 2008, 322, 1819–1822 CrossRef CAS PubMed.
- J. D. Rodriguez-Blanco, K. K. Sand and L. G. Benning, in New Perspectives on Mineral Nucleation and Growth: From Solution Precursors to Solid Materials, ed. A. E. S. Van Driessche, M. Kellermeier, L. G. Benning and D. Gebauer, Springer International Publishing, Cham, 2017, pp. 93–111, DOI: DOI:10.1007/978-3-319-45669-0_5.
- D. J. Tobler, J. D. Rodriguez Blanco, H. O. Sørensen, S. L. S. Stipp and K. Dideriksen, Cryst. Growth Des., 2016, 16, 4500–4508 CrossRef CAS.
- J. D. Rodriguez-Blanco, S. Shaw, P. Bots, T. Roncal-Herrero and L. G. Benning, J. Alloys Compd., 2012, 536, S477–S479 CrossRef CAS.
- Ç. M. Oral and B. Ercan, Powder Technol., 2018, 339, 781–788 CrossRef.
- G.-T. Zhou, Q.-Z. Yao, S.-Q. Fu and Y.-B. Guan, Eur. J. Mineral., 2010, 22, 259–269 CrossRef CAS.
- J. Kontrec, N. Tomašić, N. Matijaković Mlinarić, D. Kralj and B. Njegić Džakula, Crystals, 2021, 11, 1075 CrossRef CAS.
- M. H. Nielsen, S. Aloni and J. J. De Yoreo, Science, 2014, 345, 1158–1162 CrossRef CAS PubMed.
- W. Stumm and J. J. Morgan, Aquatic Chemistry: Chemical Equilibria and Rates in Natural Waters, John Wiley & Sons, 2012 Search PubMed.
- Z. Zou, L. Bertinetti, Y. Politi, A. C. S. Jensen, S. Weiner, L. Addadi, P. Fratzl and W. J. E. M. Habraken, Chem. Mater., 2015, 27, 4237–4246 CrossRef CAS.
- J. D. Rodriguez-Blanco, S. Shaw and L. G. Benning, Nanoscale, 2011, 3, 265–271 RSC.
- D. Konopacka-Łyskawa, Crystals, 2019, 9, 223 CrossRef.
- W.-S. Kim, I. Hirasawa and W.-S. Kim, Ind. Eng. Chem. Res., 2004, 43, 2650–2657 CrossRef CAS.
- Q. Hu, J. Zhang, H. Teng and U. Becker, Am. Mineral., 2012, 97, 1437–1445 CrossRef CAS.
- A. G. Shtukenberg, Y. O. Punin, E. Gunn and B. Kahr, Chem. Rev., 2012, 112, 1805–1838 CrossRef CAS PubMed.
- Y. Sheng Han, G. Hadiko, M. Fuji and M. Takahashi, J. Cryst. Growth, 2006, 289, 269–274 CrossRef.
Footnote |
| † Electronic supplementary information (ESI) available. See https://doi.org/10.1039/d2ra03507c |
| This journal is © The Royal Society of Chemistry 2022 |

