
 Open Access Article
 This Open Access Article is licensed under a Creative Commons Attribution-Non Commercial 3.0 Unported Licence
Insights into the solvothermal reaction for synthesizing tin(IV) oxide porous spheres†
Ayano Taniguchi a,
Rei Miyataa,
Masataka Ohtani*ab and
Kazuya Kobiro*ab
a,
Rei Miyataa,
Masataka Ohtani*ab and
Kazuya Kobiro*ab
aGraduate School of Engineering, Kochi University of Technology, 185 Miyanokuchi, Tosayamada, Kami, Kochi 782-8502, Japan
bResearch Center for Structured Nanochemistry, Kochi University of Technology, 185 Miyanokuchi, Tosayamada, Kami, Kochi 782-8502, Japan. E-mail: ohtani.masataka@kochi-tech.ac.jp; kobiro.kazuya@kochi-tech.ac.jp
First published on 15th August 2022
Abstract
The solvothermal synthesis of SnO2 porous spheres was optimized by varying the reactants, solvents, additives, reaction temperature and reaction time. The products of these trials were characterized by X-ray diffraction, electron microscopy and X-ray fluorescence spectroscopy. SnO2 possessing a highly ordered spherical structure based on the aggregation of nanometer-sized primary particles was obtained using a simple one-pot solvothermal approach. These spheres were porous with a high specific surface area of more than 200 m2 g−1. The electrical conductivity of this material equaled or exceeded that of commercially available SnO2. SnO2-based spherical porous composites including various elements were easily synthesized by incorporating additional materials in the precursor solution.
Introduction
Tin oxide (SnO2) is a typical n-type semiconductor oxide but exhibits relatively high electrical conductivity compared with other metal oxides1 and has practical applications as a semiconductor for gas sensors.2,3 SnO2 is not toxic and tin (Sn) is an abundant base metal with a comparatively low cost. For these reasons, SnO2 is considered a potential material for sustainable development applications, particularly with regard to uses in Li-ion batteries4 and perovskite solar cells.5 In recent years, many studies have examined the use of this material as a support for electrocatalysts in polymer electrolyte fuel cells.6 In such cases, the oxide must exhibit a high specific surface area and good electrical conductivity. Specifically, SnO2 supports having increased surface areas to provide greater collision frequencies as well as higher mass diffusion rates that accelerate reactions at the electrodes.Several synthetic approaches that provide SnO2 aggregates with various morphologies, such as fibers7–11 and beads,12 have been reported. These structures are expected to affect the electrical conductivity of the material. Doping with heteroatoms (including P, Nb and Sb) also improves the electrical conductivity of the oxide and a number of different SnO2-based materials have been studied. Various SnO2-based composites have been produced under different conditions with different technique, while no simple reaction affording SnO2-based materials modified with different element by one-pot and single-step procedure was reported to our best knowledge. Many techniques for the synthesis of SnO2 with a high specific surface area and enhanced porosity have also been devised. As an example, electrospinning is commonly used to generate porous structures by forming stacked SnO2 fibers on substrates.7–9 Vapor–liquid–solid techniques can also generate fiber-like SnO2.10,11 In addition, two and three dimensional reticulate porous SnO2 and hollow SnO2 spheres have been synthesized via hard template methods using polystyrene or carbon spheres as sacrificial templates.13–16 Although this technology provides materials with a high degree of porosity and very uniform structures based on using monodisperse particles as templates, removal of the sacrificial templates is labor-intensive and also results in a substantial waste stream. Solution methods are advantageous when preparing SnO2 composites, because precursor mixtures of Sn source materials and different metal sources can be readily used as solutions to prepare SnO2 composites. Sol–gel and chemical precipitation methods for the synthesis of nanoparticles can provide hetero-element composites.17,18 Solvothermal and hydrothermal approaches have also been used to fabricate SnO2 nanoparticles with controlled morphologies based on optimizing synthetic parameters such as solvents, additives, concentrations and heating.2,19 Using these various approaches, SnO2 particles with a variety of higher-order structures, such as spherical aggregates of nanoparticles,20–22 flower-like particles (aggregates of plate particles)23–26 and urchin-like particles (aggregates of rod particles),27 have been reported. Like this, synthetic conditions such as solvents and additives should affect the composition and shape of the products. However, most studies have used ethanol and/or water as the reaction solvent and the effects of this solvent on the solvothermal synthesis of inorganic oxide nanoparticles have not been fully investigated.
Previously, our group reported the single-step solvothermal synthesis of spherical porous metal oxides, including SiO2, TiO2, ZrO2 and CeO2, as well as composites of these oxides.28 By controlling the reaction rates of the metal sources based on using specific combinations of carefully selected sources, additives and solvents, uniformly mixed composite metal oxides that were homogeneous on the nanometer scale were easily synthesized. As an example, homogeneous Co/Mn/Fe mixed oxide spheres were synthesized using diethylene glycol as an additive and methanol as a solvent.29 Interestingly, the solvothermal synthesis of MgO was possible using the aprotic acetonitrile as the solvent while Mg(OH)2 was formed in the protic solvent methanol.30 Furthermore, in the case of the solvothermal synthesis of nanoparticle assemblies of CeO2−x, the oxidation number of Ce in the product was easily controlled by changing the acetonitrile/water ratio in the solvent.31
The present work demonstrates a highly versatile yet simple solvothermal technique for the synthesis of composites of SnO2 with various elements based on optimizing the reaction conditions. The effects of parameters such as solvents and additives on the products are discussed in detail.
Experimental
Materials
Tin(IV) chloride pentahydrate (SnCl4·5H2O, >95.0%), niobium(V) ethoxide (Nb(OEt)5, >99.9%), ruthenium(III) acetylacetonate (Ru(acac)3, no purity statement), ruthenium(III) chloride hydrate (RuCl3·nH2O, >85.0% as anhydrous), palladium(II) acetate (Pd(OAc)2, >97.0%), formic acid, acetonitrile, ethyl acetate, methanol, N,N-dimethylformamide (DMF) and tetrahydrofuran (THF) were purchased from the FUJIFILM Wako Pure Chemical Corporation. Dibutyltin diacetate (nBu2Sn(OAc)2, >98.0%), triethyl phosphate (PO(OEt)3, >99.0%), triisopropoxyvanadium(V) oxide (VO(OiPr)3, >97.0%) and triethylene glycol were purchased from the Tokyo Chemical Industry Co., Ltd. Rhodium(III) acetylacetonate (Rh(acac)3, >97%) and hydrogen hexachloroplatinate(IV) hexahydrate (H2PtCl6·6H2O, >98.5%) was purchased from Sigma-Aldrich. All chemicals were used as received without further purification. S-2000 (commercial SnO2) was purchased from the Mitsubishi Materials Electronic Chemicals Co., Ltd.Preparation of porous SnO2
| Entry | Additive | Yield/mg | |
|---|---|---|---|
| Materialb | Amount/mmol | ||
| a Reaction conditions. nBu2Sn(OAc)2: 350 μmol; solvent: methanol (3.5 mL); temperature: 300 °C; time: 10 min.b tEG, dEG, EG and EdA represent triethylene glycol, diethylene glycol, ethylene glycol and ethylenediamine, respectively. | |||
| 1 | tEG | 11.1 | 23 |
| 2 | — | — | 13 |
| 3 | dEG | 11.1 | 23 |
| 4 | EG | 10.5 | 37 |
| 5 | EdA | 10.5 | 11 |
| Entry | tEGb/mmol | Temperature/°C | Time/min | Yield/mg |
|---|---|---|---|---|
| a Reaction conditions. nBu2Sn(OAc)2: 350 μmol; solvent: ethyl acetate (3.5 mL).b tEG represents triethylene glycol.c Total weight of yellow and black powder. | ||||
| 1 | 7.0 | 300 | 30 | 32c |
| 2 | 3.5 | 300 | 30 | 37 |
| 3 | 10.5 | 290 | 120 | 19c |
| 4 | 10.5 | 280 | 120 | 31c |
| 5 | 10.5 | 270 | 120 | 32c |
| 6 | 10.5 | 250 | 120 | 18 |
| Entry | Amount of reactant | Samplea | Product | |||||
|---|---|---|---|---|---|---|---|---|
| SnCl4·5H2O/μmol | Different element source/μmol | Yield/% | 2nd element/at% | 3rd element/at% | Crystallite sizeb/nm | Specific surface areac/m2 g−1 | ||
| a Concentrations of hetero-element(s) in the precursor solutions: P, V and Nb (entries 2–4 and 7–9) 4 at% and Pd (entry 5) and Pt (entries 6–9) 1 at%; solvent: methanol (8.75 mL); additive: triethylene glycol (17.5 mmol); temperature: 200 °C; time: 60 min.b Crystallite size of SnO2 after calcination at 400 °C for 60 min as determined by Scherrer's equation.c Evaluated after calcination at 400 °C for 60 min. | ||||||||
| 1 | 875 | — | SnO2 | 80 | — | — | 4.0 | 105 |
| 2 | 840 | PO(OEt)3 35.0 | P–SnO2 | 103 | 4.9 (P) | — | 2.7 | 175 |
| 3 | 840 | VO(OiPr)3 35.0 | V–SnO2 | 83 | 4.3 (V) | — | 2.8 | 117 |
| 4 | 840 | Nb(OEt)5 35.0 | Nb–SnO2 | 101 | 3.8 (Nb) | — | 3.7 | 104 |
| 5 | 866 | Pd(OAc)2 8.75 | Pd–SnO2 | 93 | 1.0 (Pd) | — | 4.5 | 90.3 |
| 6 | 866 | H2PtCl6·6H2O 8.75 | Pt–SnO2 | 69 | 1.1 (Pt) | — | 3.9 | 101 |
| 7 | 831 | PO(OEt)3 35.0 | Pt–P–SnO2 | 85 | 2.6 (P) | 1.2 (Pt) | 2.3 | 171 |
| H2PtCl6·6H2O 8.75 | ||||||||
| 8 | 831 | VO(OiPr)3 35.0 | Pt–V–SnO2 | 72 | 6.4 (V) | 1.1 (Pt) | 2.8 | 151 |
| H2PtCl6·6H2O 8.75 | ||||||||
| 9 | 831 | Nb(OEt)5 35.0 | Pt–Nb–SnO2 | 80 | 5.7 (Nb) | 1.2 (Pt) | 2.7 | 136 |
| H2PtCl6·6H2O 8.75 | ||||||||
Characterization
Transmission electron microscopy (TEM) and scanning electron microscopy (SEM) images were acquired using a JEOL JEM-2100F microscope and a Hitachi SU8020 microscope, respectively. Energy-dispersive X-ray spectroscopy (EDX) were performed with an Oxford INCA X-Max 80 EDX spectrometer attached to the TEM instrument. X-ray diffraction (XRD) patterns were recorded using Rigaku SmartLab and Rigaku SmartLab SE diffractometers with nickel-filtered Cu Kα radiation (X-ray wavelength: 1.5418 Å). The crystallite sizes in SnO2 samples were determined using Scherrer's equation based on peaks at 2θ = 26.5° in the XRD profiles. X-ray fluorescence (XRF) analyses were performed using a Malvern Panalytical Epsilon 1. Inductively coupled plasma optical emission spectroscopy (ICP-OES) was performed using a Hitachi High-Tech Science PS3520UV-DD spectrometer. Nitrogen adsorption/desorption isotherms were obtained with a BELSORP-mini X and BELSORP-mini II. Specific surface areas were calculated by the Brunauer–Emmett–Teller (BET) method. Electrical resistance values were measured with a KEITHLEY source mater (model 2450) based on the four-terminal sensing technique under a pressure of 60 MPa using an 8 mg sample size. Microscopic Raman spectroscopy was performed using Horiba LabRAM HR-800 micro-Raman spectrometer with a laser excitation wavelength of 532.08 nm.Results and discussion
Synthesis of porous SnO2 spheres using nBu2Sn(OAc)2 as a Sn source
The organotin compound nBu2Sn(OAc)2 was initially used as a source of Sn because it is readily soluble in common organic solvents. Methanol was selected as a typical protic solvent for solvothermal reactions. Triethylene glycol, which has been used for the solvothermal synthesis of porous CeO2−x spheres,31 was employed as an additive. This compound can regulate the primary particle size and the morphologies of secondary particles by coordinating with Sn ions and the surfaces of the resultant particles. In initial trials, a methanol solution containing nBu2Sn(OAc)2 and triethylene glycol was heated at 300 °C for 10 min in an SUS-316 batch-type reactor (entry 1, Table 1). The crystal phase, crystallinity and morphology of the product were subsequently ascertained using X-ray diffraction (XRD) and scanning electron microscopy (SEM). The XRD profile of the product showed relatively sharp peaks and was completely different from a reference SnO2 pattern but consistent with that of Sn6O4(OH)4 (Fig. 1a(i)). Spherical particles with diameters of approximately 600 nm (Fig. 1b(i-1)) together with plate-like particles having sizes on the micrometer scale (Fig. 1b(i-2)) were observed in SEM images. Judging from the XRD pattern with relatively sharp peaks (Fig. 1a(i)), which indicates good crystallinity of the sample, and micrometer size plate particles observed in the SEM images, the plates are attributable to Sn6O4(OH)4. Sn6O4(OH)4 was obtained when similar solvothermal reactions were performed without any additive (entry 2) and with additives such as diethylene glycol (entry 3) and ethylenediamine (entry 5). Spherical particles and aggregates with larger plates and rods were observed in SEM images of the product made without any additive (Fig. 1b(ii)), while spheres with larger rods were generated when using diethylene glycol (Fig. 1b(iii)). Although the spherical particles agglomerated in the absence of an additive, no agglomeration of spheres was observed in the trials with diethylene glycol (Fig. 1b(iii)) and triethylene glycol (Fig. 1b(i-1)). These results indicate that the addition of oligoethylene glycols suppressed the aggregation of spherical secondary particles. The product made using ethylenediamine exhibited only large plates (Fig. 1b(v)) and was obtained in a lower yield compared with the reactions including oligoethylene glycols. The significant coordination of ethylenediamine with Sn ions likely inhibited the hydrolysis of the Sn source material. However, when using ethylene glycol (having only one oxyethylene unit; entry 4), the XRD pattern of the product was different from those of Sn6O4(OH)4 and SnO2 (Fig. 1a(iv)) and crystal phase of the product could not be identified. The existence of the intense peak appeared at 11.5° and many peaks around 30° suggest that the product could contain sheet-like structures, polycrystals and mixtures of several compounds. A variety of particle shapes, including spheres, cubes and thorny spheres (Fig. 1b(iv)), were observed in SEM images. These results suggest that the additives greatly affected the compositions and morphologies of the products. With the exception of the trial with ethylene glycol, the main product in all these reactions was Sn6O4(OH)4.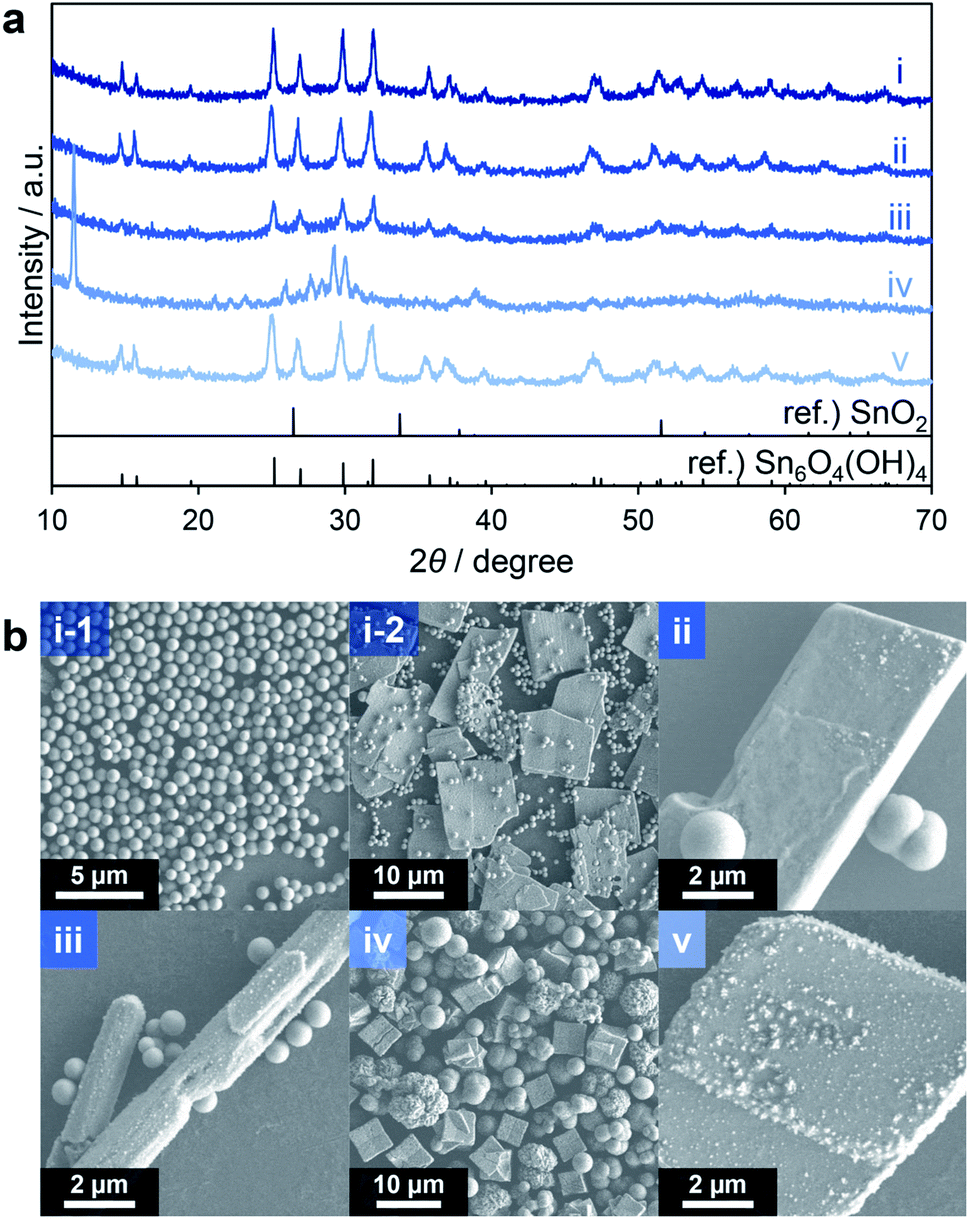 | ||
| Fig. 1 XRD patterns (a) and SEM images (b) of products corresponding to entries 1 (i), 2 (ii), 3 (iii), 4 (iv) and 5 (v) in Table 1. | ||
Interestingly, the reduction of the Sn ions from tetravalent Sn4+ in nBu2Sn(OAc)2 to divalent Sn2+ in Sn6O4(OH)4 occurred during the solvothermal reactions. It is possible that methanol acted as a reducing reagent at the high temperature applied during these reactions. To suppress this effect, aprotic solvents without hydroxy groups were tested. These included acetonitrile (entry 1 in Table 2), N,N-dimethylformamide (DMF; entry 2), tetrahydrofuran (THF; entry 3) and ethyl acetate (entry 4). When DMF was used no solid product was obtained, possibly because of the strong coordination of DMF to Sn ions and subsequent inhibition of the hydrolysis of the Sn source material. In contrast, the XRD pattern of the product obtained in acetonitrile showed weak peaks attributable to Sn6O4(OH)4 (Fig. 2a(i)). The materials generated using THF and ethyl acetate provided very broad diffraction profiles that appeared to correspond to SnO2 with low crystallinity (Fig. 2a(ii and iii)). These experiments confirmed that the use of aprotic solvents inhibited the formation of Sn6O4(OH)4, as expected. Both acetonitrile and THF generated agglomerates of spherical and irregularly shaped particles, respectively, as demonstrated by SEM images (Fig. 2b(i and ii)). However, monodisperse spheres were obtained in the case of ethyl acetate (Fig. 2b(iii)). Judging from these results, it can be inferred that the spherical particles in the products obtained through entries 1–5 in Table 1 can be ascribed to SnO2 with low crystallinity. Thus, the use of the relatively less polar aprotic solvents THF and ethyl acetate suppressed the formation of Sn6O4(OH)4 to yield the desired SnO2 porous spheres. However, in both trials, low yields of these spheres (less than 50% based on Sn ions in the precursor solution) were obtained, indicating that improvements were required.
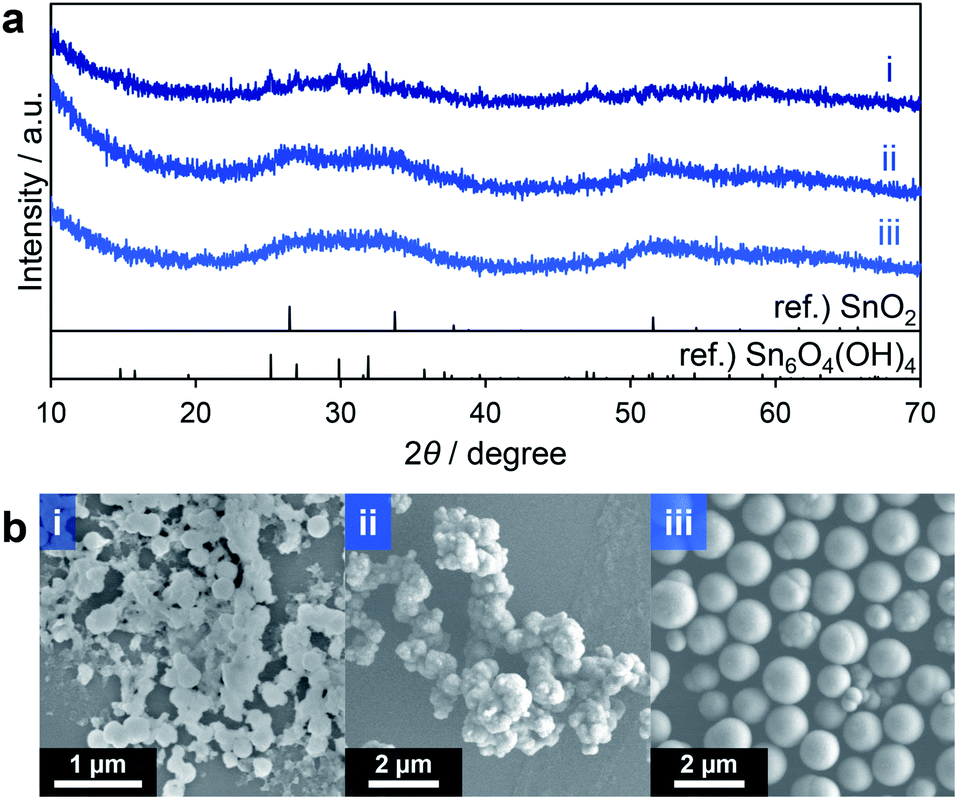 | ||
| Fig. 2 XRD patterns (a) and SEM images (b) of products corresponding to entries 1 (i), 3 (ii) and 4 (iii) in Table 2. | ||
From the above results, THF and ethyl acetate were both candidates for further studies. However, because THF can be oxidized to explosive peroxides by heating in air and because ethyl acetate gave highly spherical SnO2 particles, the latter was chosen. As a result of the optimization of the solvothermal reaction conditions using ethyl acetate as the solvent with a longer reaction time (30 min), the product yield was improved to 68% (calculated based on assumption that all of the products were SnO2, entry 5 in Table 2) although a mixture of yellow and black powders was obtained (insets to Fig. 3b(i and ii)). These two materials were separated by means of their different rates of precipitation from methanol and the black powder was found to comprise 25% of the total mass. The XRD profiles of these powders (Fig. 3a(i and ii)) clearly indicate that the yellow and black products corresponded to tin(IV) oxide (SnO2) and tin(II) oxide (SnO), respectively. SEM images revealed that the yellow powder had a spherical, agglomerated morphology (Fig. 3b(i)) while the black powder comprised larger rectangular particles (Fig. 3b(ii)). As noted above, Sn2+ in the form of SnO could be obtained via the reduction of Sn4+ species by triethylene glycol during the solvothermal reaction at a high temperature of 300 °C (representing an alcohol reduction). Thus, prolonging the reaction time improved the yield although the formation of SnO remained an issue.
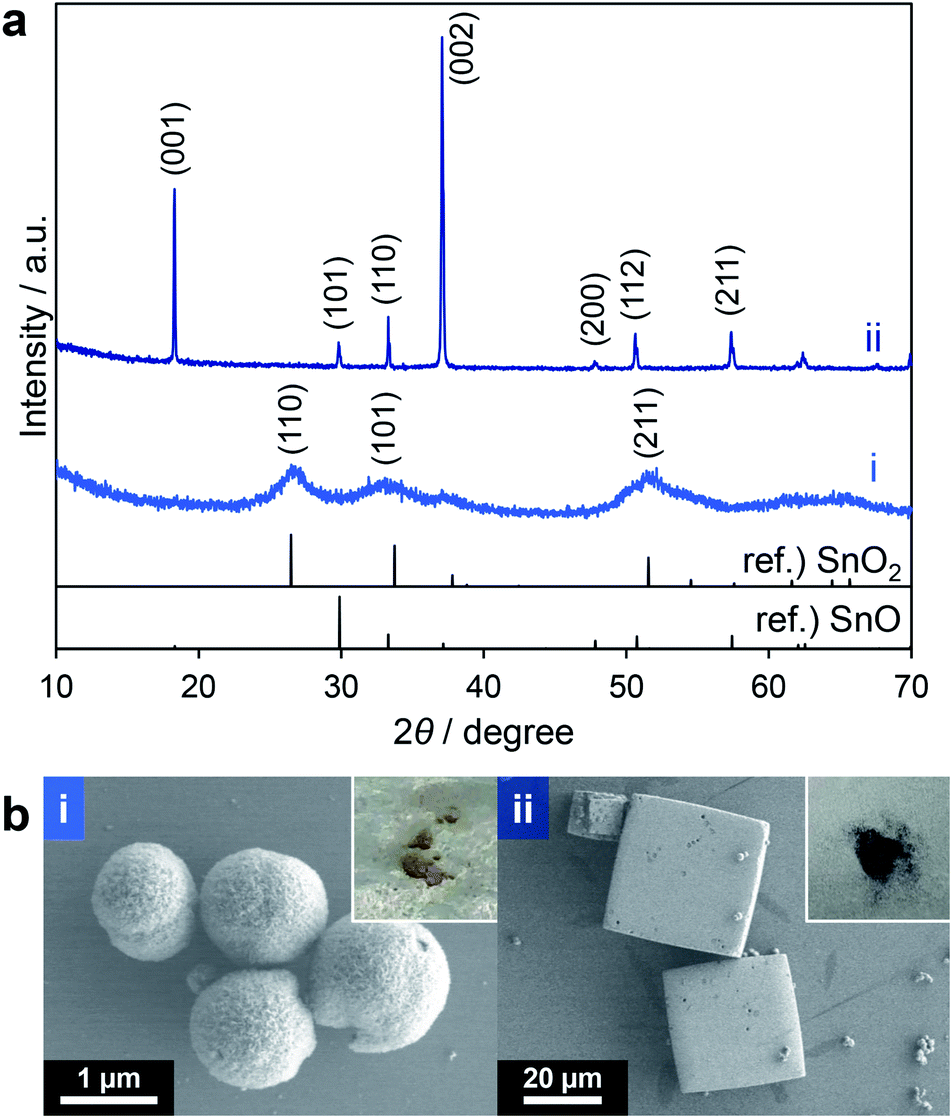 | ||
| Fig. 3 XRD patterns (a) and SEM images (b) of yellow (i) and black (ii) powder obtained by entry 5 in Table 2 (insets: photographs of powdery samples). | ||
Attempts were made to reduce the generation of SnO by using a lower amount of triethylene glycol and a lower reaction temperature. The quantity of triethylene glycol was reduced from 30 to 20 or 10 equiv. relative to the amount of Sn ions in the precursor solution (entries 1 and 2 in Table 3). When using 20 equiv., the proportion of the black powder in the product decreased to 2.0 wt%, while 10 equiv. gave only the yellow powder. These results confirm that SnO could be formed under a reducing atmosphere in the presence of a larger amount of triethylene glycol. The XRD patterns of the products clearly indicate that the yellow powders obtained from both reactions comprised SnO2 (Fig. 4a(i and ii)). The yellow and black powders generated using 20 equiv. were made of agglomerated spheres (Fig. 4b(i-1)) and large cuboid particles (Fig. 4b(i-2)), respectively. In the case of the 10 equiv. trial, the product was made of agglomerates of spheres (Fig. 4b(ii)). Consequently, it is clear that triethylene glycol effectively suppressed the agglomeration of the secondary particles. Thus, limiting the amount of triethylene glycol effectively inhibited the formation of SnO, although the secondary particles tended to aggregate together to form large agglomerates.
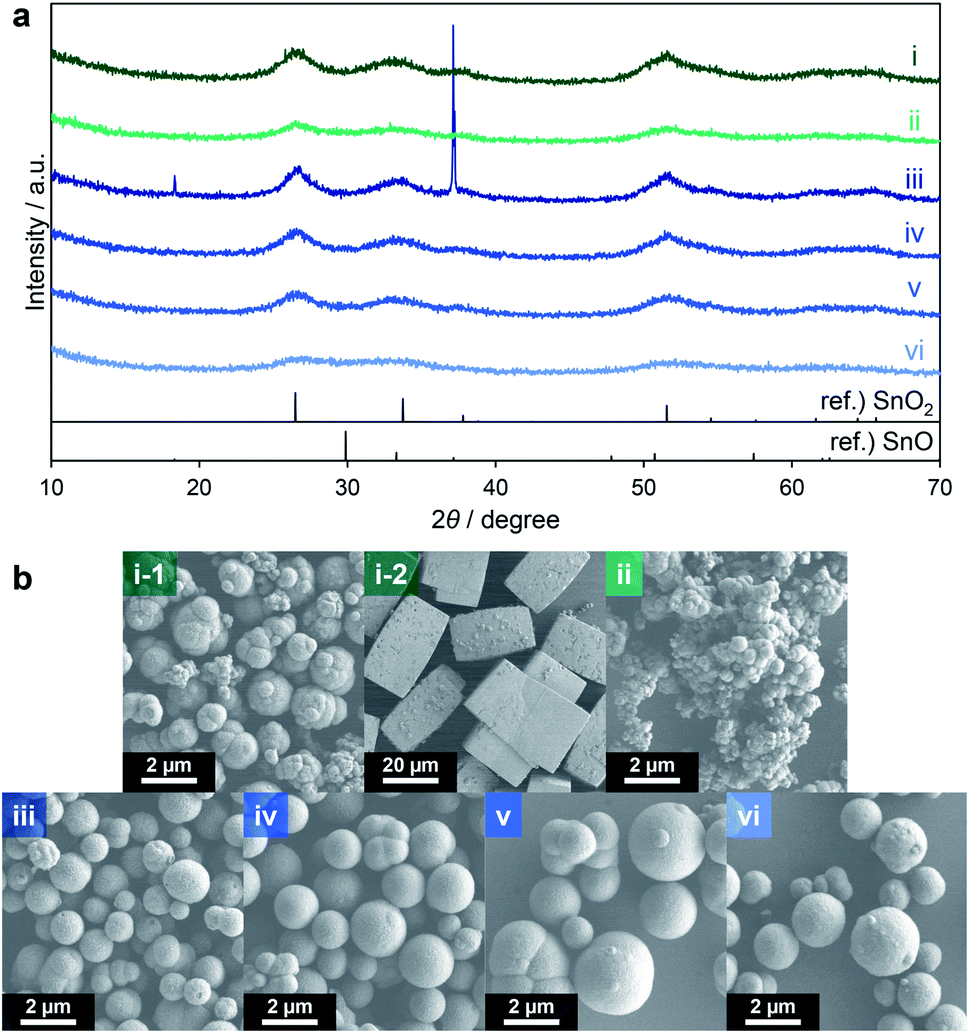 | ||
| Fig. 4 XRD patterns (a) and SEM images (b) of products corresponding to entries 1 (i), 2 (ii), 3 (iii), 4 (iv), 5 (v) and 6 (vi) in Table 3. | ||
Lowering the reaction temperature was examined as another means of suppressing the appearance of SnO. Temperatures of 290, 280, 270 and 250 °C were employed (entries 3–6) and the reaction time was prolonged to 120 min. The product obtained from the reaction at 290 °C contained about 20 wt% black powder (entry 3) while the materials generated at 280 and 270 °C contained only negligible amounts of black powder (entries 4 and 5). Finally, only yellow powder was produced at 250 °C (entry 6). The XRD pattern of the product of the reaction at 290 °C showed a broad SnO2 profile as well as a sharp SnO peak (Fig. 4a(iii)) whereas the patterns of the products from the reactions at 280, 270 and 250 °C did not show SnO peaks but rather a broad profile consistent with SnO2 (Fig. 4a(iv–vi)). The specific surface areas of the materials resulting from trials at 280, 270 and 250 °C determined by the Brunauer–Emmett–Teller (BET) method were 178, 185 and 187 m2 g−1, respectively (as determined after pretreatment at 250 °C for 240 min). The reactions at 280 and 270 °C also gave SnO2 in relatively high yields of approximately 60%.
This systematic survey of the reaction conditions for the solvothermal synthesis of SnO2 allowed the preparation of monodisperse SnO2 porous spheres by lowering the reaction temperature. Meanwhile, ethyl acetate is not the best solvent for the synthesis of SnO2-based composites because of the low solubility of common inorganic metal source compounds in this solvent. Therefore, we reconsidered the reaction conditions, especially the solvent, so as to improve the dissolution of the inorganic materials.
Synthesis of porous SnO2 spheres using SnCl4·5H2O
With the aim of developing versatile reaction conditions for the synthesis of SnO2-based composites, further study of the various parameters, especially the solvent, was conducted. Methanol is a representative protic polar solvent that dissolves many inorganic compounds. However, as discussed above, when methanol was used as the solvent Sn6O4(OH)4 was readily generated as a byproduct. In these trials, nBu2Sn(OAc)2 was replaced with the common compound SnCl4·5H2O even though this was expected to generate HCl during the reaction. Consequently, the SUS-316 reactor was replaced by a Teflon sleeve reactor to avoid corrosion by HCl. Based on the data discussed in the former section, solvothermal reactions using a precursor solution containing SnCl4·5H2O, triethylene glycol and methanol were performed. Reaction temperatures of 180 and 200 °C were chosen so as to remain below the safe limit for the Teflon lining (230 °C). Although no solid product was obtained in the case of the reaction at 180 °C for 60 min, the trial at 200 °C for 60 min (Table 4) gave a colorless powdery product in a high yield (80%), suggesting that the hydrolysis of SnCl4 in methanol requires a high temperature. The XRD pattern of the product was consistent with SnO2 (Fig. 5d) and the average secondary particle size was estimated to be 250 ± 50 nm based on SEM images (Fig. 5a). Transmission electron microscopy (TEM) images revealed that the spheres were composed of aggregated primary particles several nanometers in size and had concave–convex surface structures (Fig. 5b and c). SnCl4 in methanol can produce Sn(OH)4 via the formation of Sn(OMe)4 followed by hydrolysis more readily than nBu2Sn(OAc)2 can, which could explain the lack of Sn6O4(OH)4 and SnO as byproducts. The higher-order structure formed by fine primary particles is one of the most important properties of materials used as gas adsorbents or supports for catalyst nanoparticles. As such, nitrogen adsorption/desorption analyses were also conducted to evaluate the specific surface areas of the porous SnO2. The BET specific surface area of the product was as high as 219 m2 g−1 (following pretreatment at 250 °C for 240 min). Even after calcination at 400 °C for 60 min, the value was relatively high at 105 m2 g−1 (following pretreatment at 100 °C for 60 min, Fig. S1†). Thus, porous SnO2 possessing a high specific surface area was synthesized by the solvothermal reaction using methanol as the solvent. This optimized method was subsequently applied to the further synthesis of a variety of porous SnO2 composites with various hetero-elements.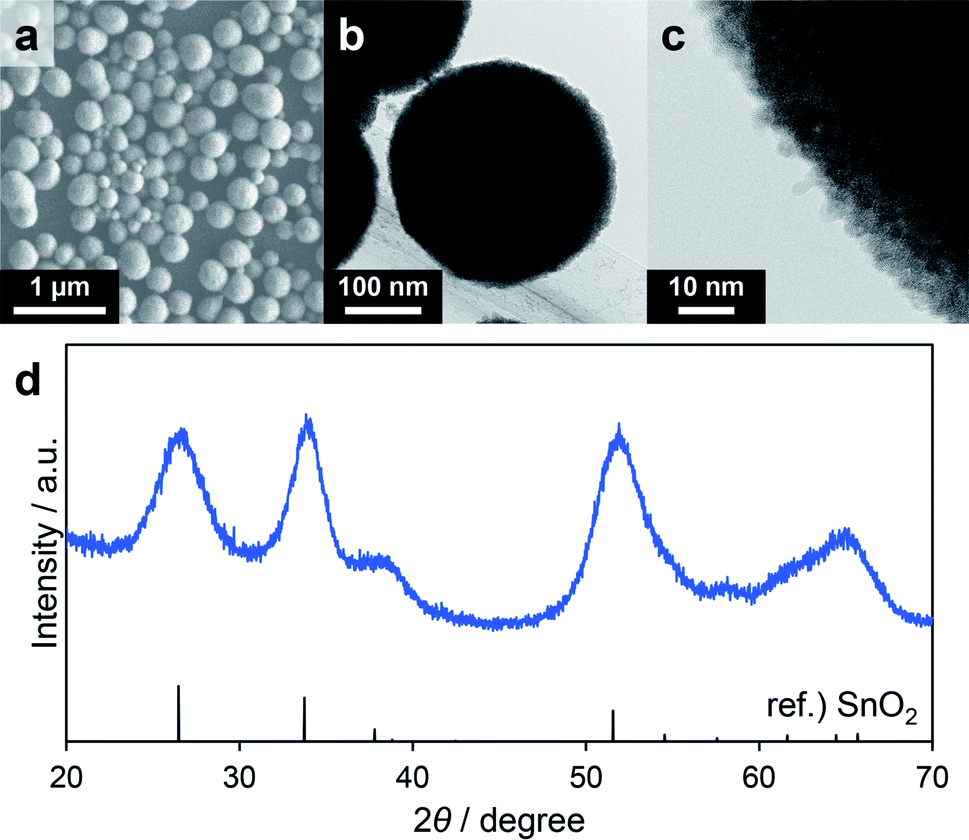 | ||
| Fig. 5 SEM image (a), low (b) and high (c) magnification TEM images and XRD pattern (d) of the porous SnO2 spheres corresponding to entry 1 in Table 4. | ||
Evaluation of electrical conductivity
The electrical conductivity of the porous SnO2 corresponding to entry 1 in Table 4 was evaluated by performing electrical resistance measurements. As a comparison, the value for S-2000 (ref. 32) was also determined. This material comprises commercially available SnO2 nanoparticles with a specific surface area of 63 m2 g−1 (following pretreatment at 250 °C for 240 min) and a crystallite size of 4.8 nm (as determined using Scherrer's equation). Resistance values were measured using a source meter with a constant current (5 mA) applied to the sample under a pressure of 60 MPa. Prior to these experiments, the porous SnO2 was calcined at 400 °C for 60 min to remove organic residue. The electrical conductivity of the porous SnO2 spheres was determined to be 7.67 × 10⁻¹ S cm−1, which was higher than that of the commercial SnO2 (1.98 × 10⁻² S cm−1). Generally, porous materials with higher specific surface areas (meaning smaller primary particle sizes) tend to exhibit lower electrical conductivity due to the effect of resistance between grain boundaries. However, the present porous SnO2 spheres showed higher electrical conductivity than the S-2000. Because they provide a high specific surface area and increased electrical conductivity, the porous SnO2 spheres made in this work are good candidates for applications as catalyst supports in fuel cells and as conductive electrode materials in Li-ion/Na-ion secondary batteries. Porous SnO2 and S-2000 were also characterized by microscopic Raman spectroscopy (Fig. S2†) to know the influence of crystal disorders and oxygen defects on their semiconductor properties. They showed signals at 631 cm−1 and 621 cm−1, respectively, corresponding to well-known A1g mode. However, in the case of porous SnO2, an additional broad Raman peak was observed at 568 cm−1. This Raman peak can correspond to band S1, which is attributable to disorders and oxygen defects on the surface of SnO2 nanoparticles as Diéguez et al. reported.33 Generally, crystallinity of surface region in crystals is lower than that of inside ones, of which low crystallinity usually results in disorders and defects in the crystals. In addition, nanocrystals with smaller crystallite size show higher ratio of surface atoms to core atoms, which would lead to more disorders and defects in the surface of nanocrystals in proportion to surface area. Judging from the observed small primary particle size, high specific surface area, and presence of band S1 in Raman spectrum of porous SnO2, porous SnO2 can possess a large amount of oxygen defects as compared to S-2000.Synthesis of SnO2-based composites
The optimized reaction conditions, comprising SnCl4·5H2O, triethylene glycol, methanol, 200 °C and 60 min, were subsequently used to fabricate SnO2-based composites. As shown in Table 4, P, V, Nb, Pd and Pt were combined with SnO2 as the additional elements. SnO2 composites with P, V or Nb as the second element and Pt as a third element were also synthesized using a similar procedure. In all cases, the reaction proceeded well to give the desired product containing the second and/or third element in high yields (Table 4). X-ray fluorescence (XRF) analyses confirmed that each element was present in approximately the same proportion as in the precursor solution, especially in the case of Pd and Pt. Even the reactions that gave low yields provided products in which the elemental ratios were approximately the same as those in the precursor solutions. These results suggest that the hydrolysis of each source material proceeded almost simultaneously and with similar reaction rates. The XRD patterns of all products were consistent with that of SnO2 (Fig. S3†). The crystallite sizes of the as-synthesized materials and the same products after calcination at 400 °C for 60 min as evaluated using Scherrer's equation were consistently less than 5 nm. In the case of the Pd–SnO2, a small diffraction peak consistent with Pd3Sn appeared at 39.6° (Fig. S3d†). Diffraction peaks related to vanadium oxide, niobium oxide, Pd or Pt were not observed, and so it appears that each element was homogeneously intermingled with the SnO2. Nitrogen adsorption/desorption analyses after calcination at 400 °C for 60 min revealed that all samples had high specific surface areas of more than 100 m2 g−1 (Fig. S4†). In particular, the composites with P, P–SnO2 and Pt–P–SnO2, exhibited high specific surface areas of approximately 170 m2 g−1 even after high temperature calcination. The incorporation of P into the SnO2 could partially formed P–SnO2 phase, resulting in exceptional thermal stability.34 Spherical particles were observed in SEM images and energy-dispersive X-ray (EDX) analyses demonstrated that the additional elements were uniformly distributed throughout each spherical particle (Fig. 6). Local aggregation of the hetero-elements was not observed, suggesting that all raw materials reacted almost simultaneously and were incorporated into the primary particles of SnO2. Several other composites were also easily synthesized under the same reaction conditions (entry 1 in Table 4), with the exception of Rh–SnO2 spheres. The reaction using Rh(acac)3 resulted in very low yields of less than 5% (entry 1 in Table S1†). The addition of formic acid as an acid catalyst (entry 2), an elevated temperature (220 °C, entry 3) and a prolonged reaction time (120 min, entry 4) did not improve the yield. Interestingly, the simple addition of water (1.0 mL) to the precursor solution accelerated the reaction of Rh and Sn ions (entry 5). Rh–SnO2 spheres were obtained in a high yield of 85% with a Rh content of 1.1 at%. The XRD pattern of the product was consistent with SnO2 and the material exhibited relatively high crystallinity and a crystallite size of 5.5 nm (Fig. S6a†). Spherical secondary particles and their agglomerates were observed in SEM images (Fig. S7a†). In contrast, Ru–SnO2 could not be readily obtained. A similar reaction using RuCl3·3H2O produced a powdery product in a high yield of 89% (entry 6 in Table S1†). Moreover, subsequent trials conducted a reduced amount of triethylene glycol (entry 7), a higher reaction temperature (220 °C, entry 8) and a different Ru source (Ru(acac)3, entry 9). Each reaction gave a powdery product in high yield (Fig. S6b–e and S7b–e†) but with a Ru level of less than 0.2 at% (as determined by inductively coupled plasma optical emission spectroscopy (ICP-OES)). Here, ICP-OES was used instead of XRF because the characteristic X-ray energies of Ru and Cl overlapped. The low reactivity and slow reaction rate of the Ru source material could possibly explain these results. Based on our prior results, a higher temperature of 300 °C could promote the hydrolysis of the Ru source material but the use of a Teflon apparatus precluded this temperature. In any case, this work succeeded in producing SnO2 spheres and SnO2 composite spheres using simple solvothermal reactions.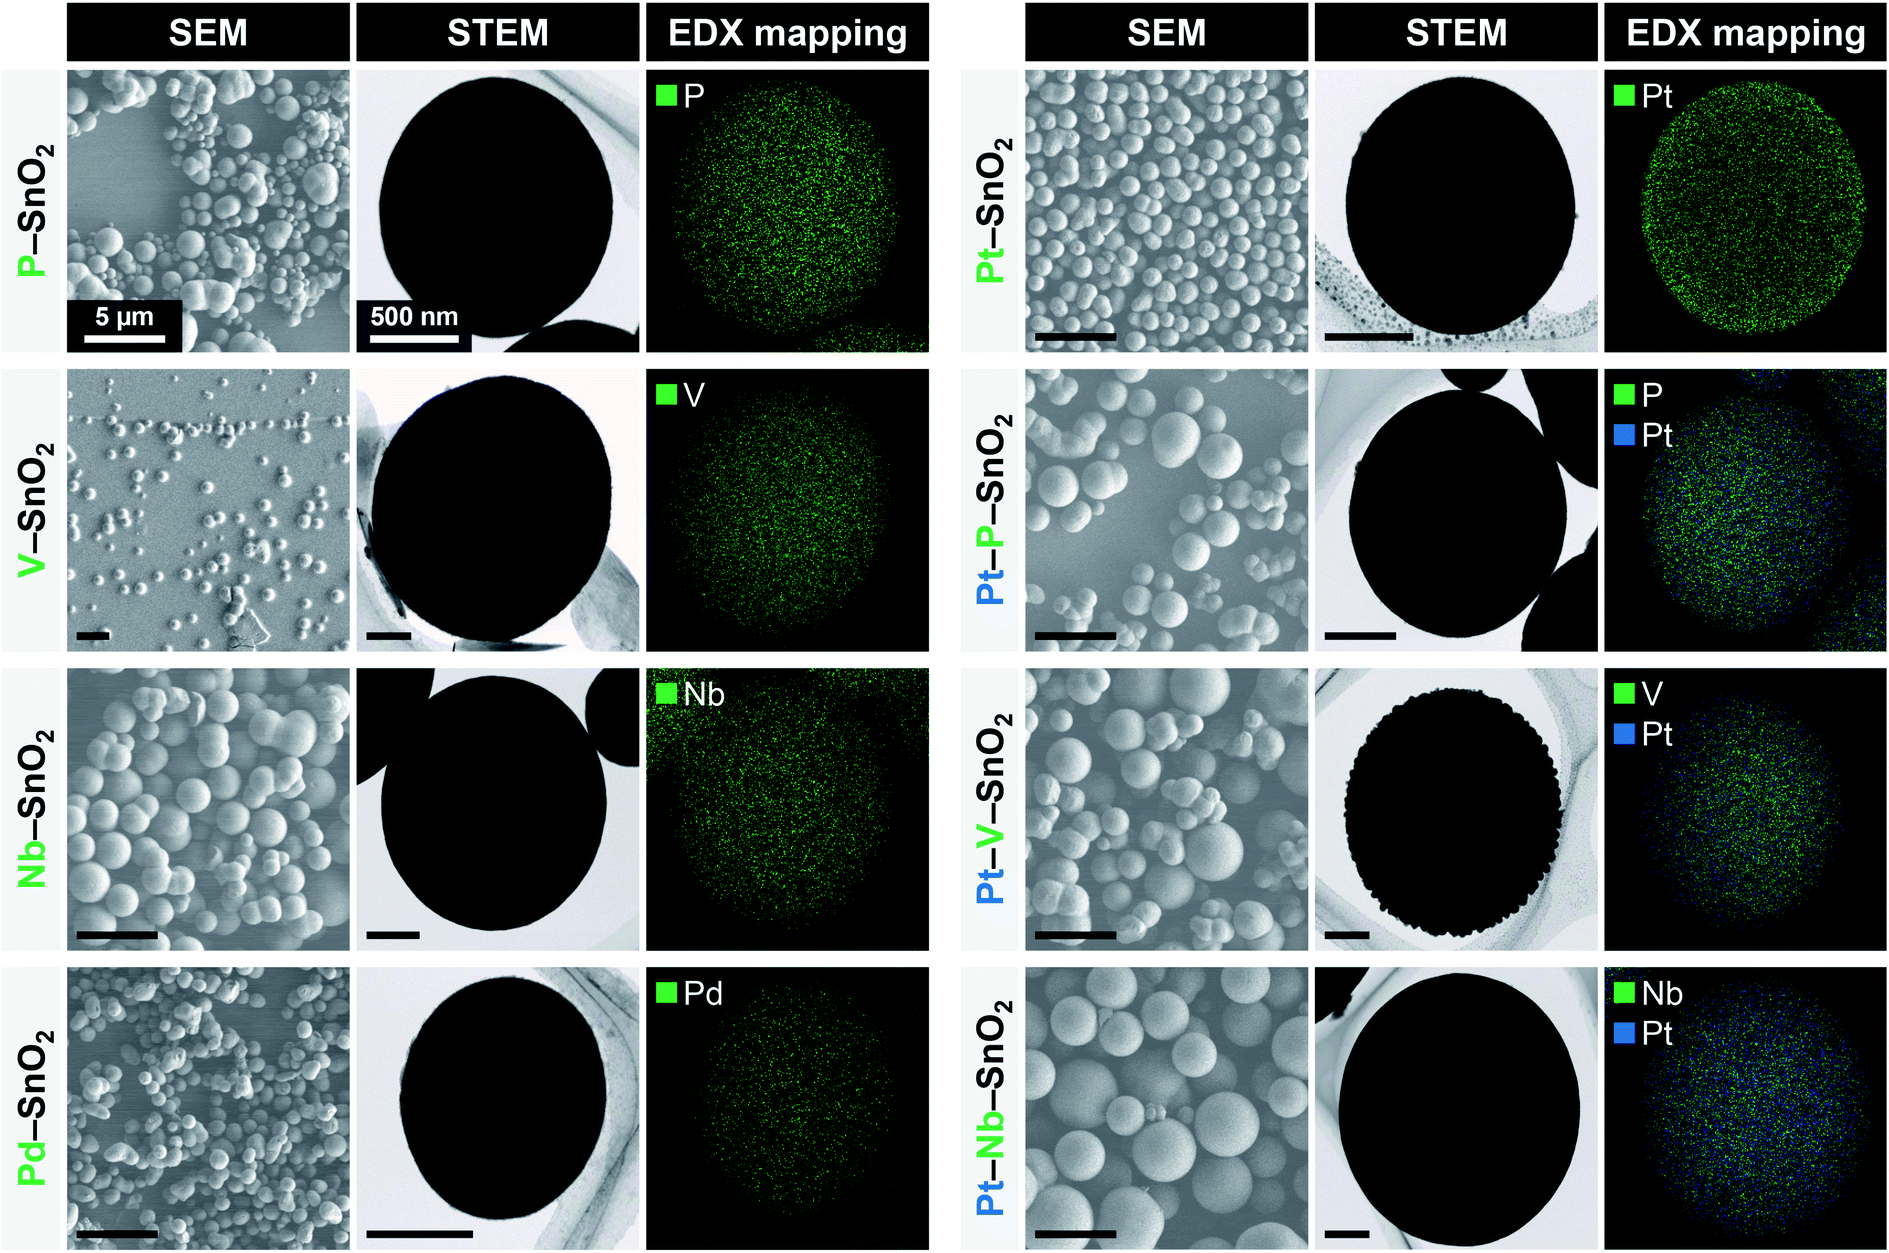 | ||
| Fig. 6 SEM, STEM and EDX mapping images of SnO2-based composites. Scale bars in SEM and STEM images indicate 5 μm and 500 nm, respectively. EDX spectra of SnO2-based composites are shown in Fig. S5.† | ||
Conclusions
The effects of solvothermal reaction conditions on the composition and morphology of the resulting SnO2 were investigated in detail. Using nBu2Sn(OAc)2 as the Sn source material, SnO2, SnO and Sn6O4(OH)4 were afforded as products depending on the reaction parameters that were employed, such as the solvent and temperature. A simple one-pot technique using SnCl4·5H2O as the Sn source, triethylene glycol as an additive and methanol as the solvent readily produced porous SnO2 spheres. This material had a high specific surface area of 105 m2 g−1 even after calcination and an electrical conductivity higher than that of commercial SnO2. Moreover, this method was applied to the fabrication of various SnO2-based composites. Thus, a facile, versatile and useful technique for the synthesis of porous SnO2-based composites was devised.Author contributions
Ayano Taniguchi: conceptualization, data curation, formal analysis, investigation, methodology, visualization, writing – original draft, writing – review & editing. Rei Miyata: data curation, formal analysis, investigation. Masataka Ohtani: conceptualization, funding acquisition, methodology, project administration, resources, supervision, writing – review & editing. Kazuya Kobiro: funding acquisition, project administration, resources, supervision, writing – review & editing.Conflicts of interest
There are no conflicts to declare.Acknowledgements
This work was supported by the JSPS KAKENHI (grant number 19K05143) and this paper is based on results obtained from a project commissioned by the New Energy and Industrial Technology Development Organization (NEDO) grant number P20003. We thank Dr Yoshiro Ohgi of Kumamoto Industrial Research Institute for the measurements of electrical conductivity. We thank Edanz (https://jp.edanz.com/ac) for editing a draft of this manuscript.References
- G. K. Dalapati, H. Sharma, A. Guchhait, N. Chakrabarty, P. Bamola, Q. Liu, G. Saianand, A. M. Sai Krishna, S. Mukhopadhyay, A. Dey, T. K. S. Wong, S. Zhuk, S. Ghosh, S. Chakrabortty, C. Mahata, S. Biring, A. Kumar, C. S. Ribeiro, S. Ramakrishna, A. K. Chakraborty, S. Krishnamurthy, P. Sonar and M. Sharma, J. Mater. Chem. A, 2021, 9, 16621–16684 RSC.
- E. P. Nascimento, H. C. T. Firmino, G. A. Neves and R. R. Menezes, Ceram. Int., 2022, 48, 7405–7440 CrossRef CAS.
- X. Kang, N. Deng, Z. Yan, Y. Pan, W. Sun and Y. Zhang, Mater. Sci. Semicond. Process., 2022, 138, 106246 CrossRef CAS.
- F. Zoller, D. Bohm, T. Bein and D. Fattakhova-Rohlfing, ChemSusChem, 2019, 12, 4140–4159 CrossRef CAS PubMed.
- Q. Jiang, X. Zhang and J. You, Small, 2018, 14, e1801154 CrossRef PubMed.
- Z. Zhang, J. Liu, J. Gu, L. Su and L. Cheng, Energy Environ. Sci., 2014, 7, 2535–2558 RSC.
- X. Kou, C. Wang, M. Ding, C. Feng, X. Li, J. Ma, H. Zhang, Y. Sun and G. Lu, Sens. Actuators, B, 2016, 236, 425–432 CrossRef CAS.
- G. Cognard, G. Ozouf, C. Beauger, I. Jiménez-Morales, S. Cavaliere, D. Jones, J. Rozière, M. Chatenet and F. Maillard, Electrocatalysis, 2017, 8, 51–58 CrossRef CAS.
- J. Li, J. Xian, W. Wang, K. Cheng, M. Zeng, A. Zhang, S. Wu, X. Gao, X. Lu and J.-M. Liu, Sens. Actuators, B, 2022, 352, 131061 CrossRef CAS.
- K. S. Choi, S. Park and S.-P. Chang, Sens. Actuators, B, 2017, 238, 871–879 CrossRef CAS.
- M. H. Raza, N. Kaur, E. Comini and N. Pinna, ACS Appl. Mater. Interfaces, 2020, 12, 4594–4606 CrossRef CAS PubMed.
- K. Kakinuma, K. Suda, R. Kobayashi, T. Tano, C. Arata, I. Amemiya, S. Watanabe, M. Matsumoto, H. Imai, A. Iiyama and M. Uchida, ACS Appl. Mater. Interfaces, 2019, 11, 34957–34963 CrossRef CAS PubMed.
- D. Ju, H. Xu, Q. Xu, H. Gong, Z. Qiu, J. Guo, J. Zhang and B. Cao, Sens. Actuators, B, 2015, 215, 39–44 CrossRef CAS.
- S. W. Park, S. Y. Jeong, J. W. Yoon and J. H. Lee, ACS Appl. Mater. Interfaces, 2020, 12, 51607–51615 CrossRef CAS PubMed.
- Y. Xu, L. Zheng, C. Yang, W. Zheng, X. Liu and J. Zhang, ACS Appl. Mater. Interfaces, 2020, 12, 20704–20713 CrossRef CAS PubMed.
- D. Sun, X. Tang, S. Li and L. Liu, J. Phys. Chem. C, 2021, 125, 11107–11114 CrossRef CAS.
- A. Ahmed, M. N. Siddique, T. Ali and P. Tripathi, Appl. Surf. Sci., 2019, 483, 463–471 CrossRef CAS.
- J. Yang, J. Zhang, B. Zou, H. Zhang, J. Wang, U. Schubert and Y. Rui, ACS Appl. Nano Mater., 2020, 3, 4265–4273 CrossRef CAS.
- H. Wang and A. L. Rogach, Chem. Mater., 2014, 26, 123–133 CrossRef CAS.
- Z. Li, Q. Zhao, W. Fan and J. Zhan, Nanoscale, 2011, 3, 1646–1652 RSC.
- L. Zhang, R. Tong, W. Ge, R. Guo, S. E. Shirsath and J. Zhu, J. Alloys Compd., 2020, 814, 152266 CrossRef CAS.
- P. Duan, H. Xiao, Z. Wang, Q. Peng, K. Jin and J. Sun, Sens. Actuators, B, 2021, 346, 130557 CrossRef CAS.
- D. Meng, D. Liu, G. Wang, Y. Shen, X. San, M. Li and F. Meng, Sens. Actuators, B, 2018, 273, 418–428 CrossRef CAS.
- Q. Wang, X. Kou, C. Liu, L. Zhao, T. Lin, F. Liu, X. Yang, J. Lin and G. Lu, J. Colloid Interface Sci., 2018, 513, 760–766 CrossRef CAS PubMed.
- K. M. Zhu and S. Y. Ma, Mater. Lett., 2019, 236, 491–494 CrossRef CAS.
- W. Bi, W. Xiao and S. Liu, J. Mater. Sci., 2021, 56, 6095–6109 CrossRef CAS.
- D. Xue, P. Wang, Z. Zhang and Y. Wang, Sens. Actuators, B, 2019, 296, 126710 CrossRef CAS.
- P. Wang, K. Ueno, H. Takigawa and K. Kobiro, J. Supercrit. Fluids, 2013, 78, 124–131 CrossRef CAS.
- M. Ohtani, T. Muraoka, Y. Okimoto and K. Kobiro, Inorg. Chem., 2017, 56, 11546–11551 CrossRef CAS PubMed.
- E. K. C. Pradeep, M. Ohtani, T. Kawaharamura and K. Kobiro, Chem. Lett., 2017, 46, 940–943 CrossRef CAS.
- A. Taniguchi, Y. Kumabe, K. Kan, M. Ohtani and K. Kobiro, RSC Adv., 2021, 11, 5609–5617 RSC.
- Mitsubishi Materials Electronic Chemicals Co., Ltd., https://www.mmc-ec.co.jp/eng/transparent-conductive-materials/antimony-free-transparent-electro-conductive-powder/, accessed, May 2022.
- A. Diéguez, A. Romano-Rodríguez, A. Vilà and J. R. Morante, J. Appl. Phys., 2001, 90, 1550–1557 CrossRef.
- L. Kőrösi, S. Papp, V. Meynen, P. Cool, E. F. Vansant and I. Dékány, Colloids Surf., A, 2005, 268, 147–154 CrossRef.
Footnote |
| † Electronic supplementary information (ESI) available. See https://doi.org/10.1039/d2ra03403d |
| This journal is © The Royal Society of Chemistry 2022 |