DOI:
10.1039/D2RA03268F
(Paper)
RSC Adv., 2022,
12, 18559-18571
Multiple chemical modifications and Cd2+ adsorption characteristics of sludge-based activated carbon
Received
25th May 2022
, Accepted 13th June 2022
First published on 23rd June 2022
Abstract
Sludge resource utilization is commonly realized through carbonization, but the use of direct carbonization to obtain sludge-based activated carbon (SAC) is not functional yet. The multiple chemical modifications were carried out to achieve N-doping and pore-making to modify SAC. The SACU–PF′ was synthesized by activating sludge simultaneously with uric acid and potassium ferrate. Moreover, SACN′, SACU, and SACPF′ were prepared with no additives, uric acid, and potassium ferrate, respectively. The results indicated that the different modifications affected the chemical properties and structure of SAC. The BET of SACU–PF′ was 56.73 m2 g−1, which was higher than that of SACN′ and SACPF′. SACU–PF′ possessed abundant functional groups, such as C![[double bond, length as m-dash]](https://www.rsc.org/images/entities/char_e001.gif) N and C–O. The adsorption capacity of SACU–PF′ for Cd2+ was 9.69 mg g−1, 5.5 times that of SACN′, the adsorption process of Cd2+ by SACU–PF′ fitted well for the second-order kinetic model and Langmuir isothermal adsorption model. The XPS and chemical analysis revealed that SACU–PF′ and Cd2+ were bonded by functional groups, and the Cd2+ removal by SACU–PF′ was through complexation, anion exchange, electrostatic attraction, and pore filling. The SACU–PF′ was exhibited different removal capacities for different metals, Pb2+ and Mn2+ correspond to adsorption capacities of 4.9 and 8.1 mg g−1. In addition, the adsorbed SACU–PF′ can be regenerated by sodium hydroxide. The study highlights the importance of multiple chemical modifications performed on SAC, the double coupled chemical modifications to ensure its good performance in the treatment of heavy metals in wastewater treatment.
N and C–O. The adsorption capacity of SACU–PF′ for Cd2+ was 9.69 mg g−1, 5.5 times that of SACN′, the adsorption process of Cd2+ by SACU–PF′ fitted well for the second-order kinetic model and Langmuir isothermal adsorption model. The XPS and chemical analysis revealed that SACU–PF′ and Cd2+ were bonded by functional groups, and the Cd2+ removal by SACU–PF′ was through complexation, anion exchange, electrostatic attraction, and pore filling. The SACU–PF′ was exhibited different removal capacities for different metals, Pb2+ and Mn2+ correspond to adsorption capacities of 4.9 and 8.1 mg g−1. In addition, the adsorbed SACU–PF′ can be regenerated by sodium hydroxide. The study highlights the importance of multiple chemical modifications performed on SAC, the double coupled chemical modifications to ensure its good performance in the treatment of heavy metals in wastewater treatment.
1. Introduction
The wastewater treatment process will produce large quantities of sludges. The current ways of sludge treatment and disposal are mainly landfill or incineration; in these processes, the resource utilization rate of sludge is low. It is well known that the sludge contains abundant organic matter, like tung wood and other materials, the characteristic suggest that sludge can be used to prepare sludge-based activated carbon (SAC). The SAC is like activated carbon, which can be used in adsorption, catalysis, and in other fields. Therefore, the technology of preparing activated carbon or carbon-based carrier from sludge has become an important alternative for future urban sludge treatment, disposal, and resource utilization.1,2 However, SAC formed by direct carbonization of sludge is associated with some demerits such as small specific surface area, small pore volume, and poor adsorption capacity. To solve these problems, chemical modification has been widely used to change the structural characteristics of SAC and improve its application performance. Chemical treatment is an excellent approach for modifying SAC, wherein the precursor is activated with chemical reagents, and then heat treatment is performed at a relatively high temperature, which can significantly improve the structure of SAC and change the pore size distribution of SAC. This, in turn, increases the functionality of SAC. Chemical activation mainly includes acid activation (HCl, HNO3, H2SO4, H3PO4, urea), alkali activation (NaOH, KOH, Fe(OH)3), salt activation (ZnCl2, FeCl3), nitridation, and graphitization.3–5 Wu6 has utilized HCl, HNO3, and NaOH to modify sludge. Kang7 used KOH to activate sludge obtained from a paper mill and prepared activated carbon to adsorb heavy metals, and the results showed monolayer adsorption. Salt activation is also commonly used in the carbonization process of sludge, and the literature suggests that ZnCl2 plays a major role in dehydration and vaporization, converting sludge into a high specific area SAC. Kong8 developed a new process of pickling and pyrolysis using citric acid and ZnCl2 mixed pore-forming agent to improve the performance of SAC. In the process, ZnCl2 was used as the activator to obtain the maximum surface area. Studies have shown that adding pyrolusite by chemical activation method can result in a new SAC and can effectively remove heavy metal ions in wastewater.9,10 Recently, many researchers have shown interest in the adsorption properties of carbon-based materials. Among them, graphite-phase carbon nitride materials exhibited high chemical stability, good compatibility, more concentrated pore structure, high porosity, rich hydroxyl and carboxyl groups on the surface, and possessed great potential in the adsorption of heavy metals from wastewater.11 For example, Yang12 studied the removal of Cu2+, and the adsorption capacity was up to 46.6 mg g−1. Zhu13 obtained carbon nitride by directly roasting melamine and adsorbing Pb2+ with this material. The maximum adsorption capacity exhibited by the carbon nitride material for Pb2+ was 7.4 mg g−1 in the experiment. Beygli14 used hydroxyapatite modified carbon nitride powder to adsorb Cu2+, and a striking increase in the adsorption capacity (74.5 mg g−1) was observed. With the continuous acceleration of the industrial processes, many heavy metals are discharged into the environment together with industrial wastewater. Even a low concentration of heavy metals (Cd, Pb, Mn) are potentially toxic and carcinogenic, and their arbitrary discharge will seriously affect human health.11 The adsorption method is considered to be the simplest and most effective method to remove heavy metals. Particularly, the adsorption of low-concentration heavy metals from wastewater has obvious advantages. The adsorbent, after adsorption, is also easy to recover or remove from the water medium, making it the most common water treatment method.15 Therefore, SAC can be used as an adsorption material, and chemical modification can improve its adsorption capacity. Certain types of functional groups on the surface of SAC can effectively combine with toxic metal ions.
In the present work, two common, simple, and green activators of K2FeO4 and urea (CH4N2O) were used to change the structure of SAC. This was mainly to prepare a graphitized nitriding sludge carbon material from sludge carbon by nitrogen doping method, to improve its adsorption capacity. In this work, CH4N2O and K2FeO4 were used as chemical activators to prepare four kinds of SAC, and their properties were analyzed. The adsorption behavior of toxic metal ion Cd2+ was subjected to study, and the adsorption mechanism was explored by model analysis. An insight is given into the practical application of the SAC.
2. Materials and methods
2.1 Materials and reagents
The sludge was collected from the sewage treatment plant of the Hefei economic development zone. Reagents, including K2FeO4, CH4N2O, HCl (36.5%), NaOH, NaCl, Cd(NO3)2, Pb(NO3)2, Mn(NO3)2, and ethylenediamine tetraacetic acid (EDTA) were purchased from Sinopharm Chemical Reagent Co, Ltd. All chemicals were employed without further purification, and the solutions were prepared using deionized water.
2.2 Preparation of SAC
The sludge was dried at 105 °C, crushed, and then screened (80 mesh) to obtain the pretreatment sludge samples. The pre-treated sludge samples were carbonized into sludge charcoal by heating at 5 °C min−1 to 500 °C for 120 min in an N2 atmosphere. Then, 25 g of the so treated sludge charcoal was weighed and immersed in pure water, 250 mL of 1 mol L−1 CO(NH2)2 solution, 250 mL of 1 mol L−1 K2FeO4 solution, a mixture of 250 mL of 1 mol L−1 CO(NH2)2 and 1 mol L−1 K2FeO4, respectively, for 6 h. The samples were then dried at 80 °C, and the dried samples were heated to 800 °C at a rate of 5 °C min−1 under an N2 atmosphere and maintained under the same condition for about 120 min. Then the four samples were screened through 200 mesh and soaked in 0.5 mol L−1 HCl for 2 h. The samples were then washed with deionized water repeatedly until neutral and dried until constant weight. The samples are denoted as SACN′, SACU, SACPF′, and SACU–PF′, respectively. A schematic diagram of preparation and reaction is represented in Fig. 1.
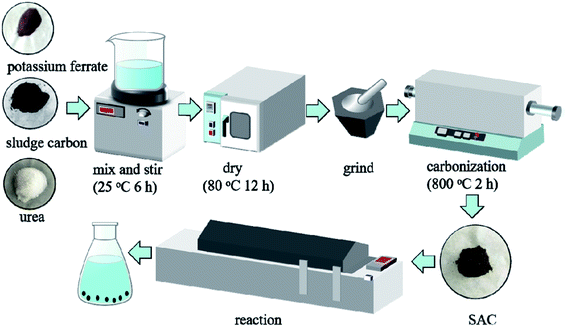 |
| | Fig. 1 Schematic diagram of preparation and reaction. | |
2.3 Characterization methods
The SAC was analyzed by scanning electron microscopy (SEM) using SU8010 cold-field emission scanning electron microscope (Hitachi Company, Japan). The SAC was also analyzed by FEI-Talos-F200X (Thermo FEI, USA) transmission electron microscope (TEM). TD-3500 X-ray diffractometer (Dandong Tongda) was utilized to obtain X-ray diffraction (XRD) patterns of the SAC. The X-ray photoelectron spectroscopic (XPS) data were obtained using the Thermo Fisher K-alpha XPS instrument (Thermo Field). The SAC was scanned by using the Nicolet IS 50+ Continuum Fourier Transform Infrared Spectrometer (FTIR) (Thermo Fisher, USA). Raman spectra were obtained by the DXR laser confocal micro-Raman spectrometer (Thermo Fisher, USA). The pore size of the SAC was quantified by the nitrogen adsorption/desorption curves using a fully automated surface and porosity tester (Quantachrome, USA) and BET analysis. The zeta potential was measured by particle size and zeta analyzer (Zetasizer Nano-ZS 90, Malvern, USA). The thermogravimetric (TG) analysis used Q500 Thermo Gravimetric Analyzer (TA, USA).
2.4 Batch adsorption study
2.4.1 Adsorption property measurement. 0.1 g of each of the four different kinds of SAC samples (SACN′, SACU, SACPF′, and SACU–PF′) were added to 100 mL of Cd2+ solution with an initial concentration of 10 mg L−1. The samples were placed in a water bath with an oscillating chamber at 25 °C and a speed of 100 r per min. During the oscillation process, samples were taken out at different times. The concentration of Cd2+ was measured at 228 nm using flame atomic absorption spectrometry (ZEEnit700P). The adsorption capacity and rate were calculated using eqn (1) and (2), respectively.| | |
Adsorption capacity: q = V(C0 − Ct)/m
| (1) |
| |
 | (2) |
q (mg g−1) is the adsorption capacity at that instant, V (L) is the volume of adsorbent solution, C0 (mg L−1) is the initial mass concentration of adsorbent in the solution, Ct is the mass concentration of adsorbent in the solution at the reaction time, m (g) is the mass of adsorbent, and R is the removal efficiency.
2.4.2 Research methods of adsorption kinetics. Dilute 1 g L−1 of Cd2+ reserve solution to 10 mg L−1 and take 100 mL of Cd2+ solution into a 150 mL conical flask. The solution pH will be the initial pH. Then add 0.1 g each of four kinds of SAC, and shake at 25 °C, 100 r per min at a constant temperature. The samples were measured at different time intervals (4, 8, 16, 30, 60, 90, 120, 240, 360, 480, 600, 720 min).Pseudo-first-order model (eqn (3)), pseudo-second-order kinetic model (eqn (4)) and intra particle diffusion model (eqn (5)) were used to fit:16
| |
log(qe − qt) = log![[thin space (1/6-em)]](https://www.rsc.org/images/entities/char_2009.gif) qe − k1t qe − k1t
| (3) |
| |
 | (4) |
where
qe (mg g
−1) represents the equilibrium adsorption capacity,
qt (mg g
−1) is the adsorption capacity at time
t,
k1 (min
−1) and
k2 (g mg
−1 min
−1) are the first-and second-order adsorption rate constants,
t (min) is the time,
k (mg g
−1 min
−0.5) is the internal diffusion rate constant, and the intercept
b corresponds to the boundary layer effect.
2.4.3 Adsorption isotherm study. The 100 mg L−1 Cd2+ reserve solution was successively diluted to 2.5, 5, 7.5, 10, and 12.5 mg L−1, respectively. 100 mL was placed in a 150 mL conical flask, and 0.1 g of the four SAC samples were added. The oscillation box was maintained at 25 °C for 12 h at 100 r per min.The adsorption isotherm fitting models include the Langmuir type (eqn (6)) and Freundlich type (eqn (7)), which are the commonly used isotherms to describe multilayer adsorption:17
| |
 | (6) |
| |
 | (7) |
where
qe (mg g
−1) represents the equilibrium adsorption capacity,
Qm (mg g
−1) represents saturated adsorption capacity,
Ce is the equilibrium concentration (mg L
−1), and
KL is the Langmuir adsorption constant. The
Qm value is proportional to the adsorption capacity.
KL represents the binding capacity to the adsorption site. 1/
n is a constant related to adsorption, and
Kf is the Freundlich adsorption constant.
2.4.4 SAC regeneration. SAC was regenerated by the solvent method, and the effects of different regenerators on the regeneration of SACU–PF′ were analyzed. 0.5 g of the adsorbed SACU–PF′ was placed in several beakers, and 0.1 mol L−1 of HNO3 solution, 0.1 mol L−1 of NaOH solution, and 2 mmol L−1 of EDTA solution were configured accordingly. 50 mL of the regeneration solution was added to the beaker filled with saturated SAC for adsorption for a duration of 12 h. The regenerated SAC was washed with deionized water to neutralize. It was then dried and made to adsorb Cd2+ again. The process was repeated 5 times, and the results were compared.
3. Results and discussion
3.1 Characterization of SAC adsorbent
Fig. 2 shown the SEM and TEM images of four kinds of SAC samples. The surface of SACN′ was rough and not smooth, and the surface particles showed no obvious pore accumulation structure. In Fig. 2(b1 and b2), some lamellar or flocculent pore structures appeared in SACU, indicating that CH4N2O could modify the surface of SAC to some extent. SACPF′ in Fig. 2(c1) had an obvious uniform granular structure. From Fig. 2(d1) corresponding to SACU–PF′, it was obvious that the material surface obtained by mixing CH4N2O and K2FeO4 with nitrogen doping also had many uniform granular pore structures, and these structures tend to stack and aggregate, leading to an obvious pore structure.4,12 Fig. 2 showed high-resolution TEM images for the four samples. After comparison, it was found that the modified SAC had obvious characteristics, the shape of SACN′ was irregular, the shape of SACU was fluffy, and SACPF′ and SACU–PF′ exhibited a flake square-like shape.
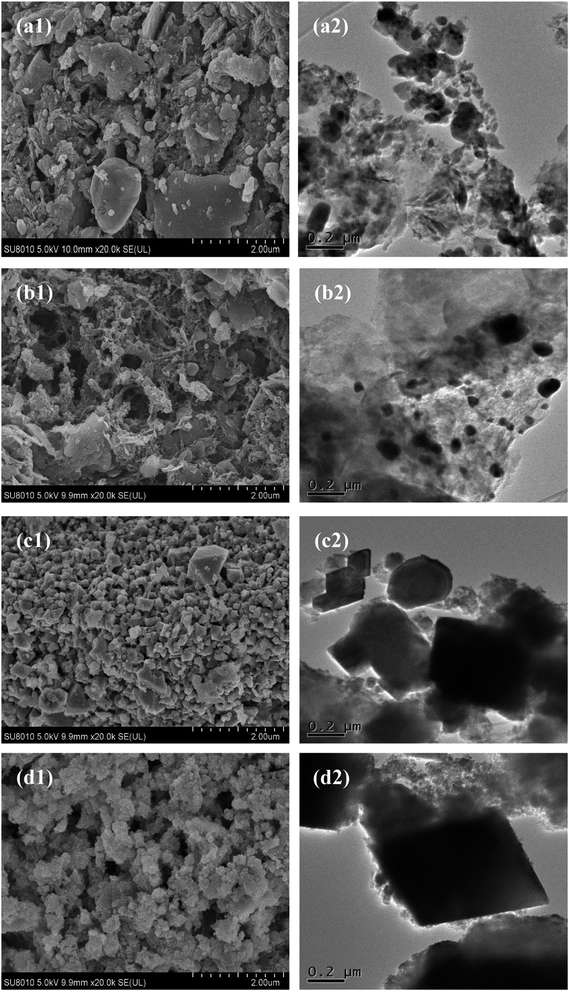 |
| | Fig. 2 SEM and TEM images of (a1 and a2) SACN′, (b1 and b2) SACU, (c1 and c2) SACPF′, and (d1 and d2) SACU–PF′. | |
Fig. 3(a) shown the XRD spectra of four kinds of SAC. It can be seen from the figure that all the four SAC had diffraction peaks at 2θ = 26.57°, which can be considered as a 002 crystalline graphite structure plane. The peak values of about 2θ = 36° represent amorphous carbon. According to the comparison of JCPDS card no. (41-1487) standard card, it was found that the diffraction peak near 21° and 26° of 2θ could be related to the diffraction of quartz (SiO2), and the signal still existed after modification. Thus suggesting that SiO2 is the main crystalline state of SAC.6,18 The XPS results are shown in Fig. 3(b). The peaks at 283.6 (±0.3 eV), 530.7 (±0.3 eV), and 399.7 (±0.3 eV) in the spectra, respectively, represented the binding energies of C1s, O1s, and N1s, whereas the O/C ratio of the unmodified material was increased from 0.77 to 4.65. The oxygen content in SACU–PF′ reached up to 73.92%, indicating that the surface of the material contains many oxygen-containing functional groups, which was consistent with the analysis of FTIR results.19
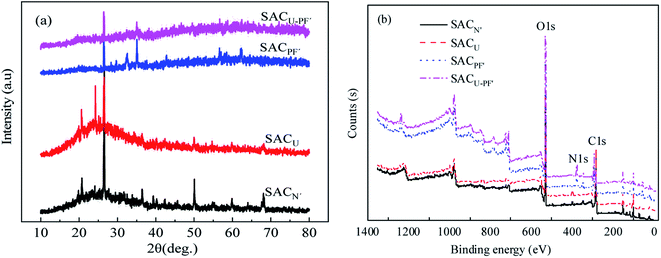 |
| | Fig. 3 (a) XRD and (b) XPS patterns of SACN′, SACU, SACPF′, and SACU–PF′. | |
The FTIR of the four SAC was shown in Fig. 4(a). It can be seen from the spectrum that there were many carbon and oxygen functional groups present in the sample. The peak value at 527 cm−1 belonged to SiO42− asymmetric angular motion, the peak value at 626 cm−1 was caused by C–O–H vibration, and the one at 777 cm−1 represented the stretching vibration of Si–C. 970 cm−1 and 1068 cm−1 peaks corresponded to the C–O–C stretching vibration, 1298 cm−1 belonged to the diffraction peak caused by C–N stretching vibration, and 1293 cm−1 and 1541 cm−1 belonged to C![[double bond, length as m-dash]](https://www.rsc.org/images/entities/char_e001.gif) C stretching vibration.20 SACN′ was characterized by the antisymmetric stretching vibration of CO32− at 1390–1510 cm−1. In SACU, after modification by CH4N2O, the diffraction peak of C
C stretching vibration.20 SACN′ was characterized by the antisymmetric stretching vibration of CO32− at 1390–1510 cm−1. In SACU, after modification by CH4N2O, the diffraction peak of C![[double bond, length as m-dash]](https://www.rsc.org/images/entities/char_e001.gif) N stretching vibration appeared at 1370–1610 cm−1, and it possessed a carbonyl C
N stretching vibration appeared at 1370–1610 cm−1, and it possessed a carbonyl C![[double bond, length as m-dash]](https://www.rsc.org/images/entities/char_e001.gif) O stretching vibration at 1756 cm−1. The peak at 2892 cm−1 can be ascribed to the symmetrical motion of CH2 alkane. Similarly, the peak at 3430 cm−1 corresponded to O–H stretching vibration of liquid water, and 3005 cm−1 belonged to = C–H.21 The strength of the O–H peak corresponding to 3688 cm−1 was enhanced after modification, indicating that the hydrophilic groups on the surface of SAC increased after modification.11 Raman spectrum analysis further studied the structure of SAC, and the results are shown in Fig. 4(b). SACN′, SACU, and SACU–PF′ samples all exhibited a D band at 1320 cm−1, which suggested the presence of defect sites or disordered sp2 hybridization related to graphitized carbon atoms and plane vibration G band (1600 cm−1) of SP2 bonded carbon atoms in a two-dimensional hexagon.18 The degree of graphitization was directly proportional to the ratio of the intensity of D to G-band; that is, the higher the IG
O stretching vibration at 1756 cm−1. The peak at 2892 cm−1 can be ascribed to the symmetrical motion of CH2 alkane. Similarly, the peak at 3430 cm−1 corresponded to O–H stretching vibration of liquid water, and 3005 cm−1 belonged to = C–H.21 The strength of the O–H peak corresponding to 3688 cm−1 was enhanced after modification, indicating that the hydrophilic groups on the surface of SAC increased after modification.11 Raman spectrum analysis further studied the structure of SAC, and the results are shown in Fig. 4(b). SACN′, SACU, and SACU–PF′ samples all exhibited a D band at 1320 cm−1, which suggested the presence of defect sites or disordered sp2 hybridization related to graphitized carbon atoms and plane vibration G band (1600 cm−1) of SP2 bonded carbon atoms in a two-dimensional hexagon.18 The degree of graphitization was directly proportional to the ratio of the intensity of D to G-band; that is, the higher the IG![[thin space (1/6-em)]](https://www.rsc.org/images/entities/char_2009.gif) :
:![[thin space (1/6-em)]](https://www.rsc.org/images/entities/char_2009.gif) ID ratio, the better the graphitization effect. Data from the figure suggests that IG
ID ratio, the better the graphitization effect. Data from the figure suggests that IG![[thin space (1/6-em)]](https://www.rsc.org/images/entities/char_2009.gif) :
:![[thin space (1/6-em)]](https://www.rsc.org/images/entities/char_2009.gif) ID (SACU–PF′) > IG
ID (SACU–PF′) > IG![[thin space (1/6-em)]](https://www.rsc.org/images/entities/char_2009.gif) :
:![[thin space (1/6-em)]](https://www.rsc.org/images/entities/char_2009.gif) ID (SACPF′) > IG
ID (SACPF′) > IG![[thin space (1/6-em)]](https://www.rsc.org/images/entities/char_2009.gif) :
:![[thin space (1/6-em)]](https://www.rsc.org/images/entities/char_2009.gif) ID (SACU) > IG
ID (SACU) > IG![[thin space (1/6-em)]](https://www.rsc.org/images/entities/char_2009.gif) :
:![[thin space (1/6-em)]](https://www.rsc.org/images/entities/char_2009.gif) ID (SACN′). The above results indicated that the mixture of CH4N2O and K2FeO4 was successfully doped with nitrogen at high temperatures, resulting in an improvement in the crystallinity of graphite carbon. The SACU–PF′ was prepared via graphitization and nitriding.22
ID (SACN′). The above results indicated that the mixture of CH4N2O and K2FeO4 was successfully doped with nitrogen at high temperatures, resulting in an improvement in the crystallinity of graphite carbon. The SACU–PF′ was prepared via graphitization and nitriding.22
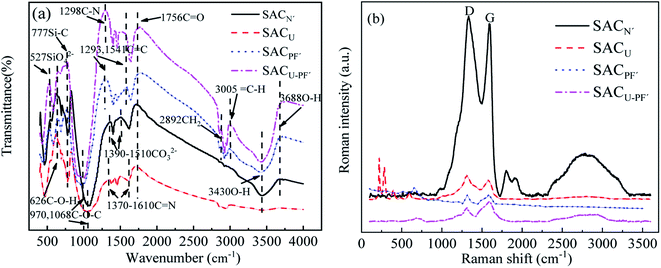 |
| | Fig. 4 (a) FTIR spectra and (b) Raman spectra of SACN′, SACU, SACPF′, and SACU–PF′. | |
The BET and BJH plots of the four SAC samples were classified as type IV according to IUPAC comparison results and were mainly mesoporous. Single-layer to multi-layer adsorption on the mesoporous wall led to slow growth of the low-pressure section. When P/P0 = 0.5–0.8, the adsorption amount increased significantly, reflecting the size of the sample aperture and suggesting whether the width of the change corresponded to the size of the mesopore.23 A hysteresis loop was observed in all materials, corresponding to the H3 hysteresis type, which was a slit hole of flake particle accumulation consistent with the results of BJH.18,24 The results in Fig. 5(a2–d2) and Table 1 showed that the BET and pore sizes of SACN′, SACU, SACPF′, and SACU–PF′ were 35.19, 69.16, 55.99, 56.73 m2 g−1, and 13.42, 47.99, 21.36, 27.85 nm, respectively, moreover, all SAC were mesoporous. By comparison, it was found that the peak height of SACN′ was the lowest, while the other three were almost similar. This observation indicates that the number of SACN′ pores was small, and SACN′ and SACPF′ were microporous structures. While SACU and SACU–PF′ were large mesoporous structures and SACPF′ had the narrowest peak, indicating that the pore size was uneven.25
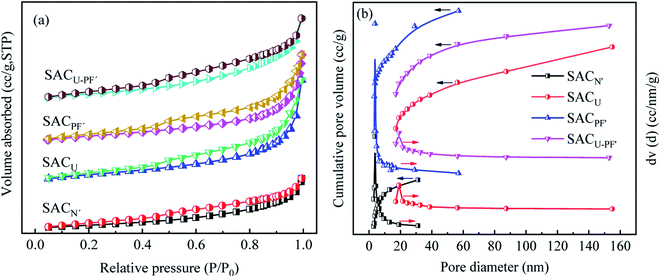 |
| | Fig. 5 (a) N2 adsorption–desorption isotherm and (b) BJH desorption pore size distribution of SACN′, SACU, SACPF′, and SACU–PF′. | |
Table 1 BET and BJH analysis of four SAC
| Adsorbents |
Average pore diameter (nm) |
Total pore volume (cm3 g−1) |
Specific surface area (m2 g−1) |
| SACN′ |
13.42 |
0.7680 |
35.19 |
| SACU |
47.99 |
0.5355 |
69.16 |
| SACPF′ |
21.36 |
0.8900 |
55.99 |
| SACU–PF′ |
27.85 |
0.5770 |
56.73 |
Fig. 6(a) shown the influence of pH on the zeta potential of four kinds of SAC. It can be seen from the figure that the zeta potentials of the four SAC were positive at pH = 2 and negative when pH = 6, so the pHPZC value lies between 2 to 6. At the respective pHPZC value, the amount of positive charge carried by the adsorbent will be equal to the amount of negative charge. This was because K2FeO4 contains acidic groups, while CH4N2O contains basic groups. As a result, after modification, the SAC exhibited weak acidity, attracted H+, and had a positive charge, so the zeta potential value was positive. Therefore, in the subsequent single-factor experiments, when the pH was adjusted between 2 to 6, it generated electrostatic repulsion with Cd2+ in the solution and adsorbed Cd2+ by electrostatic attraction when the pH was more than 6.26 In the Fig. 6(b), TG analysis shown that the four of SAC possessed good thermal stability, the TG variation was within 7%. As a carbon material, the decomposition of surface groups on SAC at high temperature leaded to a small amount of weight loss.
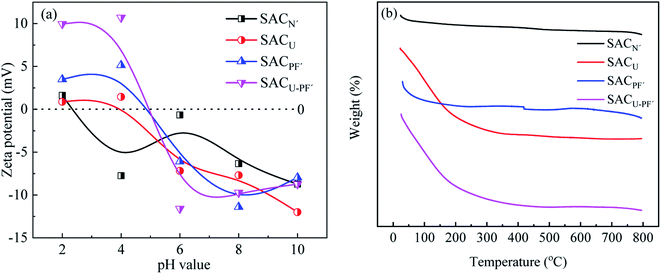 |
| | Fig. 6 (a) Zeta potential at varying pH and (b) TG of the four SAC. | |
3.2 Comparison of adsorption capacities of different SAC
The comparison of the adsorption capacity of Cd2+ by four different SAC was demonstrated in Fig. 7.
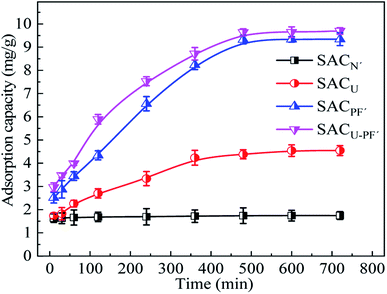 |
| | Fig. 7 Comparison of adsorption capacity of the four different SAC (Cd2+: 10 mg L−1; SAC: 0.1 g; pH: 6; T: 25 °C). | |
The results showed that K2FeO4 modified and K2FeO4 added with CH4N2O samples had significantly higher adsorption capacities than CH4N2O modified and unmodified SAC, and the maximum adsorption capacity of SACU–PF′ was 9.69 mg g−1, which was 5.5 times than that of SACN′. The adsorption capacities of SACU and SACPF′ was 4.54 and 9.34 mg g−1, respectively. Before 240 min, the adsorption rates of the four kinds of SAC were fast, and at about 480 min, adsorption equilibrium was attained. The rapid adsorption may be accounted to the availability of sufficient active sites, and the active sites gradually attain saturation during the process of adsorption. These results indicated that the mixed modification of K2FeO4 and CH4N2O improved the adsorption capacity of SAC. The adsorption capacity of SACU–PF′'s was slightly higher than SACPF′'s, possibly due to the further increase in the specific surface area caused by nitrogen doping.27
3.3 Effect of pH and temperature on SAC adsorbents
Fig. 8 demonstrated the influence of different initial pH and temperature on the adsorption of Cd2+ by four SAC samples.
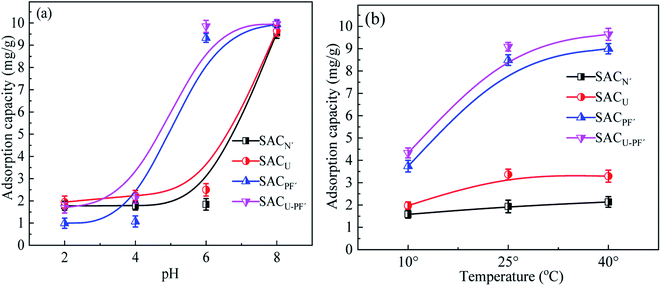 |
| | Fig. 8 The effects of (a) pH and (b) temperature on the adsorption of Cd2+ by the four different SAC (Cd2+: 10 mg L−1; SAC: 0.1 g; reaction time: 720 min). | |
With the increase of pH of Cd2+ solution from 2 to 8, the adsorption capacity of SAC also increased gradually. At a low pH value, the adsorption capacity of the material was also low because hydroxyl was not readily available, and the binding sites for adsorption of Cd2+ became fewer. H+ competed with heavy metal Cd2+ for the active sites.28 When the pH exceeded the initial value of 6, the adsorption capacity of SACPF′ and SACU–PF′ exhibited little difference, and the adsorption capacity of SACU–PF′ could reach up to 9.96 mg g−1. However, when the pH of SACN′ and SACU was about 8, the adsorption capacity of SACN′ and SACU showed obvious improvement. At a higher pH, a negative charge was easily formed on the surface of the adsorbent, which generated electrostatic binding with Cd2+, leading to a good adsorption efficiency. In addition to electrostatic interaction, metal ion precipitation also existed.29 Pezoti O.30 used the same explanation upon exploring the influence of pH on the adsorbent. Strong acid and strong base affected the surface charge distribution and properties of sludge-carbon material, thereby changing the electrostatic interaction between the material and Cd2+, which could also be explained based on zeta potential analysis. To explore the effect of temperature on the adsorption of Cd2+ by SAC, three temperature gradients of 10, 25, and 40 °C were selected for the study. The results showed that temperature variation on SACN′ and SACU had little effect on the adsorption efficiency, and the adsorption effect of these two materials was poor. The temperature had a certain effect on SACPF′ and SACU–PF′. The reason may be that at low temperatures, the activation energy of solute molecules was low, and the active sites were few, which was not conducive to adsorption. As the temperature was initially increased, the active sites also increased, but when the temperature continued to rise, the active sites gradually became saturated.31
3.4 Adsorption kinetics
The adsorption kinetics fitting results of the adsorption model of Cd2+ in four different SAC are shown in Fig. 9 and 10. Table 2 presents the parameters of the kinetics model.
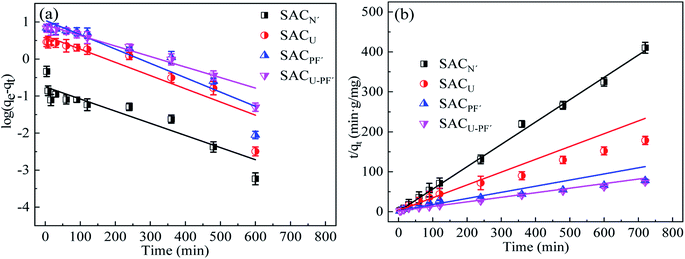 |
| | Fig. 9 (a) Pseudo-first order and (b) pseudo-second order kinetic model of Cd2+ adsorption by the four SAC (Cd2+: 10 mg L−1; SAC: 0.1 g; pH: 6; T: 25 °C; reaction time: 720 min). | |
Table 2 The kinetic parameters and intra-particle diffusion parameters of four SAC
| Adsorbents |
First-order kinetic model |
Second-order kinetic model |
Intra particle diffusion parameters |
| qe (mg g−1) |
k1 (min−1) |
R2 |
qe (mg g−1) |
k2 (g mg−1 min−1) |
R2 |
KP1KP2 (mg·(g min1/2)−1) |
R12R22 |
| SACN′ |
0.187 |
0.008 |
0.879 |
1.789 |
0.395 |
0.984 |
0.014 |
0.047 |
| 0.005 |
0.969 |
| SACU |
4.209 |
0.008 |
0.839 |
4.231 |
0.019 |
0.869 |
0.115 |
0.963 |
| 0.125 |
0.934 |
| SACPF′ |
11.061 |
0.009 |
0.868 |
8.521 |
0.006 |
0.955 |
0.206 |
0.97 |
| 0.343 |
0.843 |
| SACU–PF′ |
8.698 |
0.007 |
0.953 |
8.767 |
0.007 |
0.996 |
0.248 |
0.969 |
| 0.288 |
0.891 |
The comparison between Fig. 9 and Table 2 indicates that the correlation coefficient, R2, of the second-order kinetic model was better than that of the first-order kinetic model, so it was more consistent with the adsorption process of Cd2+. In addition, the correlation coefficient of SACU–PF′ was the highest (R2 = 0.996), and the calculated equilibrium adsorption value (qe) of SACU–PF′ using second-order kinetic simulation was 8.767, which showed the least deviation from the experimental value of 9.69. Therefore, based on the above analysis, the adsorption behavior of SACU–PF′ for Cd2+ was more apt to be fitted with the second-order kinetic model, mainly relying on electrostatic attraction for adsorption.32 As can be seen from Fig. 10, SACU–PF′ particle diffusion model in the fitting curve is divided into two sections. The first stage was mainly for the spread of microporous adsorption and diffusion of ions in the solution to the active sites on the surface of the adsorbent. The second stage ions continue to be diffused into microporous and mesoporous channels, with higher rates for SACPF′ and SACU–PF′ in the second stage, indicating the dominance of mesoporous adsorption.33
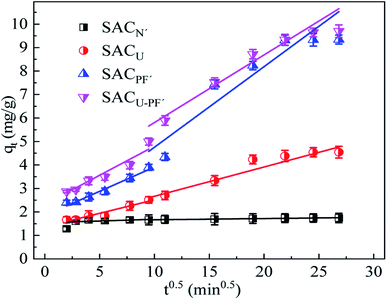 |
| | Fig. 10 Intra-particle diffusion model of Cd2+ adsorption by the four SAC (Cd2+: 10 mg L−1; SAC: 0.1 g; pH: 6; T: 25 °C; reaction time: 720 min). | |
3.5 Adsorption isotherms
The fitting results of Langmuir type and Freundlich type adsorption thermodynamics are demonstrated in Fig. 11 and Table 3.
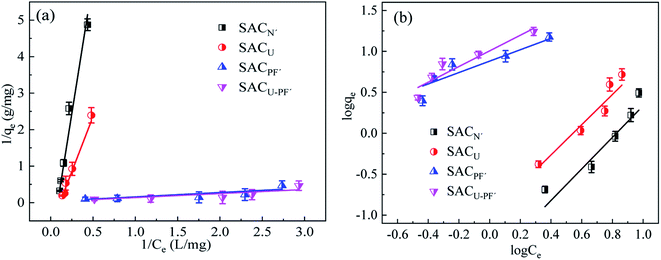 |
| | Fig. 11 (a) Langmuir and (b) Freundlich isotherm model of Cd2+ adsorption by the four SAC (SAC: 0.1 g; pH: 6; T: 25 °C; reaction time: 720 min). | |
Table 3 Freundlich and Langmuir adsorption isotherm simulation parameters of four SAC
| Adsorbents |
Langmuir |
Freundlich |
| Qm (mg g−1) |
kL (L mg−1) |
R2 |
n |
kf (mg g −1(mg L−1)−1/n) |
R2 |
| SACN′ |
0.834 |
0.082 |
0.95 |
0.519 |
0.026 |
0.832 |
| SACU |
1.531 |
0.109 |
0.932 |
0.542 |
0.099 |
0.881 |
| SACPF′ |
23.88 |
0.35 |
0.876 |
1.436 |
7.6 |
0.875 |
| SACU–PF′ |
23.3 |
0.389 |
0.954 |
1.046 |
10.144 |
0.863 |
According to the fitting results, the Langmuir isotherm model was quite consistent with the adsorption process of Cd2+, which is evident from the data given in Table 3. The correlation coefficient R2 of the Langmuir was higher than that of the Freundlich, and monomolecular adsorption was the main adsorption behavior.34,35 The fitting of the Freundlich isotherm model was poor, possibly due to the limited active sites on the surface of graphitized nitride sludge carbon material.36,37
3.6 Adsorption mechanism
According to the structural characteristics and adsorption performance of SAC, the mechanism of adsorption of Cd2+ by SAC was conjectured and displayed in Fig. 12. The adsorption mechanism mainly included pore filling, complexation, electrostatic attraction, and anion exchange. As a typical carbon structure, SAC had many pores in which Cd2+ could accumulate by pore filling. The heavy metal, Cd2+, and SAC adsorbent surface develop an electrostatic attraction. Due to the electrostatic attraction, metal ions are gathered on the SAC surface by the displacement of other ions, ion exchange, ion accumulation on the surface of the adsorbent, and physical adsorption. The metal ions and the material itself involves in complexation with oxygen-containing functional groups. The XPS spectra before and after adsorption were analyzed, and the results are demonstrated in Fig. 13(a). After adsorbing Cd2+ onto SAC, the characteristic peak of C–O exhibited a redshift, indicating the loss of electrons by C and O and consequently gain of electrons by Cd. According to the hybrid orbital theory, it may be observed in Fig. 13(b) that the lone pair of electrons from N 2s2p3, O 2s2p4, and hybrid orbital could occupy the Cd 5s2d10 orbital, and a strong force can be established between active groups (C–O, C–N) and the metal ion (Cd2+). This suggests that a coordinate bond (Cd–C, Cd–O, and Cd–N) could be validated between Cd2+ and the active group on the surface of SAC.38 According to the analysis of FTIR results, the surface of the adsorbent contained some anions, such as SO42− and CO32−, which could exchange ions with Cd2+.39 Similarly, the hydroxyl, carbonyl, and aldehyde groups on the surface of the adsorbent reacted with Cd2+. The result had also been confirmed by other studies, and the hydroxyl group in the adsorbent was responsible for the adsorption of heavy metals.40 In addition, according to the zeta potential, when pH < pHpzc, the adsorbent will have a more positive charge, leading to competition between Cd2+ and the adsorbent. When pH was higher, the adsorbent functional group will possess a negative charge, resulting in electrostatic attraction with Cd2+, thereby affecting the removal effect.41
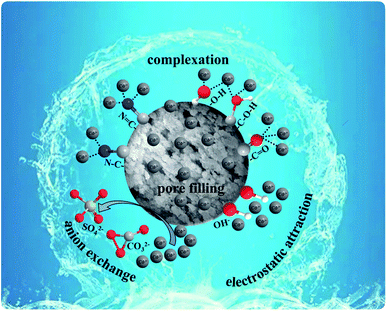 |
| | Fig. 12 Mechanism diagram of adsorption of Cd2+ by SACU–PF′. | |
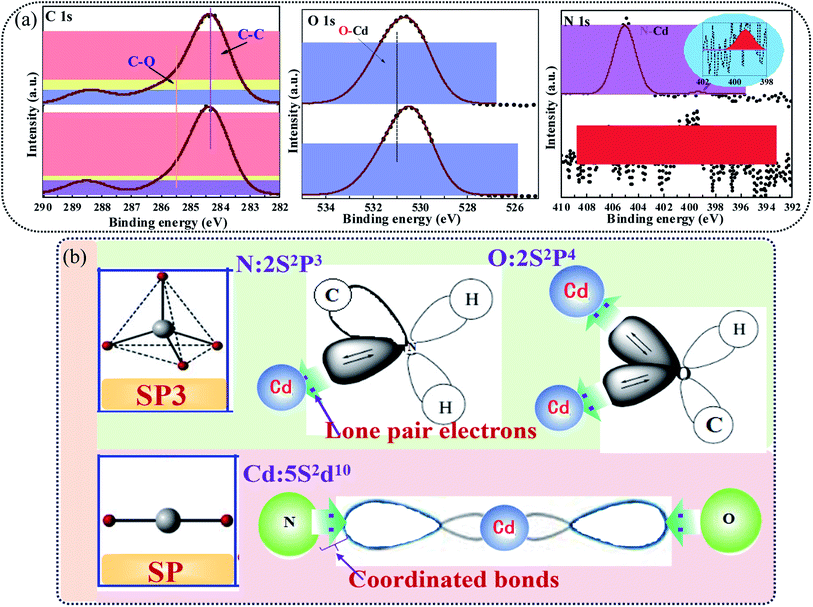 |
| | Fig. 13 Schematic illustration of (a) XPS spectra and (b) chemical bonding of Cd2+ by SACU–PF′. | |
3.7 SAC adsorbent regeneration
Strong acids, bases, and surfactants could regenerate metal sorbents.42 The analytical regeneration of SACU–PF′ with three different regenerating agents (HNO3, NaOH, and EDTA) and the readsorption of Cd2+ were subjected to study. The adsorption effect is illustrated in Fig. 14.
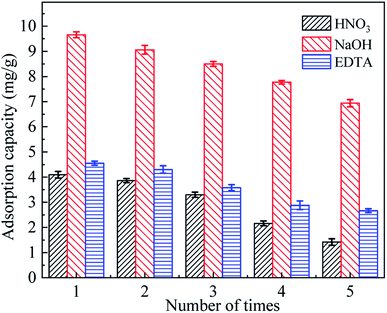 |
| | Fig. 14 Regeneration effect of three different regenerators on Cd2+ adsorption by SACU–PF′ (Cd2+: 10 mg L−1; SACU–PF′: 0.1 g; pH: 6; T: 25 °C; reaction time: 720 min). | |
As shown in Fig. 14, NaOH showed the best regeneration effect, and the adsorption capacity after five cycles reached 7.37 mg g−1, while EDTA showed the second-best effect, which may be related to the positive charge on the Cd2+ ion.43 After successive regeneration, the adsorption efficiency also gradually decreased, which may be due to incomplete desorption and ablative. It was worth noting that the performance of SACU–PF′ was even damaged to a certain extent.44 NaOH exhibited a good regeneration effect and could be used as a regenerating agent for recovering SACU–PF′ adsorbed with heavy metal ions. This result provided some theoretical support for subsequent studies on the regeneration of metal sorbents.
3.8 Application test of SAC
The application test of SACU–PF′ for low-concentration heavy metal removal from wastewater was performed. SACU–PF′ was employed to test different concentrations and types of metal ions, as displayed in Fig. 15.
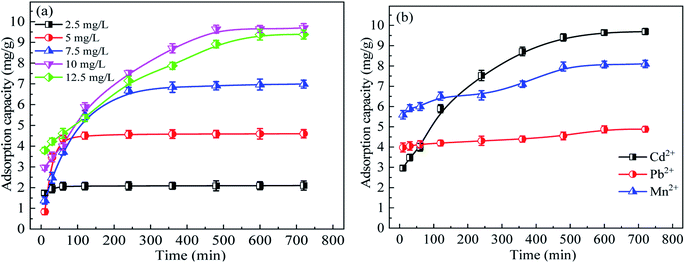 |
| | Fig. 15 (a) Adsorption of different initial concentration of Cd2+ and (b) different heavy metal ions by SACU–PF′ (concentration of heavy metal ions: 10 mg L−1; SACU–PF′: 0.1 g; pH: 6; T: 25 °C). | |
The adsorption effect of SACU–PF′ at different Cd2+ concentrations was shown in Fig. 15(a), from which it was evident that the adsorption amount increased with increasing the concentration, but when the concentration of Cd2+ exceeded 10 mg g−1, the adsorption effect decreased. Moreover, the adsorption amount at the concentration of 12.5 mg g−1 was lower than that at 10 mg g−1. Adsorption eventually became difficult and tended to equilibrate over time.11 Therefore, the SAC possesses a certain application value for low concentration metal removal from wastewater. Fig. 15(b) shows the adsorption effect of SACU–PF′ on Cd2+, Mn2+, and Pb2+. The adsorption capacity of Pb2+ was only 4.88 mg g−1, Mn2+ was 8.1 mg g−1, and Cd2+ was the best, 9.69 mg g−1. In addition, over time, the adsorption of Pb2+ and Mn2+ gradually slowed down, while the adsorption rate of Cd2+ was fast in the early stage and gradually flattened out later, which may be due to the presence of many adsorption sites in the early stage. As the adsorption progressed, the availability of adsorption sites decreased, and the adsorption became more and more difficult. It can be concluded that the SACU–PF′ can be used to adsorb other low concentrations of heavy metal from wastewater as well.
4. Conclusions
SACU–PF′ was prepared by multiple chemical modifications employing K2FeO4 and CH4N2O. Such modifications were executed based on the fact that suitable chemical activators could promote the characteristics of the SACU–PF′ by generating abundant pores with variable sizes and functional groups, which in turn was beneficial to the adsorption of Cd2+. The maximum adsorption capacity of SACU–PF′ was 9.69 mg g−1, 5.5 times that of SACN′. The SACU–PF′ adsorbent can be used in the removal of low concentrations of heavy metals from wastewater. The approach of multiple chemical modifications improved the adsorption performance of heavy metals in wastewater and increased the possibility of sludge resource utilization.
Conflicts of interest
There are no conflicts to declare.
Acknowledgements
This research was supported by the National Key R&D Program of China (2020YFC1908601, 2020YFC1908602). Science Development Fund Project of Hefei University (22040521004).
References
- K. Smith, G. Fowler and S. Pullket, et al., Sewage sludge-based adsorbents: A review of their production, properties and use in water treatment applications, Water Res., 2009, 43, 2569–2594 CrossRef CAS PubMed
 .
. - Y. Xiao, A. Raheem and L. Ding, et al., Pretreatment, modification and applications of sewage sludge-derived biochar for resource recovery-A review, Chemosphere, 2022, 287, 131969 CrossRef CAS PubMed
 .
. - A. Ros, M. A. Lillo-Rodenas and E. Fuente, et al., High surface area materials prepared from sewage sludge-based precursors, Chemosphere, 2006, 65(1), 132–140 CrossRef CAS PubMed
 .
. - B. Yan, L. H. Zhang and W. Jiang, et al., Research progress on producing sludge activated carbon doped with Ce, Prog. Environ. Sci. Eng., 2013, 610–613, 1565 Search PubMed
 .
. - D. Zhang, R. Hou and W. Wang, et al., Recovery and reuse of floc sludge for high-performance capacitors, Front. Environ. Sci. Eng., 2022, 16(6), 1–12 Search PubMed
 .
. - X. Chun, L. Wu and H. Li, et al., Effects of chemical modification on physicochemical properties and adsorption behavior of sludge-based activated carbon, J. Environ. Sci., 2021, 100(02), 342–354 Search PubMed
 .
. - H. Y. Kang, S. S. Park and Y. S. Rim, Preparation of activated carbon from paper mill sludge by KOH-activation, Korean J. Chem. Eng., 2006, 23(6), 948–953 CrossRef CAS
 .
. - L. J. Kong, Y. Xiong and S. H. Tian, et al., Preparation and characterization of a hierarchical porous char from sewage sludge with superior adsorption capacity for toluene by a new two-step pore-fabricating process, Bioresour. Technol., 2013, 146, 457–462 CrossRef CAS PubMed
 .
. - R. Z. Xie, W. J. Jiang and L. Wang, et al., Effect of pyrolusite loading on sewage sludge-based activated carbon in Cu(II), Pb(II), and Cd(II) adsorption, Environ. Prog. Sustainable Energy, 2014, 32(4), 1066–1073 CrossRef
 .
. - L. Wang, Y. Chen and W. J. Jiang, et al., Removal of Cu2+ from aqueous solution using sewage sludge-based activated carbons with pyrolusite modification, Environ. Sci. Technol., 2011, 34(11), 118–122 CAS
 .
. - M. Anbia and M. Haqshenas, Adsorption studies of Pb(II) and Cu(II) ions on mesoporous carbon nitride functionalized with melamine-based dendrimer amine. Iit, J. Environ. Sci. Technol., 2015, 12(8), 2649–2664 CAS
 .
. - S. T. Yang, Y. L. Chang and H. F. Wang, et al., Folding/aggregation of graphene oxide and its application in Cu2+ removal, J. Colloid Interface Sci., 2010, 351(1), 122–127 CrossRef CAS PubMed
 .
. - L. Zhu, L. J. You and Y. Wang, et al., The application of graphitic carbon nitride for the adsorption of Pb2+ ion from aqueous solution, Mater. Res. Express, 2017, 4(7), 075606 CrossRef
 .
. - R. A. Beygli, N. Mohaghegh and E. Rahimi, Metal ion adsorption from wastewater by g-C3N4 modified with hydroxyapatite: a case study from Sarcheshmeh acid mine drainage, Res. Chem. Intermed., 2019, 45(4), 2255–2268 CrossRef
 .
. - A. Yazdankhah, S. E. Moradi and S. Amirmahmoodi, et al., Enhanced sorption of cadmium ion on highly ordered nanoporous carbon by using different surfactant modification, Microporous Mesoporous Mater., 2010, 133(1–3), 45–53 CrossRef CAS
 .
. - J. P. Simonin, On the comparison of pseudo-first order and pseudo-second order rate laws in the modeling of adsorption kinetics, Chem. Eng. J., 2016, 300, 254–263 CrossRef CAS
 .
. - S. Banerjee, S. Mukherjee and A. LaminKa-ot, et al., Biosorptive uptake of Fe2+, Cu2+ and As5+ by activated biochar derived from Colocasia esculenta: Isotherm, kinetics, thermodynamics and cost estimation, J. Adv. Res., 2016, 7(5), 597–610 CrossRef CAS PubMed
 .
. - L. Sun, Y. Fu and C. G. Tian, et al., Isolated boron and nitrogen sites on porous graphitic carbon synthesized from nitrogen-containing chitosan for supercapacitors, Chemsuschem, 2014, 7(6), 1637–1646 CrossRef CAS PubMed
 .
. - O. Duman, C. O. Diker and S. Tunc, Development of highly hydrophobic and superoleophilic fluoro organothiol-coated carbonized melamine sponge/rGO composite absorbent material for the efficient and selective absorption of oily substances from aqueous environments, J. Environ. Chem. Eng., 2021, 9(2), 105093 CrossRef CAS
 .
. - A. F. M. Streit, L. N. Cortes and S. P. Druzian, et al., Development of high quality activated carbon from biological sludge and its application for dyes removal from aqueous solutions, Sci. Total Environ., 2019, 660, 277–287 CrossRef CAS PubMed
 .
. - K. B. Yang, J. H. Peng and C. Srunivasakannan, et al., Preparation of high surface area activated carbon from coconut shells using microwave heating, Bioresour. Technol., 2010, 101(15), 6163–6169 CrossRef CAS PubMed
 .
. - Y. N. Gong, D. L. Li and C. Z. Luo, et al., Highly porous graphitic biomass carbon as advanced electrode materials for supercapacitors, Green Chem., 2017, 19(17), 4132–4140 RSC
 .
. - M. Thommes, K. Kaneko and A. V. Neimark, et al., Physisorption of gases, with special reference to the evaluation of surface area and pore size distribution (IUPAC Technical Report), Pure Appl. Chem., 2015, 87(9–10), 1051–1069 CrossRef CAS
 .
. - L. Qi, T. Xu and Z. Wang, et al., Pore characterization of different types of coal from coal and gas outburst disaster sites using low temperature nitrogen adsorption approach, Int. J. Min. Sci. Technol., 2017, 27(2), 371–377 CrossRef CAS
 .
. - L. Yang, Y. Zhan and Y. Gong, et al., Development of eco-friendly CO2-responsive cellulose nanofibril aerogels as “green” adsorbents for anionic dyes removal, J. Hazard. Mater., 2021, 405, 124194 CrossRef CAS PubMed
 .
. - Y. Li, S. M. Zhu and Q. L. Liu, et al., N-doped porous carbon with magnetic particles formed in situ for enhanced Cr (VI) removal, Water Res., 2013, 47(12), 4188–4197 CrossRef CAS PubMed
 .
. - T. T. Song, W. J. Tian and K. L. Qiao, et al., Adsorption behaviors of polycyclic aromatic hydrocarbons and oxygen derivatives in wastewater on N-doped reduced graphene oxide, Sep. Purif. Technol., 2020, 254, 117565 CrossRef
 .
. - M. Zhang, Y. Zhang and R. Helleur, Selective adsorption of Ag+ by ion-imprinted O-carboxymethyl chitosan beads grafted with thiourea-glutaraldehyde, Chem. Eng. J., 2015, 264, 56–65 CrossRef CAS
 .
. - L. S. Hu, C. Y. Guang and Y. Liu, et al., Adsorption behavior of dyes from an aqueous solution onto composite magnetic lignin adsorbent, Chemosphere, 2020, 246, 125757 CrossRef CAS PubMed
 .
. - O. Pezoti, A. L. Cazetta and K. C. Bedin, et al., NaOH-activated carbon of high surface area produced from guava seeds as a high-efficiency adsorbent for amoxicillin removal: Kinetic, isotherm and thermodynamic studies, Chem. Eng. J., 2016, 288, 778–788 CrossRef CAS
 .
. - S. Chowdhury, J. Sikder and T. Mandal, et al., Comprehensive analysis on sorptive uptake of enrofloxacin by activated carbon derived from industrial paper sludge, Sci. Total Environ., 2019, 665, 438–452 CrossRef CAS PubMed
 .
. - X. Y. Guo, B. Du and Q. Wei, et al., Synthesis of amino functionalized magnetic graphenes composite material and its application to remove Cr(VI), Pb(II), Hg(II), Cd(II) and Ni(II) from contaminated water, J. Hazard. Mater., 2014, 278, 211–220 CrossRef CAS PubMed
 .
. - Y. Wang, W. N. Zhao and W. L. Zheng, et al., Preparation of N-doped carbon nanosheets from sewage sludge for adsorption studies of Cr(VI) from aqueous solution, Nanomaterials, 2019, 9(2), 265 CrossRef PubMed
 .
. - M. Naushad, T. Ahamad and B. M. Al-Maswari, et al., Nickel ferrite bearing nitrogen-doped mesoporous carbon as efficient adsorbent for the removal of highly toxic metal ion from aqueous medium, Chem. Eng. J., 2017, 330, 1351–1360 CrossRef CAS
 .
. - X. H. Thi, E. Roseline and D. Martin, et al., Nitrogen-doped graphitized carbon electrodes for biorefractory pollutant removal, J. Phys. Chem. C, 2017, 128(21), 15188–15197 Search PubMed
 .
. - Z. G. Liu, F. Zhang and T. T. Liu, et al., Removal of azo dye by a highly graphitized and heteroatom doped carbon derived fromfish waste: Adsorption equilibrium and kinetics, J. Environ. Manage., 2016, 182, 446–454 CrossRef CAS PubMed
 .
. - J. Lin and Y. Zhan, Adsorption of humic acid from aqueous solution onto unmodified and surfactant-modified chitosan/zeolite composites, Chem. Eng. J., 2012, 200, 202–213 CrossRef
 .
. - J. Huang, W. Wu, R. Zhang, G. Lu, B. Chen, Z. Chen and C. Gui, Novel electrode material using electroless nickel plating for triboelectric nanogenerator: Study of the relationship between electrostatic-charge density and strain in dielectric material, Nano Energy, 2022, 92, 106734 CrossRef CAS
 .
. - H. P. Nogueira, S. H. Toma and A. T. Silveira, et al., Efficient Cr(VI) removal from wastewater by activated carbon superparamagnetic composites, Microchem. J., 2019, 149, 104025 CrossRef CAS
 .
. - X. Dong, L. Q. Ma and Y. Zhu, et al., Mechanistic investigation of mercury sorption by Brazilian pepper biochars of different pyrolytic temperatures based on X-ray photoelectron spectroscopy and flow calorimetry, Environ. Sci. Technol., 2013, 47, 12156–12164 CrossRef CAS PubMed
 .
. - L. Zhou, Y. G. Liu and S. B. Liu, et al., Investigation of the adsorption-reduction mechanisms of hexavalent chromium by ramie biochars of different pyrolytic temperatures, Bioresour. Technol., 2016, 218, 351–359 CrossRef CAS PubMed
 .
. - L. Dabek, Sorption of zinc ions from aqueous solutions on regenerated activated carbons, J. Hazard. Mater., 2003, 101(2), 191–201 CrossRef CAS
 .
. - E. Dàna and A. Awad, Regeneration of spent activated carbon obtained from home filtration system and applying it for heavy metals adsorption, J. Environ. Chem. Eng., 2017, 5(4), 3091–3099 CrossRef
 .
. - S. Lata, P. K. Singh and S. R. Samadder, Regeneration of adsorbents and recovery of heavy metals: a review, Int. J. Environ. Sci. Technol., 2015, 12(4), 1461–1478 CrossRef CAS
 .
.
|
| This journal is © The Royal Society of Chemistry 2022 |
Click here to see how this site uses Cookies. View our privacy policy here.  Open Access Article
 *ab,
Xiaowan Donga,
Sisi Caoa,
Zhaoming Chena,
Xiaohong Yanga and
Jie Jina
![[double bond, length as m-dash]](https://www.rsc.org/images/entities/char_e001.gif) N and C–O. The adsorption capacity of SACU–PF′ for Cd2+ was 9.69 mg g−1, 5.5 times that of SACN′, the adsorption process of Cd2+ by SACU–PF′ fitted well for the second-order kinetic model and Langmuir isothermal adsorption model. The XPS and chemical analysis revealed that SACU–PF′ and Cd2+ were bonded by functional groups, and the Cd2+ removal by SACU–PF′ was through complexation, anion exchange, electrostatic attraction, and pore filling. The SACU–PF′ was exhibited different removal capacities for different metals, Pb2+ and Mn2+ correspond to adsorption capacities of 4.9 and 8.1 mg g−1. In addition, the adsorbed SACU–PF′ can be regenerated by sodium hydroxide. The study highlights the importance of multiple chemical modifications performed on SAC, the double coupled chemical modifications to ensure its good performance in the treatment of heavy metals in wastewater treatment.
N and C–O. The adsorption capacity of SACU–PF′ for Cd2+ was 9.69 mg g−1, 5.5 times that of SACN′, the adsorption process of Cd2+ by SACU–PF′ fitted well for the second-order kinetic model and Langmuir isothermal adsorption model. The XPS and chemical analysis revealed that SACU–PF′ and Cd2+ were bonded by functional groups, and the Cd2+ removal by SACU–PF′ was through complexation, anion exchange, electrostatic attraction, and pore filling. The SACU–PF′ was exhibited different removal capacities for different metals, Pb2+ and Mn2+ correspond to adsorption capacities of 4.9 and 8.1 mg g−1. In addition, the adsorbed SACU–PF′ can be regenerated by sodium hydroxide. The study highlights the importance of multiple chemical modifications performed on SAC, the double coupled chemical modifications to ensure its good performance in the treatment of heavy metals in wastewater treatment.
![[thin space (1/6-em)]](https://www.rsc.org/images/entities/char_2009.gif) qe − k1t
qe − k1t


![[double bond, length as m-dash]](https://www.rsc.org/images/entities/char_e001.gif) C stretching vibration.20 SACN′ was characterized by the antisymmetric stretching vibration of CO32− at 1390–1510 cm−1. In SACU, after modification by CH4N2O, the diffraction peak of C
C stretching vibration.20 SACN′ was characterized by the antisymmetric stretching vibration of CO32− at 1390–1510 cm−1. In SACU, after modification by CH4N2O, the diffraction peak of C![[double bond, length as m-dash]](https://www.rsc.org/images/entities/char_e001.gif) N stretching vibration appeared at 1370–1610 cm−1, and it possessed a carbonyl C
N stretching vibration appeared at 1370–1610 cm−1, and it possessed a carbonyl C![[double bond, length as m-dash]](https://www.rsc.org/images/entities/char_e001.gif) O stretching vibration at 1756 cm−1. The peak at 2892 cm−1 can be ascribed to the symmetrical motion of CH2 alkane. Similarly, the peak at 3430 cm−1 corresponded to O–H stretching vibration of liquid water, and 3005 cm−1 belonged to = C–H.21 The strength of the O–H peak corresponding to 3688 cm−1 was enhanced after modification, indicating that the hydrophilic groups on the surface of SAC increased after modification.11 Raman spectrum analysis further studied the structure of SAC, and the results are shown in Fig. 4(b). SACN′, SACU, and SACU–PF′ samples all exhibited a D band at 1320 cm−1, which suggested the presence of defect sites or disordered sp2 hybridization related to graphitized carbon atoms and plane vibration G band (1600 cm−1) of SP2 bonded carbon atoms in a two-dimensional hexagon.18 The degree of graphitization was directly proportional to the ratio of the intensity of D to G-band; that is, the higher the IG
O stretching vibration at 1756 cm−1. The peak at 2892 cm−1 can be ascribed to the symmetrical motion of CH2 alkane. Similarly, the peak at 3430 cm−1 corresponded to O–H stretching vibration of liquid water, and 3005 cm−1 belonged to = C–H.21 The strength of the O–H peak corresponding to 3688 cm−1 was enhanced after modification, indicating that the hydrophilic groups on the surface of SAC increased after modification.11 Raman spectrum analysis further studied the structure of SAC, and the results are shown in Fig. 4(b). SACN′, SACU, and SACU–PF′ samples all exhibited a D band at 1320 cm−1, which suggested the presence of defect sites or disordered sp2 hybridization related to graphitized carbon atoms and plane vibration G band (1600 cm−1) of SP2 bonded carbon atoms in a two-dimensional hexagon.18 The degree of graphitization was directly proportional to the ratio of the intensity of D to G-band; that is, the higher the IG![[thin space (1/6-em)]](https://www.rsc.org/images/entities/char_2009.gif) :
:![[thin space (1/6-em)]](https://www.rsc.org/images/entities/char_2009.gif) ID ratio, the better the graphitization effect. Data from the figure suggests that IG
ID ratio, the better the graphitization effect. Data from the figure suggests that IG![[thin space (1/6-em)]](https://www.rsc.org/images/entities/char_2009.gif) :
:![[thin space (1/6-em)]](https://www.rsc.org/images/entities/char_2009.gif) ID (SACU–PF′) > IG
ID (SACU–PF′) > IG![[thin space (1/6-em)]](https://www.rsc.org/images/entities/char_2009.gif) :
:![[thin space (1/6-em)]](https://www.rsc.org/images/entities/char_2009.gif) ID (SACPF′) > IG
ID (SACPF′) > IG![[thin space (1/6-em)]](https://www.rsc.org/images/entities/char_2009.gif) :
:![[thin space (1/6-em)]](https://www.rsc.org/images/entities/char_2009.gif) ID (SACU) > IG
ID (SACU) > IG![[thin space (1/6-em)]](https://www.rsc.org/images/entities/char_2009.gif) :
:![[thin space (1/6-em)]](https://www.rsc.org/images/entities/char_2009.gif) ID (SACN′). The above results indicated that the mixture of CH4N2O and K2FeO4 was successfully doped with nitrogen at high temperatures, resulting in an improvement in the crystallinity of graphite carbon. The SACU–PF′ was prepared via graphitization and nitriding.22
ID (SACN′). The above results indicated that the mixture of CH4N2O and K2FeO4 was successfully doped with nitrogen at high temperatures, resulting in an improvement in the crystallinity of graphite carbon. The SACU–PF′ was prepared via graphitization and nitriding.22


.
.
.
.
.
.
.
.
.
.
.
.
.
.
.
.
.
.
.
.
.
.
.
.
.
.
.
.
.
.
.
.
.
.
.
.
.
.
.
.
.
.
.
.


